


1. Introduction
The closure of the Iapetus Ocean (510–410 Ma) was one of the most significant events in the geological evolution of northwestern Europe (e.g. Trench & Torsvik, Reference Trench and Torsvik1992; Cocks & Torsvik, Reference Cocks, Torsvik, Gee and Stephenson2006, Reference Cocks and Torsvik2011; Murphy & Nance, Reference Murphy and Nance2008; van Staal et al. Reference van Staal, Whalen, Valverde-Vaquero, Zagorevski, Rogers, Murphy, Keppie and Hynes2009). However, our understanding of the tectonomagmatic development, both of this ocean and of the marginal subduction zones along which Iapetus oceanic crust was ultimately consumed, is restricted to somewhat limited exposures. The igneous rocks of the Fishguard Volcanic Group in SW Wales represent an excellently preserved example of rocks associated with the closure of the Iapetus Ocean.
During the emplacement of the Fishguard Volcanic Group in early–middle Ordovician time (485–458 Ma), Wales formed part of the southern margin of the closing Iapetus Ocean. Avalonia (the microcontinent of which Wales was a part) moved northward from 55°S to 30°S in the period from the Arenig (478–467 Ma) to the Ashgill (451–444 Ma) (Fitton, Thirlwall & Hughes, Reference Fitton, Thirlwall, Hughes and Thorpe1982). During this period a number of island arc chains and marginal basins formed above the southeastward-dipping subduction zone on the north side of Avalonia along a NE-trending plate margin (Fitton & Hughes Reference Fitton and Hughes1970; Phillips, Stillman & Murphy, Reference Phillips, Stillman and Murphy1976; Fitton, Thirlwall & Hughes, Reference Fitton, Thirlwall, Hughes and Thorpe1982; Murphy & Nance, Reference Murphy and Nance2008; Murphy, Hamilton & LeBlanc, Reference Murphy, Hamilton and LeBlanc2011). Ordovician sequences of both basic and/or silicic lavas are present not only in the Fishguard region but throughout Wales, in areas such as Snowdonia and Ramsey Island (Fig. 1) (Kokelaar et al. Reference Kokelaar, Howells, Bevins, Roach, Dunkley, Kokelaar and Howells1984 b).

Figure 1. Map adapted from Bevins et al. (Reference Bevins, Lees and Roach1991) showing the location of the Ordovician igneous rocks of north Pembrokeshire and the rest of Wales in relation to one another. The rock types of the study area are also shown.
A re-evaluation of the Fishguard Volcanic Group is required as earlier studies were based on a limited range of geochemical elements. Furthermore, previous geochemical investigations have shown that the rocks are similar in composition to present-day mid-ocean ridge basalt (MORB), while also displaying a relative depletion in Nb (Bevins, Reference Bevins1982). However, the use of tungsten carbide crushing mills in these earlier studies may have affected the Nb concentration of the rocks (e.g. Hickson & Juras, Reference Hickson and Juras1986) and so to avoid this problem this study has used agate crushing mills. This study presents new major and trace element geochemical data and petrographic observations to re-evaluate the petrogenesis and tectonic setting of the Llanvirn-age (467–458 Ma) Fishguard Volcanic Group.
2. Local geology and previous work
Most of the Ordovician volcanism in west Wales occurred in the period from the Arenig to the Llanvirn (478–458 Ma) (Thomas & Thomas, Reference Thomas and Thomas1956; Bevins & Roach, Reference Bevins, Roach, Harris, Holland and Leake1979). The overall consensus is that the Ordovician rocks of Wales were emplaced in a supra-subduction back-arc basin, in a mostly submarine environment on immature continental crust on the southeast side of the Iapetus Ocean (Bevins, Reference Bevins1982; Bevins, Kokelaar & Dunkley, Reference Bevins, Kokelaar and Dunkley1984; Kokelaar et al. Reference Kokelaar, Howells, Bevins, Roach, Dunkley, Kokelaar and Howells1984 b; Leat et al. Reference Leat, Jackson, Thorpe and Stillman1986). All of the Lower Palaeozoic rocks in Wales and the Welsh Borderland were affected by low-grade (zeolite to low-grade greenschist facies) metamorphism, primarily due to burial (Bevins & Rowbotham, Reference Bevins and Rowbotham1983; Bevins & Robinson, Reference Bevins and Robinson1988; Robinson et al. Reference Robinson, Reverdatto, Bevins, Polyansky and Sheplev1999).
Early work on the geology of the area was reported by Reed (Reference Reed1895), Cox (Reference Cox1930) and Thomas & Thomas (Reference Thomas and Thomas1956). The Fishguard Volcanic Group (Reed, Reference Reed1895; Thomas & Thomas, Reference Thomas and Thomas1956; R. E. Bevins, unpub. Ph.D. thesis, Univ. Keele, 1979; Bevins, Reference Bevins1982; Bevins, Kokelaar & Dunkley, Reference Bevins, Kokelaar and Dunkley1984; Kokelaar et al. Reference Kokelaar, Howells, Bevins, Roach, Dunkley, Kokelaar and Howells1984 b; Leat et al. Reference Leat, Jackson, Thorpe and Stillman1986; Bevins, Lees & Roach, Reference Bevins, Lees and Roach1991) is located in the Strumble Head to Fishguard area of north Pembrokeshire, Wales (Fig. 1), close to the older Trefgarn basaltic andesite to andesite lavas of Tremadoc age (485–478 Ma), which are thought to represent the products of a volcanic arc (Bevins, Kokelaar & Dunkley, Reference Bevins, Kokelaar and Dunkley1984).
Fishguard Volcanic Group samples were collected from an area around the Strumble Head Peninsula (Figs 1, 2). The volcanic group comprises three formations, from oldest to youngest: (1) the predominantly rhyodacitic to rhyolitic Porth Maen Melyn Volcanic Formation; (2) the pillowed basalts of the Strumble Head Volcanic Formation; and (3) the rhyolitic Goodwick Volcanic Formation (Bevins, Reference Bevins1982) (Fig. 2).

Figure 2. Geological map showing the locations of the samples analysed in this study. Also highlighted are the formations that have been sampled. The non-patterned portion of the map represents unrelated rocks and Quaternary cover.
The Porth Maen Melyn Volcanic Formation (Bevins & Roach, Reference Bevins, Roach, Harris, Holland and Leake1979) is composed principally of rhyolitic tuffs, ash flow tuffs, rhyolite lavas, autobreccias, debris flow breccias and, to a lesser extent, massive and pillowed rhyodacite lavas. Small volumes of intermediate magmas were also emplaced as microtonalite intrusions (Bevins & Roach, Reference Bevins, Roach, Harris, Holland and Leake1979).
Conformably overlying this formation is the Strumble Head Volcanic Formation. Basaltic pillow lavas with well-developed inter-pillow breccias, local elongate steeply inclined lava tubes and necking structures are found at the contact with the Porth Maen Melyn Volcanic Formation (Bevins, Reference Bevins1982). The formation also comprises massive lensoid lava sheets, thin hyaloclastites, basaltic tuffs, rare rhyolitic tuff horizons and high-level intrusive basaltic sheets (Bevins & Roach, Reference Bevins, Roach, Harris, Holland and Leake1979). The boundary between this formation and the overlying rhyolitic Goodwick Volcanic Formation is marked by a complex interdigitation of lavas and high-level intrusions (Kokelaar et al. Reference Kokelaar, Howells, Bevins, Roach, Kokelaar and Howells1984 a).
The Goodwick Volcanic Formation progresses stratigraphically upwards through thick rhyolitic domes and flows to autobrecciated rhyolites and fine tuffaceous silicic rocks which are intruded by a thick basic sill. The sill is bulbous at the base and pillowed at the top indicative of having been intruded into wet sediment (Kokelaar et al. Reference Kokelaar, Howells, Bevins, Roach, Kokelaar and Howells1984 a).
The volcanic group is composed of up to 1.8 km of volcanic and intrusive rocks, deposited in a locally subsiding basin (Kokelaar et al. Reference Kokelaar, Howells, Bevins, Roach, Kokelaar and Howells1984 a, b). The rocks were extruded in a mostly submarine environment with restricted occurrences of subaerial volcanism (Bevins, Reference Bevins1982; Kokelaar et al. Reference Kokelaar, Howells, Bevins, Roach, Kokelaar and Howells1984 a, b; Kokelaar, Reference Kokelaar1988). Sediment gravity flow deposits are found interstratified with the pillow lavas, although these are not derived from the lavas and so no topographic highs are thought to have developed (Kokelaar et al. Reference Kokelaar, Howells, Bevins, Roach, Kokelaar and Howells1984 a, b; Kokelaar, Reference Kokelaar1988).
The basaltic and intermediate lavas and intrusions were recognized as tholeiitic by Bevins (Reference Bevins1982) and were proposed to be derived by low-pressure fractional crystallization of a parental magma that originated in the upper mantle. Bevins, Lees & Roach (Reference Bevins, Lees and Roach1991) noted that some of the silicic intrusive and extrusive rocks display a calc-alkaline trend as opposed to a tholeiitic trend. It is uncertain whether the dacite and rhyolite magmas were derived from the same source as the basaltic rocks, although limited trace element data for the rhyolites reported by Bevins, Lees & Roach (Reference Bevins, Lees and Roach1991) are consistent with such an origin.
3. Petrography
Eighteen basic, intermediate and silicic rocks from the samples collected by R. E. Bevins (unpub. Ph.D. thesis, Univ. Keele, 1979) were re-examined petrographically (online Supplementary Material Table S1 available at http://journals.cambridge.org/geo). Basalt sample SB34 is from a pillow lava and contains tabular clinopyroxene, minor plagioclase, secondary chlorite and pumpellyite. Other pillowed basalts (samples SB31 and SB58) contain zoned clinopyroxene and plagioclase as microphenocrysts in a groundmass of spherulitic (quenched) clinopyroxene and plagioclase. Sample SB33 consists of tabular plagioclase and interstitial clinopyroxene with secondary chlorite and comes from a massive basaltic lava. The basaltic intrusions (samples LG3, LG1 and LG5) contain euhedral, subophitic clinopyroxene, altered tabular plagioclase, abundant chlorite and, in the case of LG5, epidote. Other intrusive basaltic sheets (samples REB166, SB22, SB44, SB28 and SB59) contain albitized plagioclase with subophitic clinopyroxene and chlorite. Samples SB54 and SB55 are also from intrusive basaltic sheets; however, they comprise clinopyroxene and plagioclase phenocrysts set in a finer feldspathic groundmass along with Fe–Ti oxides. The rhyolitic flow samples (SA11 and SA5) are fine grained with quartz-feldspar groundmass (most likely recrystallized from glass) and also contain quartz and epidote veins. Both the rhyodacite lava (sample REB94) and the microtonalite intrusion (sample REB342) contain plagioclase, quartz, chlorite and rare biotite. The field relations of these samples are discussed in detail in Bevins (Reference Bevins1982).
4. Analytical techniques
Eighteen samples (2 rhyolites, 2 dacites and 14 basalts) from the original sample set described and collected by R. E. Bevins (unpub. Ph.D. thesis, Univ. Keele, 1979) from a transect through the Fishguard Volcanic Group (Fig. 2 and online Supplementary Material Table S1 available at http://journals.cambridge.org/geo) were re-prepared and re-analysed for major and trace elements.
Following removal of weathered surfaces, the samples were crushed in a steel jaw crusher and powdered using an agate Tema mill at Cardiff University. Major and trace element abundances were analysed using a JY Horiba Ultima 2 inductively coupled plasma optical emission spectrometer (ICP-OES) and a Thermo X7 series inductively coupled plasma mass spectrometer (ICP-MS) at Cardiff University, Wales. Further information regarding methods and instruments are discussed in McDonald & Viljoen (Reference McDonald and Viljoen2006).
Accuracy and precision of the data were assessed using the international reference materials NIM-G and JB-1A (online Supplementary Material Table S2 available at http://journals.cambridge.org/geo). Relative standard deviations show accuracy of 1–5% for most major and trace elements for the standard materials used. Duplicate standard deviations are also within error, ensuring precision. A representative dataset can be found in Table 1 and the full dataset in the online Supplementary Material Table S3 available at http://journals.cambridge.org/geo.
Table 1. Major and trace element data for the Fishguard Volcanic Group

* denotes total iron
5. Geochemical results
5.a. Element mobility
The rocks analysed in this study have all undergone low-grade sub-greenschist facies metamorphism (Bevins & Rowbotham, Reference Bevins and Rowbotham1983; Robinson & Bevins, Reference Robinson and Bevins1986) and this is reflected in the abundance of chlorite observed in the thin-sections along with less common pumpellyite, prehnite and epidote. Varying degrees of albitization have affected the rocks and so the concentrations of Al, Ca and Na in particular have been modified (Bevins, Reference Bevins1982). Under such metamorphic conditions many elements, in particular the large-ion lithophile elements, become mobile. Accordingly, these elements are not representative of the original magmatic composition of the rocks and so cannot be used to assess the petrogenetic processes that the magmas have undergone. In this study, therefore, we will use trace elements generally regarded to be relatively immobile during low-grade metamorphism, i.e. HFSE (high-field-strength elements) and REE (rare earth elements) (e.g. Pearce & Cann, Reference Pearce and Cann1973; Wood, Joron & Treuil, Reference Wood, Joron and Treuil1979; Merriman, Bevins & Ball, Reference Merriman, Bevins and Ball1986).
5.b. Classification
A range of rock types is evident in the samples analysed, including basalts, basaltic andesites, dacites and rhyolites (Fig. 3a–c). In Figure 3a the basalts and dacites (with the exception of SB33) predominantly classify as tholeiitic, while the rhyolites are more calc-alkaline. However, silica contents are susceptible to mobility during sub-solidus hydrothermal alteration, and so several classification diagrams that are based on relatively immobile elements have also been used, i.e. the Zr/Ti v. Nb/Y and Th v. Co diagrams (Fig. 3b, c).

Figure 3. (a) Miyashiro (Reference Miyashiro1975) basalt classification diagram showing the compositions of the studied samples. (b) Zr/Ti–Nb/Y classification diagram adapted from Pearce (Reference Pearce2008). (c) Th–Co discrimination diagram (Hastie et al. Reference Hastie, Kerr, Pearce and Mitchell2007). Compositional fields: IAT – island arc tholeiite; CA – calc-alkaline; H-K – high-K calc-alkaline; SHO – shoshonite (* latites and trachytes also plot in the D/R fields).
In Figure 3b the samples all plot in the subalkaline field as a continuum from basalt to rhyolite, and on this diagram two of the samples (SB59 and SB58) classify as basaltic andesite. On the Th–Co diagram (Fig. 3c) the majority of the samples plot in the calc-alkaline field, with four of the basalts falling in the island arc tholeiite field. While the majority of basalts plot close to the dividing line between basalt and basaltic andesite, only sample SB55 plots in the basaltic andesite field. The rhyolites plot in the dacite/rhyolite field while the dacites fall on the andesite side of the boundary between andesite and dacite. The most evolved basalts appear to be samples SB59 and SB55, although the classification diagrams are generally inconclusive in this regard. Overall, the basalts and dacites of the group show a tholeiitic to tholeiitic/calc-alkaline transitional trend while the rhyolites have a more calc-alkaline type chemistry.
5.c. Basalt geochemistry
The basalts show an overall trend of increasing SiO2 with decreasing MgO and increasing TiO2, K2O, CaO and Fe2O3 with MgO. Al2O3 wt% generally behaves erratically showing no correlation with MgO wt%. Two trends are observed in the TiO2, CaO and Fe2O3 v. MgO plots (Fig. 4), one at lower MgO wt% with a steep increase in the other major elements and the other which shows less variation in the other oxides with increasing MgO wt%. Sample REB166 is the most primitive basalt in the suite, with a MgO of 10.8 wt%, SiO2 of 46.4 wt% and Fe2O3 of 1.0 wt%.

Figure 4. Bivariate plots of major element data against MgO (wt%) for the Fishguard volcanic rocks.
In Figure 5 selected trace elements are plotted against Zr. When immobile elements are plotted against Zr (itself immobile and incompatible in the basalts), a good correlation within the basalts indicates that the sequence of rocks are possibly co-genetic (Cann, Reference Cann1970; Hastie et al. Reference Hastie, Kerr, Mitchell and Millar2008). Many of the more immobile elements show a broad positive linear correlation with Zr (e.g. La), whereas Sc decreases as the lavas become more evolved (Fig. 5). These features suggest that the basalts may be derived from parent magmas that have been derived through similar melting conditions from a similar source.

Figure 5. Bivariate plots of trace elements variation with Zr (ppm) for the Fishguard volcanic rocks.
The La/Yb ratios of the basalts range from 1.9 to 3.3. The basaltic samples generally have flat to slightly LREE-enriched chondrite-normalized REE patterns with a slight depletion in the HREEs (Fig. 6a). The basalts are somewhat enriched compared to N-MORB, particularly for the more incompatible elements on the left-hand side of the N-MORB-normalized plot and generally have variable negative Nb anomalies, except sample REB166 (Fig. 6b). As the basalts become more evolved so they become more enriched in incompatible trace elements and develop a progressively more marked negative Eu anomaly (Figs 5e, 6b).

Figure 6. (a) Chondrite-normalized REE and (b) MORB-normalized trace element diagrams (normalizing values from Sun & McDonough, Reference Sun, McDonough, Saunders and Norry1989). Sample REB166 is highlighted.
5.d. Dacite and rhyolite geochemistry
The evolved samples contain more Si and K along with less Ti, Ca and Fe than the basaltic rocks. The major element composition variations range from e.g. 64.7–76.1 wt% SiO2 and from 1.3–6.3 wt% K2O in a linear array (Fig. 4). The trace element variations v. Zr (Fig. 5) for the more evolved samples are more scattered than for the basalts, although a broad linear trend is observed for La and Nb (Fig. 5a, d). The Zr content increases from the basalts to the dacites before falling again in the rhyolites, which may indicate Zr saturation followed by fractionation. The lack of coherent trace element trends both between the basalts and the evolved rocks, and within the evolved rocks themselves is most likely a reflection of Zr's incompatibility in the basalts and dacites and compatibility in the rhyolites. This is especially evident from the Th–Zr variation diagram, which shows a co-genetic trend for the basalts, while the data for the rhyolites and dacites are more scattered (Fig. 5b).
The La/Yb ratio of the dacites varies from 3.8–7.3, while the rhyolites vary from 4.6–6.1. The rhyolites and dacites are significantly more enriched in the LREEs ((La/Sm)CN >3) (chondrite normalized; Sun & McDonough, Reference Sun, McDonough, Saunders and Norry1989) than the basalts ((La/Sm)CN <3) but have similar, relatively flat, HREE patterns (Fig. 6a, b). All of the dacites and rhyolites possess negative Nb anomalies (Fig. 6b). The more evolved rocks also show more marked negative Eu anomalies than the basalts indicating separation of plagioclase during low-pressure crystal fractionation from a more basic magma (Figs 5e, 6a).
6. Discussion
6.a. Mantle source composition
Modern-day back-arc basins are underlain by both oceanic and continental crust formed by either seafloor spreading, rifting of older arc or continental crust (Sinton et al. Reference Sinton, Ford, Chappell and Mc Culloch2003; Martinez et al. Reference Martinez, Taylor, Baker, Resing and Walker2006). However, the relative proportions of these types of crust are often a matter of considerable debate (Stern, Reference Stern2002). The formation of oceanic crust in back-arc basins is thought to be mainly controlled by two different melt generation processes: hydrous flux melting (e.g. Tatsumi & Eggins, Reference Tatsumi and Eggins1995) and decompression melting during seafloor spreading (e.g. Langmuir, Klein & Plank, Reference Langmuir, Klein, Plank, Phipps Morgan, Blackman and Sinton1992). With increasing distance of the back-arc spreading centre from the subduction zone, decompression melting tends to dominate over subduction flux melting (e.g. Gribble et al. Reference Gribble, Stern, Newman, Blommer and O’Hearn1998; Sinton et al. Reference Sinton, Ford, Chappell and Mc Culloch2003).
Factors contributing to the geochemical heterogeneity of back-arc basin basalts include variations in the underlying mantle in terms of its fertility, composition and degree of partial melting, lithospheric thickness and amount of water present in the system (Pearce & Stern, Reference Pearce, Stern, Christie, Fisher, Lee and Givens2006). Variations in the subduction input, such as the nature and composition of the subducted materials, will also influence the geochemistry of lava erupted in the back-arc region. The melting, assimilation and crystallization history of the lavas will also contribute to the compositional diversity observed in back-arc basins. The influence of subduction zone fluids should be greatest during the early stages of basin opening and then diminish as the basin widens, although this is dependent on the geometry of the basin (Sinton et al. Reference Sinton, Ford, Chappell and Mc Culloch2003; Martinez et al. Reference Martinez, Taylor, Baker, Resing and Walker2006).
The magmas represented by the basalts of the Fishguard Volcanic Group were most likely derived from a shallow, relatively garnet-free, source (spinel lherzolite) as indicated by the flat HREE patterns. This is most likely reflective of the E–W extension of immature continental crust that occurred from the Tremadoc to Caradoc (485–448 Ma), resulting in locally subsiding grabens controlled by crustal discontinuities (Kokelaar, Reference Kokelaar1988).
More insights from the REE data for the rocks and so their source can be gained through the use of a Dy/Dy*–Dy/Yb plot (Fig. 7a). Dy/Dy* (Dy/Dy* = DyN/(La4/13 N *Yb9/13 N) is a measure of the concavity of a REE pattern (Davidson, Turner & Plank, Reference Davidson, Turner and Plank2013) and, in addition to helping determine source components, this diagram can help elucidate if amphibole has been significantly involved in the petrogenesis of a magma (either by fractionation or by being residual in the source). Figure 7a shows that the Fishguard lavas and intrusions plot mostly in the MORB field of the diagram and display a general trend of increasing Dy/Dy* with Dy/Yb. Only samples SB59 and SB54 trend towards the amphibole vector, indicating minimal involvement.

Figure 7. (a) A Dy/Dy*–Dy/Y plot of Fishguard lavas adapted from Davidson, Turner & Plank (Reference Davidson, Turner and Plank2013). DM – depleted mantle; PM – primitive mantle (Sun & McDonough, Reference Sun, McDonough, Saunders and Norry1989); MORB – mid-ocean ridge basalt; GLOSS – average global subducting sediment (Plank & Langmuir, Reference Plank and Langmuir1998). (b) Th/La–(Ce/Ce*)Nd diagram (Hastie et al. Reference Hastie, Mitchell, Treloar, Kerr, Neill and Barfod2013) showing the potential sedimentary slab components that may have contaminated the source region. SSC-HD – slow sediment clay – hydrogenous; SSC-FH – slow sediment clay – fish debris/hydrothermal. (c) The Th/Yb–Nb/Yb diagram from Pearce (Reference Pearce2008). An enrichment in Th relative to the equally incompatible Nb acts as an effective proxy of subduction input. Representative fields for other Welsh lower Ordovician volcanic complexes are also plotted on (b) and (c) for comparison. The data for Ramsey Island and St Davids Head were obtained from Bevins et al. (Reference Bevins, Lees and Roach1991) and the Snowdon data from Thorpe et al. (Reference Thorpe, Leat, Mann, Howells, Reedman and Campbell1993). N-MORB – normal mid-ocean ridge basalt; E-MORB – enriched mid-ocean ridge basalt; OIB – ocean island basalt.
The Th/La–(Ce/Ce*)Nd diagram (Fig. 7b) is used to determine the affinity of sedimentary slab components that have contaminated the source region of subduction zone rocks. The majority of the basalts plot in an array between N-MORB and the volcanic detritus field, with some of the more evolved basalts plotting within the continental detritus field, indicating a variable subduction component within the basalts. This suggests relative proximity to the continental subduction zone.
All except one of the samples analysed in this study (REB166) are displaced above the MORB–OIB array towards the continental arc region of the Th/Yb–Nb/Yb plot (Fig. 7c) further implying proximity to a subduction zone. The subducting slab does not retain Th and, therefore, an increase in its concentration in the mantle wedge, and so in back-arc basin magmas, is indicative of input from a subduction zone (Pearce, Reference Pearce2008). An increase in the Th/Yb ratio, therefore, implies an increasing subduction input, while an increase in the Nb/Yb ratio is more indicative of increasing depth of melting. It is clear that the Fishguard rocks show a variable subduction influence in the basalts with little change in melting depth, in agreement with Figure 7b. Figure 7b, c suggests that sample REB166 contains a minimal amount of subduction component. The sample, highlighted in Figure 6, also shows no Nb depletion or significant Th enrichment seen in the other samples. Typically back-arc basin basalts can contain variable amounts of subduction components (Pearce et al. Reference Pearce, Stern, Bloomer and Fryer2005; Pearce & Stern, Reference Pearce, Stern, Christie, Fisher, Lee and Givens2006). In the case of the Fishguard Volcanic Group the majority of the basalts contain a substantial subduction component. These components are derived during subduction by the release of fluids and/or sediments from the slab or may have been via inherited subduction components in the lithosphere, highlighting the complexity of the source.
6.b. Crustal processes
Bevins (Reference Bevins1982) suggested that the various dacites, rhyodacites and rhyolites exposed in the Porth Maen Melyn and Fishguard area were derived by crystal fractionation from the basic magmas. The relative roles of fractional crystallization from basalt and generation by crustal melting for the silicic rocks of the Ordovician marginal basins of Wales have been debated by many authors (Kokelaar et al. Reference Kokelaar, Howells, Bevins, Roach, Dunkley, Kokelaar and Howells1984 b; Leat et al. Reference Leat, Jackson, Thorpe and Stillman1986; Thorpe et al. Reference Thorpe, Leat, Mann, Howells, Reedman and Campbell1993)
In order to test these different models both fractional crystallization and assimilation with fractional crystallization (AFC) modelling were carried out. Rayleigh fractional crystallization modelling was undertaken using sample LG3 as a possible parental magma as it has relatively high MgO (9.1 wt%) and also has low LREE contents. Those models were calculated using PELE, a PC platform version of the silicate liquid crystallization MELTS software program (Boudreau, Reference Boudreau1999). The major element geochemical trends were modelled at different pressures and water content parameters, using a quartz–fayalite–magnetite (QFM) oxygen buffer to define oxygen fugacity (fO2). The modelling at 1 kbar predicts initial crystallization of olivine and spinel, until ~12% crystallization at which point plagioclase begins to crystallize followed by clinopyroxene at ~39% crystallization. This sequence is generally consistent with that observed in the thin-sections. Most of the samples show ophitic clinopyroxene plagioclase relationships with some of the clinopyroxene also containing rounded pseudomorphs of what was previously olivine. The chemistry of this mineral assemblage predicted by PELE was then modelled at 10% fractionation intervals using the relevant distribution coefficients (Rollinson, Reference Rollinson1993).
The results presented in Figure 8 are of the models that best predict the major geochemical trends observed in the data, i.e. low-pressure fractional crystallization (1 kbar) in a magma that was either anhydrous or contained 1% H2O. The basalt trend is more accurately modelled than the dacite/rhyolite data. The models can generally predict the SiO2 and K2O trends of the basalts and some of the more evolved rocks but cannot replicate the highest values. The models predict the low CaO trend of the basalts but have higher CaO than the dacites and rhyolites. The high CaO trend is most likely a result of alteration (Bevins, Reference Bevins1982). The FeO trend, however, is poorly replicated by the models. A low-pressure magma chamber model is in accordance with previous studies (Bevins, Lees & Roach, Reference Bevins, Lees and Roach1991) but neither fractional crystallization model conclusively fits the observed data.

Figure 8. Bivariate diagrams of selected major elements v. MgO for the Fishguard volcanic rocks along with modelled fractional crystallization trends (1 kbar anhydrous and 1 kbar with 1% H2O added) for a parental magma with a composition of sample LG3. Markers on the modelled trends are at intervals of 10% crystallization.
AFC modelling (DePaolo, Reference DePaolo1981) was carried out for trace elements at 1 kbar (Fig. 9). A significant limitation to the model is that Zr is incompatible in all instances, whereas in reality it is compatible in the more evolved rocks, meaning that their compositions are not reproduced in the models. Another limitation to the AFC models is that the exact nature of any potential contaminant is not known. An average composition for felsic continental crust has been used (from Rudnick & Gao, Reference Rudnick and Gao2003), which represents a potential fusible crustal contaminant.

Figure 9. Bivariate diagrams for representative trace elements and incompatible trace element ratios showing the results for AFC and fractional crystallization, where 0.3 AFC is equal to 30% additional contamination and represents the model that best replicates the geochemical trend of the Fishguard Volcanic Group.
Marked enrichments in incompatible elements (particularly Yb, Tb, Y) observed in rhyolites and dacites (Fig. 9a, c, d) can be replicated by AFC modelling, especially with higher crustal assimilation. The models cannot, however, replicate the elevated Th, Yb, Tb and Y concentrations of the basalts nor does any one single curve match the trend shown by the rest of the samples (Fig. 9b). These models do, however, suggest a shift from initial fractional crystallization in the most primitive basalts to assimilation fractional crystallization in the more evolved basalts.
6.c. Tectonic reconstruction
The evidence discussed in the previous section suggests that the rocks in this study (a) have been subjected to the influence of subduction zone components; (b) have undergone some crustal contamination; and (c) the basalts have a source that is compositionally similar to MORB, as evidenced by Figure 7a.
The mantle source composition for the primitive magmas of the Fishguard Volcanic Group has been determined to be a mixture of MORB-like source mantle and subducted sediment. Flat HREE patterns indicate melting took place in the spinel stability field at shallow depths (<60 km) and so, along with the above, indicate contamination of a spinel lherzolite source with subduction components. Contamination of the source by continental volcanic detritus (Fig. 7b) signifies an arc-proximal setting close to a continental margin (e.g. Sinton et al. Reference Sinton, Ford, Chappell and Mc Culloch2003; Martinez et al. Reference Martinez, Taylor, Baker, Resing and Walker2006). In addition to this, the presence of spatially and temporally close acidic and intermediate rocks and the lack of formation of true oceanic crust (Kokelaar et al. Reference Kokelaar, Howells, Bevins, Roach, Dunkley, Kokelaar and Howells1984 b) indicate proximity to a volcanic arc. The immature continental crust on which the Fishguard basin formed (Kokelaar et al. Reference Kokelaar, Howells, Bevins, Roach, Dunkley, Kokelaar and Howells1984 b) may have been part of a rifted arc system, which originated from earlier arc volcanism in Tremadoc time represented by the Trefgarn Volcanic Group (Kokelaar et al. Reference Kokelaar, Howells, Bevins, Roach, Kokelaar and Howells1984 a).
The suite of investigated rocks shows a compositional range through basalts, basaltic andesites, dacites and rhyolites. The rocks in this suite of lavas and intrusions are most likely compositionally similar magmas, with any scatter likely owing to variable subduction inputs, fractional crystallization and AFC. Fractional crystallization at 1 kbar can explain many of the trends observed in the data. Low-pressure fractional crystallization also generally agrees with the estimated source depth and with previous studies such as Bevins, Lees & Roach (Reference Bevins, Lees and Roach1991). There may have also been a hydrous component in the form of fluids or hydrous minerals (Fig. 8) present during fractional crystallization, which is consistent with a subduction zone setting (Stern, Reference Stern2002). AFC modelling indicates that crustal contamination also played a significant role in the formation of the more evolved rocks. Furthermore, crustal contamination reinforces the interpretation that the basin was formed on rifted volcanic arc crust (Kokelaar et al. Reference Kokelaar, Howells, Bevins, Roach, Dunkley, Kokelaar and Howells1984 b; Martinez et al. Reference Martinez, Taylor, Baker, Resing and Walker2006).
The Fishguard Volcanic Group is, therefore, likely to have formed in a back-arc basin setting in which a compositionally continuous and genetically linked suite of lavas were erupted. It is suggested that the Fishguard Volcanic Group formed in a back-arc basin where extensive rifting but no true spreading (and oceanic crust generation) had yet occurred.
6.c.1. Regional implications
Other Ordovician lavas erupted in the Welsh marginal basin show geochemical similarities to the Fishguard Volcanic Group. The Ramsey Island rhyolites (Middle Arenig) (Kokelaar et al. Reference Kokelaar, Howells, Bevins, Roach, Dunkley, Kokelaar and Howells1984 b) in particular are markedly compositionally similar to the Fishguard Volcanic Group (e.g. Fig. 7b, c), which may be a reflection of their spatial and temporal proximity (Bevins, Lees & Roach, Reference Bevins, Lees and Roach1991). The rocks of the Snowdon Volcanic Group, North Wales (Fig. 1) (Arenig – early Caradog) (Kokelaar et al. Reference Kokelaar, Howells, Bevins, Roach, Dunkley, Kokelaar and Howells1984 b) are enriched in incompatible elements (Fig. 7c) with moderate to marked Fe enrichments and are transitional between tholeiitic and calc-alkaline in composition (Kokelaar et al. Reference Kokelaar, Howells, Bevins, Roach, Dunkley, Kokelaar and Howells1984 b). Figure 7c shows that the rocks from the Snowdon Volcanic Group also contain generally higher Th/Yb ratios highlighting the more pronounced influence of subduction owing to their closer proximity to the volcanic arc (e.g. Sinton et al. Reference Sinton, Ford, Chappell and Mc Culloch2003). This may be a reflection of the control of crustal discontinuities (steep fractures at shallow levels of considerable length that have undergone repeated tectonic activity) on the volcanic location and development (Kokelaar, Reference Kokelaar1988). The Fishguard Volcanic Group by comparison shows marked Fe enrichment (Kokelaar et al. Reference Kokelaar, Howells, Bevins, Roach, Dunkley, Kokelaar and Howells1984 b) and a tholeiitic to tholeiitic–calc-alkaline transitional trend.
Figure 10 illustrates the proposed tectonic model for the origin and evolution of the Fishguard Volcanic Group. The proposed model is that the Fishguard Volcanic Group formed in a back-arc basin in which rifting and extension of immature continental crust (which may represent rifted arc crust) had occurred. The locus of extension most likely occurred between the active and rifted arc, where the system is rheologically weakest (Sdrolias & Müller, Reference Sdrolias and Müller2006). The magmas originated partially from flux melting in the mantle wedge, with this melting facilitated by fluids expelled from subducting slab sediments. Decompression melting at relatively shallow depths, associated with the rifting of the basin also took place. The magmas underwent fractional crystallization, during which crustal contamination from the immature continental crust of the rifted arc took place.
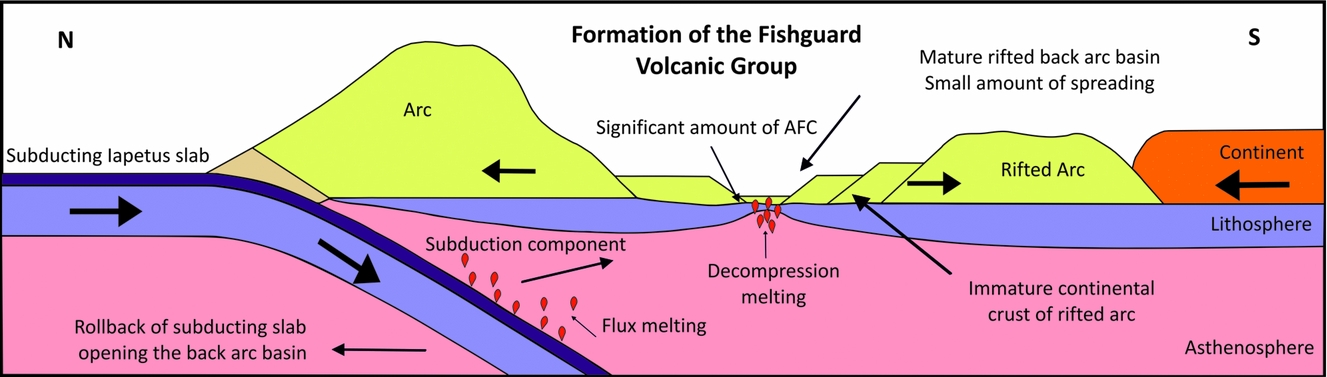
Figure 10. Proposed model for the formation of the Fishguard Volcanic Group. The diagram shows the tectonic configuration of the Iapetus slab subducting below the Avalonia continent, with rollback of the subducting slab facilitating the rifting of the arc and opening of the back-arc basin. This rifting leads to decompression melting in the structurally weaker parts of the basin; these magmas mix with melts associated with fluids from the subducting sediments. A small amount of crustal contamination occurs as the melts rise through the rifted arc crust.
There are several other known Ordovician Avalonian terranes that have comparable magmatism and originated in similar tectonic settings to the Welsh marginal basin rocks. Similar terranes from the southern flank of the Iapetus include the Antigonish Highlands Avalonian terrane in Nova Scotia, Canada, and the Avoca volcanic rocks, Ireland; both formed owing to rifting within an overall arc environment (McConnell, Stillman & Hertogen, Reference McConnell, Stillman and Hertogen1991; Murphy, Hamilton & LeBlanc, Reference Murphy, Hamilton and LeBlanc2011). These comparable origins, therefore, reinforce the suggested model of formation for the Fishguard Volcanic Group.
7. Conclusions
(1) The Fishguard Volcanic Group formed in a back-arc basin in close proximity to a subduction zone.
(2) Geochemical evidence and modelling indicates a shallow (garnet-free) lherzolite source for the Fishguard Volcanic Group. Subduction inputs and low-pressure (1 kbar) fractional crystallization are the more influential processes in the petrogenesis of the basalts, while crustal contamination was a significant process in the formation of the more evolved rocks of the Fishguard Volcanic Group.
(3) The immature continental crust nature of the basin may be derived from a rifted arc crust (Kokelaar et al. Reference Kokelaar, Howells, Bevins, Roach, Dunkley, Kokelaar and Howells1984 b), which, coupled with the suggested shallow source region, indicates that previous extension had occurred in the basin. This is consistent with the evidence for earlier volcanic arc activity in this region during Tremadoc time (485–478 Ma) (Kokelaar et al. Reference Kokelaar, Howells, Bevins, Roach, Dunkley, Kokelaar and Howells1984 b).
(4) It is, therefore, suggested that the Fishguard Volcanic Group was generated in a back-arc basin setting where extensive rifting (but no seafloor spreading) has occurred (Fig. 10).
Acknowledgements
This study forms part of the first author's MESci Thesis completed at Cardiff University. Iain McDonald is thanked for the major and trace element analyses of the samples. We also thank Jake Ciborowski for beneficial geochemical discussions. This manuscript benefited greatly from reviews by Brendan Murphy and Mike Fowler and editorial comments by Phil Leat.
Supplementary material
To view supplementary material for this article, please visit http://dx.doi.org/10.1017/S0016756815000461.


