At global and local levels, we are observing an increasing range and rate of disease outbreaks that show evidence of infections jumping from animals to humans. Consequently, understanding the education, research, and practice of animal health and its connection to human health is pivotal to safeguarding human health. Zoonoses are diseases transmissible between vertebrate animals and humans, 1 which comprise 75% of emerging infectious diseases.Reference Taylor and Latham 2 Therefore, successful management of zoonotic disease risk and outbreaks requires an understanding of the complex interaction network of humans, animals, and their living environments. 3 Previous bibliometric studies on relevant topics either investigated specific infectious diseases, such as acquired immune deficiency syndrome (AIDS),Reference Patra and Chand 4 , Reference Uthman 5 tuberculosis,Reference Ramos, Padilla and Masia 6 and malaria,Reference Garg, Kumar and Madhavi 7 or examined infectious diseases in general.Reference Bliziotis, Paraschakis and Vergidis 8 - Reference Takahashi-Omoe and Omoe 11 The latter studies examined the research productivity and contribution of different countries and regions of the world in infectious diseases and showed a gradual increase in research on infectious diseases in the United States, the European Union, and other regions in the world. Our investigation focuses on the contribution and collaboration of different fields of study in exploring the intersection between animal and human health by examining research networks.
We investigated the dynamics of the zoonotic research network over 33 years by constructing and using a large scientometric database. The study first explains the process of developing a scientometric database for exploring research collaboration on this topic. The database is based on extracted publication information in the span of 1980 to 2012 from Elsevier’s Scopus database, which is a bibliographic database containing abstracts and citations for academic journal articles. It covers nearly 22,000 titles from more than 5000 publishers, of which 20,000 are peer-reviewed journals in the scientific, technical, medical, and social sciences (including arts and humanities). The publication trend over this period of time as well as top journals in terms of number of publications are then discussed. The study proceeds with exploring the developed data set by extracting a bibliometric network (ie, affiliation network). Several social network measures, such as network density and centrality, are used to analyze this network. Moreover, the network is also mapped over different time intervals.
Materials and Methods
Elsevier’s Scopus (www.scopus.com), as one of the main sources of bibliometric data covering the greatest number of journals,Reference Abbasi and Hossain 12 - Reference Romo-Fernấndez, Guerrero-Bote and Moya-Anegốn 14 was used to build the database for this study. The search for publications was carried out with 240 search queries using combinations of key words, including coordination, collaboration, cooperation, communication, preparedness, surveillance, emergency response, crisis management, containment, recovery, zoonotic, zoonosis, animal human, disease outbreak, illness outbreak, epidemic, pandemic and social network, occurring in the articles’ titles, abstracts, and key words. This initial set of key words was selected after consulting with 2 experts in the field. The focus of the key words was on 3 concepts—coordination, zoonotic diseases, and disease outbreaks at the various stages of disease prevention, detection, effective response, and elimination. The publication’s information (eg, author[s], document title, year, author key words, source title, citation count, source and document type, affiliations, publisher, language) were extracted using the Scopus export option. The publications used in the subsequent analysis were restricted to those written in English as specified in their language field. In the second stage, in order to account for any important key word that was not included in the first stage, another set of key words were identified. As part of this process, the original author key words (ie the key words authors assigned to their documents) in the extracted publications from the first stage were analyzed for their frequency. In addition, the author key words, which could be a single word (eg, epidemiology) or could be multiple words (eg, West Nile virus), were split apart to produce a list of single words. The list of single-word key words was produced to provide a better understating of various key words describing the extracted publications. The frequency analysis of the key words included identifying the most frequent author and single-word key words. Table 1 shows the top 10 frequent author and single-word key words.
Table 1 Top 10 Most Frequent Key Words

From these key words with top frequency, the terms avian influenza, West Nile virus, H5N1, control, and risk were selected for the second search; key words that were too generic or that had been used in the previous stage (eg, virus) were not included. These selected key words were used in combination with the words coordination, collaboration, cooperation, communication, preparedness, surveillance, emergency response, crisis management, containment, recovery, outbreak, epidemic, pandemic, and social network for the second round of publication search (216 search queries). The combination was to ensure that the second set of key words was in line with the rationale behind the first set of key words and tapped into various stages of a zoonosis outbreak. The extracted publication data from this round were added to the previous results. The search span in both stages consisted of the period from 1980 to 2012. The search for the publications was conducted in July 2013. The two search rounds resulted in 5800 publications after filtering the publications with the same title.
The affiliation network was built based on the field of study (academic discipline) that is reported in the affiliation records of the publications. We used a 3-step strategy to identify the fields of study associated with each publication. In the first step, a list of fields of study was used to search each affiliation record in the database. In this study, the joint academic coding system (JACS) version 3.0 served as the initial list of fields of study. JACS 3.0 (owned and maintained by the Universities and Colleges Admissions Service [UCAS] and the Higher Education Statistics Agency [HESA]) is used for subject coding of provision across higher education in the United Kingdom. 15 With 1570 specific fields of study, JACS 3.0 provides a comprehensive list of fields of study to search for at least one matching field within each affiliation record in the database of this study.
After this step, many affiliation records did not have a matching phrase with the 1570 fields because even a simple variation would cause the search function to dismiss that variation as a correct match with a string in the JACS 3.0, and many variations of a field exist in the affiliation records of the database. Therefore, in the second step, each of the records with no matching phrase in the JACS 3.0 was examined individually, and a relevant phrase indicating their field of study was extracted. This resulted in an additional 488 phrases pertaining to a field of study. In some cases where the affiliation record did not contain useful information to extract a field of study, the records were not included in the affiliation network analysis.
In the last step, in order to have a consistent list of fields of study with a manageable size for network analysis, all the fields (whether from the JACS 3.0 or the handpicked list of fields) were mapped into the Scopus classification of major subject areas. Scopus classifies the fields of study of its journals into four broad subject clusters: health sciences, life sciences, physical sciences, social sciences. These four clusters are further divided into 26 major subject areas. This classification is presented in Table 2. Our mapping process focused on the Scopus 26 major subject areas (fields of study) in 2013 (See Figure 1).

Figure 1 Subject Area Mapping.
Table 2 Scopus Subject Areas

In performing our analysis, we used the following measures: (1) network density, that is, the number of links in a network expressed as a proportion of the maximum possible number of links;Reference Scott 16 (2) network centralization, in which the centrality of a node counted the number of other nodes that are directly connected to it,Reference Freeman 17 the closeness centrality was calculated by summing the graph-theoretic distances of that node to all other nodes in the network,Reference Freeman 17 , Reference Borgatti 18 and the betweenness centrality of a node was defined as the frequency with which it settles in the shortest path connecting any other pair of nodes in the network;Reference Freeman 17 (3) the giant component was the large and complex network seen to have a connected component that included a substantial portion of the nodes in those networks;Reference Easley and Kleinberg 19 and (4) the clustering coefficient of a node (eg, node A) referred to the probability that 2 randomly selected adjacent nodes of A are adjacent to each other.Reference Easley and Kleinberg 19 UCINET 6 softwareReference Borgatti, Everett and Freeman 20 (Analytic Technologies, Lexington, KY) was used to calculate network measures and VOSviewer 1.5.4 softwareReference Van Eck and Waltman 21 , Reference Van Eck and Waltman 22 (Leiden University’s Centre for Science and Technology Studies, Leiden, Netherlands) was used for mapping the affiliation network and displaying its structure.
Results and Discussion
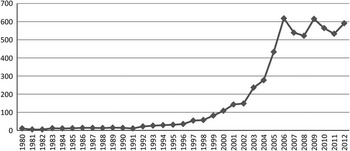
As shown in Figure 2, the trend of publications on zoonotic research has been increasing since 1980. Before 1991, the number of extracted publications was constantly low, but an increasing trend starts after that. This increase in the number of publications continued gradually and accelerated after 2002. This observation provides 3 time intervals in which to examine detailed changes in the collaboration networks: 1980–1990, 1991–2001, and 2002–2012. The dynamic analysis in this study focused on the last 2 time intervals as the number of publications in the first period was limited.

Figure 2 Frequency of Publications Per Year.
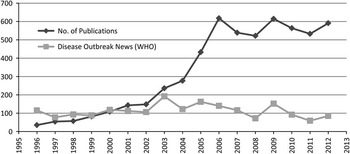
Another interesting point of time shown in Figure 2 is 2006. Up to this year the number of publications was increasing but this upward trend halted here though there were occasional rises. To have a better understanding of the possible underlying reasons for such a trend in the zoonotic research output, the frequency of zoonotic research publications and the WHO’s disease outbreak news per year 23 since 1996 are depicted in Figure 3. Three highest points of disease outbreak news occurred in 2003 (due to the severe acute respiratory syndrome [SARS] pandemic), 2005 (due to the avian influenza pandemic), and 2009 (due to the influenza A [H1N1] pandemic). After 2002, with the SARS and avian influenza pandemics, the publications on zoonotic research grew rapidly, started to decline after 2006, but again increased in 2009 with the spread of the H1N1 pandemic, and decreased again with the reduction in the disease outbreak incidents. This pattern may indicate that the scientific output on zoonotic research has reached a saturation level since 2006, and only occurrences of global disease outbreaks trigger increases in the number of related publications.

Figure 3 Frequency of Publications and the World Health Organization’s Disease Outbreak News Per Year.
Table 3 shows the top 10 journals publishing on this topic over the 33 years examined in this study. Emerging Infectious Diseases, Veterinary Record, Euro Surveillance: European Communicable Disease Bulletin, and PloS ONE hold the first 3 positions with 187, 123, 123, and 119 publication records, respectively.
Table 3 Top 10 Journals With the Largest Number of Publications

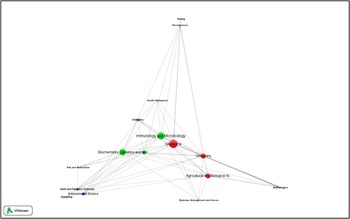
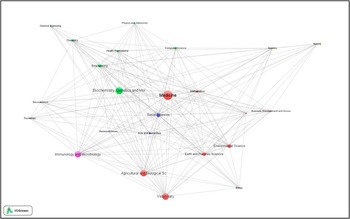
Table 4 shows the affiliation network properties in different periods. In the first period (1991–2001), the density of the network was high (47.1%) indicating that almost half of the possible links between different fields of study existed. The degree of centrality and closeness were also high (52.9% and 52.3%, respectively) while the betweenness was low (23.5%), which is an indication of a network centered on limited nodes (mainly “medicine” and then “immunology and microbiology” and “biochemistry, genetics, and molecular biology”) (see Figure 4). In the second period as well as the overall period, the density and clustering coefficient increased. However, all the centrality measures decreased. As shown in Figure 5 and Figure 6, the network in the second and overall periods did not have a center; rather, they formed a circle. The high density and placement of fields near each other is an indication of increased collaboration among different fields rather one field with a central one.
Table 4 Measures of Affiliation Network in Different Periods

a Data for entire study period.

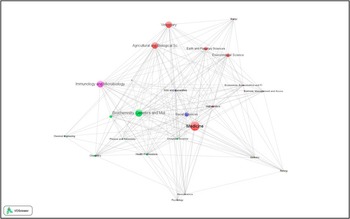
Figure 4 Affiliation Network (1991–2001). The font and circle size of the nodes depend on their collaboration weight.

Figure 5 Affiliation Network (2002–2012). The font and circle size of the nodes depend on their collaboration weight.

Figure 6 Affiliation Network (1980–2012). The font and circle size of the nodes depend on their collaboration weight.
Table 5 shows the list of top collaborating fields of study in terms of the total number of collaboration links with other fields. “Medicine” was the most collaborative field (6546 links) followed by “biochemistry, genetics, and molecular biology,” “immunology and microbiology,” “veterinary,” and “agricultural and biological sciences.” They also collaborated with 22–23 other fields out of the 26 fields. The strength of collaboration links among fields of study was determined based on the frequency of collaborations over the 33 years, which is presented in Table 6.
Table 5 Top Collaborating Fields of Study

Table 6 Strongest Collaborations Among the Fields of Study

The “medicine” field claimed half of the top 10 strongest collaborations and encompassed “biochemistry, genetics, and molecular biology,” “immunology and microbiology,” “veterinary,” and “agricultural and biological sciences.” The fields of “biochemistry, genetics, and molecular biology” filled 3 other positions in the top 10 strongest collaborations list (excluding its link with “medicine”). Overall, the strong collaborations were observed among “medicine,” “biochemistry, genetics, and molecular biology,” “immunology and microbiology,” “veterinary,” “agricultural and biological sciences,” and “social sciences.”
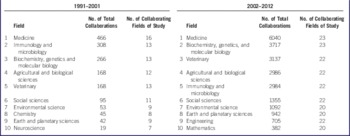
Table 7 compares the top collaborating fields over 2 time periods, 1991–2001 and 2002–2012. “Medicine” is at the top of the most collaborating fields of study during both periods. “Biochemistry, genetics, and molecular biology” and “veterinary” places in the list improved to second and third positions, respectively, in 2002–2012. The rank of “immunology and microbiology” moved from second place in the first period to fifth place in the second period. “Engineering” and “mathematics” appeared in the list in the second period, but “chemistry” and “neurosciences” dropped off the list of the top 10 most collaborating fields during 2002–2012.
Table 7 Top Collaborating Fields of Study During 1991–2001 and 2002–2012

Conclusion
This study provides longitudinal analysis of affiliation networks of zoonotic research during 1980–2012 based on a large scientific data set developed from Scopus. The overall properties of these networks as well as their dynamics over these 33 years were examined in detail. The affiliation network improved in terms of collaboration among the fields of studies over the 33 years. In the last 11 years, the top 5 collaborative fields (ie, “medicine,” “biochemistry, genetics, and molecular biology,” “veterinary,” “agricultural and biological sciences,” “immunology and microbiology”) formed collaborations with 84.6% percent of other disciplines. Overall, the affiliation network grew in terms of collaborative research among different fields of study such that more than two-thirds of all possible collaboration links between disciplines have already been formed. Our results show that zoonotic research scientists in different fields (human or animal health, social science, earth and environmental science, engineering) have been actively collaborating with each other in the past 11 years.