


1 Introduction
Game theory provides useful tools for describing and predicting human behavior. Games are expected to reflect essential properties of strategic interactions, such as: interpersonal or inter-group social interactions, organizational relations or political conflicts. For example, the well-known Prisoner's Dilemma game (Fig. 1; Flood, Reference Flood1958; Rapoport & Chammah, Reference Rapoport and Chammah1965) has been associated with arms races, warfare and nuclear deterrence (Axelrod, Reference Axelrod1984), as well as the pollution of the environment (Hardin, Reference Hardin1968; Ostrom, Reference Ostrom1998) and the difficulty of moderating climate change (Fischer et al., Reference Fischer, Levin, Rubenstein, Avrashi, Givon and Oz2022b). Similarly, the Chicken game (Rapoport & Chammah, Reference Rapoport and Chammah1966) has been used to model the Cuban missile crisis (Brams, Reference Brams2001), water resources management (Madani, Reference Madani2010) and vaccination hesitancy (Fischer et al., Reference Fischer, Levin, Rubenstein, Avrashi, Givon and Oz2022b). Typically, researchers study the situation and assign the payoffs that seem to best express the consequences associated with various choices of the parties. These in turn allow analyzing the moves each party may enact and point to strategic properties and possible end-states or ‘natural outcomes’ of the examined interactions (Rapoport & Guyer, Reference Rapoport and Guyer1966). While this approach offers valuable game theoretic analyses, discrepancies between normative decisions and descriptive behaviors are bound to occur (Rapoport & Wallsten, Reference Rapoport and Wallsten1972). These discrepancies are partly due to formal models not addressing subjective experiences, expectations, and attitudes of the involved parties (Snyder & Swann, Reference Snyder and Swann1978; Zebrowitz, Reference Zebrowitz1990). Even a thorough bottom-up approach that aggregates all seemingly relevant components and side payments is likely to miss or misrepresent some of the more subjective perspectives of the interaction.
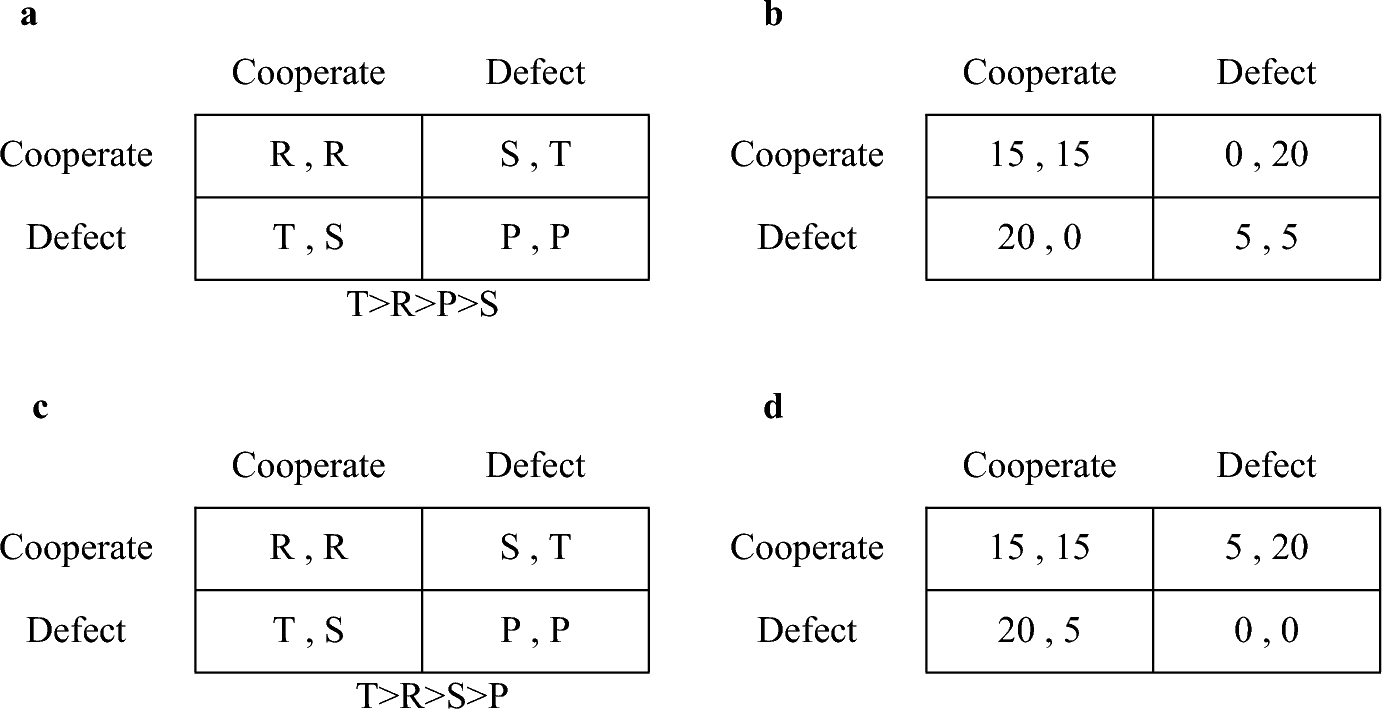
Fig. 1 Examples of two-by-two game matrices, showing two alternatives for the row and column players and their corresponding payoff values derived from simultaneous choice combinations. Left and right values in each cell indicate the payoffs for the row and column player, respectively. a Depicts a generic Prisoner's Dilemma game, defined by the inequalities: T > R > P > S (and in some experiments also 2R > S + T) (Flood, Reference Flood1958; Rapoport & Chammah, Reference Rapoport and Chammah1965). b Depicts a numeric example of the Prisoner's Dilemma game c Depicts a generic Chicken game, defined by the inequalities: T > R > S > P (Rapoport & Chammah, Reference Rapoport and Chammah1966). d Depicts a numeric example of the Chicken game
Another approach is for researchers to refrain from defining the payoffs themselves. Instead, they only define a set of alternatives, and ask participants to rate or rank their own perceived preferences for each outcome. For example, Plous (Reference Plous1985) solicited utility ratings for four suggested outcomes, associated with the arms race between the US and the Soviet Union during the cold war; Ames et al. (Reference Ames, Weber and Zou2012) presented American participants with four alternatives describing a US-China conflict and asked them to indicate their own preferences as well as those believed to be associated with the average Chinese citizen; and Halevy et al. (Reference Halevy, Chou and Murnighan2012) asked participants to rank the outcomes of two-by-two matrices representing negotiation scenarios. Clearly, this approach helps focus the participants on a restricted set of possibilities, but at the same time it is limited to the alternatives already considered by the researchers. Moreover, this approach forces the participants to engage in the challenging task of transforming their subjective experiences, expectations and attitudes into a single numeric value. Alas, the involved individuals, who are the most relevant source of information, cannot be expected to have the knowhow and skills required for correctly transforming their perceptions into payoff values.
Examining the abovementioned approaches reveals a critical problem. On one hand, the best information resides within participating individuals, which are not expected to have the skills to express their knowledge in a formal way. On the other hand, game-theory experts master analytic methods and strategic reasoning, yet they have no direct access to the underlying experiential aspects and the behavioral motivations of the involved parties. To bridge this gap, the present study develops and tests novel methods and procedures that help transform laypersons’ perspectives into formal yet subjectively defined games, hereafter termed subjective game structures (SGSs). These SGSs are game-theoretic matrices, which represent subjective perceptions as reflected in payoffs elicited from designated individuals. Clearly, all game-theoretic analyses may also be applied to SGSs. Moreover, the SGSs elicitation process applied in the present study allows the participants to define the labels of the alternatives; addresses individuals’ subjective experiences, expectations, and attitudes; and replaces numeric assessments with symbolic representations.
While SGSs are, by definition, not expected to reflect objective perceptions, they still have to exhibit consistent strategic properties that are replicable across repeated elicitation processes. The existence of this consistency is an essential quality when attempting to elicit mental representations of social interactions (Halevy & Phillips, Reference Halevy and Phillips2015). Therefore, the present study aims to: (i) develop intuitive and simple payoff elicitation tools and procedures that do not require numeracy from the involved parties, (ii) define a comprehensive strategic reliability index, and (iii) empirically test the capacity of the developed tools and procedures to generate reliable SGSs; allowing to analyze game theoretic properties of various conflict scenarios. To examine SGSs we analyze the obtained games by applying Rapoport and Guyer's (Reference Rapoport and Guyer1966) taxonomy of two-by-two games, and supplement the analysis by a taxonomy derived from the theory of Subjective Expected Relative Similarity (Fischer, Reference Fischer2012; Fischer et al., Reference Fischer, Levin, Rubenstein, Avrashi, Givon and Oz2022a, Reference Fischer, Rubenstein and Levin2022b) that addresses the properties of the players in association with the payoffs.
2 Study 1: Development of symbolic quantification tools
To associate subjective perceptions with formal game structures, we develop tools that transform perceptions of expected outcomes and experiences into numerical values. Ideally, a tool for eliciting and quantifying subjective perceptions and experiences across different individuals should be intuitive, universal, and independent of participants’ numeracy and education. Such a tool should allow participants to clearly express quantities without having to rely on formally acquired numerical skills. It has been shown that pictographs are useful representations of quantity for people with both higher and lower levels of numeracy (Hess et al., Reference Hess, Visschers and Siegrist2011); pictorial scales are perceived as more motivating than verbal questionnaires (Baumgartner et al., Reference Baumgartner, Frei, Kleinke, Sauer and Sonderegger2019); and ordinal relations between quantities are better understood through graphical representations than through numbers (Feldman-Stewart et al., Reference Feldman-Stewart, Kocovski, McConnell, Brundage and Mackillop2000). Therefore, we develop a set of Symbolic Quantification Tools (SQTs) that are based on illustrations and are clearly associated with different quantities, and test whether they are consistently perceived across participants.
2.1 Methods
2.1.1 Participants
Eighty-three (Mage = 23.9, SDage = 4.55, 78% female) participants were recruited to take part in the study at the University of Haifa campus, in exchange for the equivalent of 20 USD.
2.1.2 Tools
Six image-sets were tested, each consisted of several illustrations of a specific object or concept, ranging from its worst to its best condition (such as depictions of trees ranging from a bare tree to a tree with rich and beautiful foliage). Three methods were used to compose these sets. Two image-sets (49 illustrations of cities and 54 illustrations of birds) were compiled using the Google image search engine. Two image-sets (36 trees with leaves and 20 treasure troves) were artistically designed to represent ordinal changes along a bounded continuum (i.e., the number of leaves on an illustrated tree, or the number of valuable objects piled together). The two remaining image-sets (41 jars and 41 sliced trees) were designed to represent fixed intervals along a bounded continuum by systematically decreasing the amount of sand in the depicted jars or systematically slicing the tree images. See Fig. 2 for image-sets examples.

Fig. 2 Reduced image-sets applied as Symbolic Quantification Tools (SQTs). From top to bottom: trees with leaves, treasure troves, jars, and sliced trees. The complete image sets with their corresponding elicited values are available in the supplementary materials
2.1.3 Procedure
The participants were divided into three groups. Each group was seated in a room equipped with an overhead projector and took part in two consecutive sessions. The sessions comprised three image-set presentations. Each image was displayed for 15 s, followed by a white screen displayed for 10 s. During the first two presentations, participants were asked to watch the images, presented in a predetermined random order, without taking any further action. Only during the third presentation were participants asked to rate the valence of each image by marking a 10 cm long scale bounded by two labels: “worst result” and “best result”. Following a ten-minute break, participants continued to the second session, which used a different image-set.
2.2 Results
To test whether the image-sets serve as a reliable and valid tool for transforming non-numeric perceptions into numeric values, we examined the extent to which the same image was identically perceived across participants. To this end, we calculated standard deviations for the ratings of each image across participants. The mean standard deviations of the perceived values, pooled across all images, for the jars, sliced trees, trees with leaves, birds, treasure troves, and cities image-sets were 0.87, 0.94, 1.50, 1.74, 1.91, 2.16, respectively (where the ratings range from 0 to 10). These values suggest rather identical image valance perception across image-sets. Figure 3 depicts means and standard deviations for each of the images in all six image-sets.
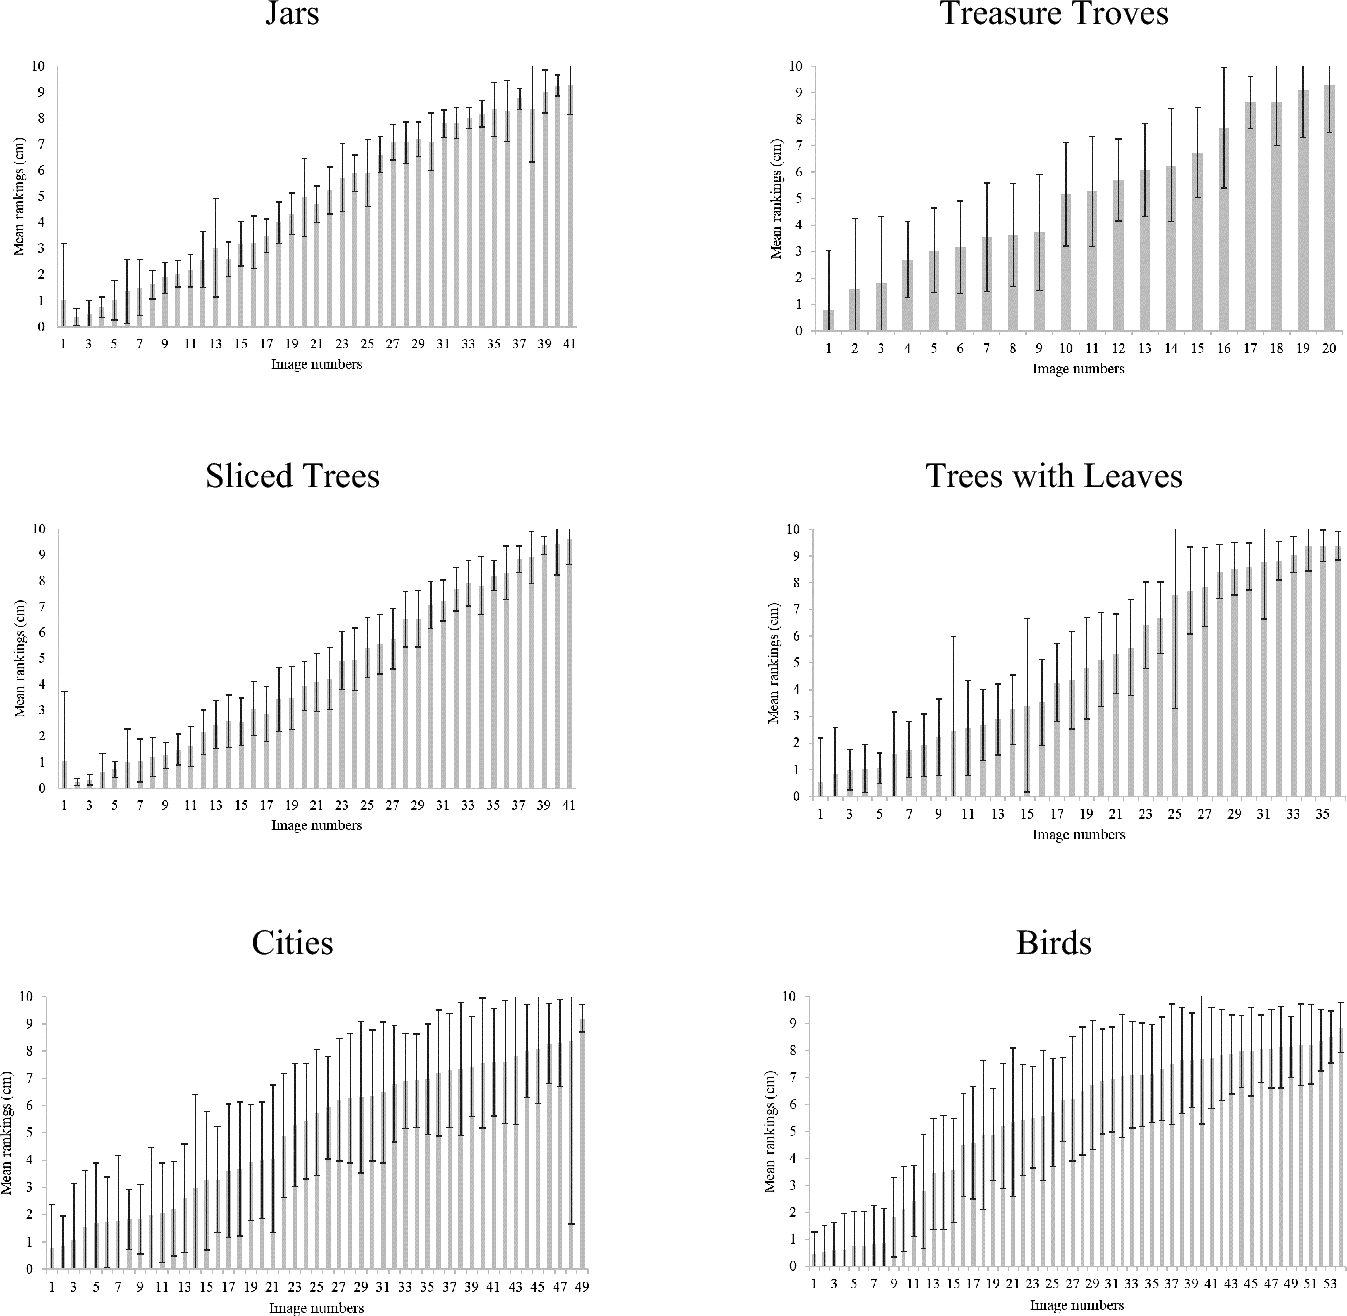
Fig. 3 Means and standard deviations for each image in the six image-sets tested in Study 1
While all the image-sets enabled participants to provide clearly differentiated values, we removed the cities image-set because it had the highest mean standard deviation. We also removed the birds image-set due to its relatively large deviation from a linear pattern. All the other sets, namely jars, trees with leaves, sliced trees, and treasure troves, were then used in Study 2, allowing to elicit individual perceptions across eight conflict scenarios.
3 Study 2: Eliciting subjective game structures and testing their reliability
After developing and selecting the four image-sets in Study 1, we applied them in Study 2 as means for eliciting SGSs in various conflict scenarios. We then tested their reliability and assessed their capacity to provide meaningful strategic insights. To attain these goals, we first develop a novel reliability measure, termed the Matrices’ Strategic Resemblance Index (MSRI), and classify each SGS according to two game taxonomies.
To prepare adequate conflict scenarios, we examined existing conflict classifications. Some address intra- and interpersonal aspects, some reflect conflicting interests of groups, tribes and organizations, and others focus on international and global disputes. Each of these conflict types may be described by various aspects such as the motivations of the interacting parties, their personal and cultural background, their emotions and aspirations. Researchers suggested different foci and classifications to capture the essence of such conflicts. For example, Haiman (Reference Haiman1951) differentiated between emotional and rational conflicts; similarly, Guetzkow and Gyr (Reference Guetzkow and Gyr1954) distinguished between substance- and emotion-based conflicts; Aubert (Reference Aubert1963) emphasized the distinction between conflicts of interest and conflicts of values or belief; Pinkley (Reference Pinkley1990) focused on the conflict resolution frame, addressing three dimensions—relationship vs. task, intellectual vs. emotional, and win vs. compromise; and Jehn (Reference Jehn, Ayoko, Ashkanasy and Jehn2014) classified conflict into three types—task, process, and relationship. Clearly, there are many possibilities to differentiate between conflicts’ underlying properties, which reflect their complex nature and the multitude of research approaches. Therefore, we take a teleological approach, and focus on conflict scenarios that mirror ecologically valid intergroup interactions, mainly geopolitical disputes. To avoid homogeneity and to reflect various aspects of geopolitical conflicts, we considered their intersections with three critical aspects, namely ideology, socio-economy, and terrorism. Eight fictitious scenarios were composed, aiming to avoid participants conforming to contemporary perspective or social norm.
3.1 Matrices’ strategic resemblance index (MSRI)
The ability of the elicitation procedure to reveal identical SGSs is an essential requirement. While two repeatedly elicited SGSs are not likely to reveal completely identical payoffs, SGSs that describe the same conflict perception of the same person are expected to reflect rather similar properties. To test the reliability of repeatedly elicited SGSs, we defined and tested the MSRI. This index assesses the extent to which two matrices resemble one another, as derived from their strategic properties. The better the fit of the strategic properties of the compared matrices, the higher the MSRI value. The MSRI compares a basic and rather representative set of strategic properties, which represent classical game theory considerations as well as considerations derived from the theory of Subjective Expected Relative Similarity (Fischer, Reference Fischer2009, Reference Fischer2012), further described below. While the selected properties do not exhaust all possible strategic considerations, they do provide a rather broad representation of critical strategic motivations that allows testing how similar or different two matrices are from each other.
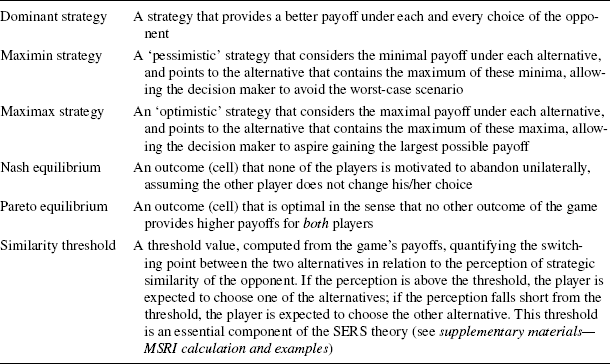
The MSRI examines properties that characterize each player separately, properties that involve the interaction of both players, and properties that involve the players themselves—specifically their similarity to each other. The compared properties include: Dominant, Maximin and Maximax strategies; Pareto and Nash equilibria (Luce & Raiffa, Reference Luce and Raiffa1957; Nash, Reference Nash1950); and similarity thresholds as derived from the SERS theory (see Table 1 for property definitions). While these properties are far from exhausting all possible strategic properties, their combination provides a diverse set of characteristics that allows comparing two games and assessing their resemblance. The MSRI value quantifies the extent to which the examined properties point to the choice of the same alternative in both matrices.
Table 1 MSRI property definitions
|
Dominant strategy |
A strategy that provides a better payoff under each and every choice of the opponent |
|
Maximin strategy |
A ‘pessimistic’ strategy that considers the minimal payoff under each alternative, and points to the alternative that contains the maximum of these minima, allowing the decision maker to avoid the worst-case scenario |
|
Maximax strategy |
An ‘optimistic’ strategy that considers the maximal payoff under each alternative, and points to the alternative that contains the maximum of these maxima, allowing the decision maker to aspire gaining the largest possible payoff |
|
Nash equilibrium |
An outcome (cell) that none of the players is motivated to abandon unilaterally, assuming the other player does not change his/her choice |
|
Pareto equilibrium |
An outcome (cell) that is optimal in the sense that no other outcome of the game provides higher payoffs for both players |
|
Similarity threshold |
A threshold value, computed from the game's payoffs, quantifying the switching point between the two alternatives in relation to the perception of strategic similarity of the opponent. If the perception is above the threshold, the player is expected to choose one of the alternatives; if the perception falls short from the threshold, the player is expected to choose the other alternative. This threshold is an essential component of the SERS theory (see supplementary materials—MSRI calculation and examples) |
Since alternatives and payoffs are provided intuitively by the participants, it is important to assure that the compared matrices are correctly aligned before calculating the MSRI score. For example, if comparing two classical Prisoner's Dilemma games (Flood, Reference Flood1958; Rapoport & Chammah, Reference Rapoport and Chammah1965), one must assure that the cooperative alternatives are placed in the same row in both matrices; likewise, one must assure that the cooperative alternatives are placed in the same column in both matrices. When the alternatives are not pre-labeled (e.g., cooperation or defection), it is necessary to ensure that the matrices are correctly aligned.Footnote 1 In the present study, a group of four additional participants served as independent judges examined the elicited SGSs and aligned them before we calculated the MSRI scores.
To calculate the MSRI scores, we define the following three general scoring principles: (i) if the compared property points to an identical choice in both matrices, the index is incremented by one unit; (ii) likewise, if the compared property does not point to any choice in either matrix, the index is incremented by one unit as well; (iii) if the compared property points to different choices for each of the two matrices, or if it points to a choice in only one of the matrices (and is indifferent regarding the choice in the other matrix), the index is incremented by a value that is proportional to the prospects that the player will make the same choice in both matrices, as detailed in the supplementary materials—MSRI calculation and examples. The overall MSRI, aggregated across all properties, may obtain any value between 0.5 and 10 units.Footnote 2
3.2 Game taxonomies
Rapoport and Guyer's (Reference Rapoport and Guyer1966) taxonomy classifies all strictly ordinal two-by-two games (games in which each player's payoffs are represented as ordinal ranks that are different from each other) into ten categories according to the games’ strategic properties. They further suggest an end-state referred to as the game's natural outcome, which constitutes a theoretical solution to the game: (i) If both players have a dominant alternative, they both choose it, and the resulting outcome constitutes the natural outcome of the game. (ii) If only one player has a dominant alternative, he/she chooses it, while the other player chooses the alternative that maximizes his/her own payoff under the expectation that the dominant alternative is chosen. (iii) If no player has a dominant alternative but there is a single Pareto equilibrium in the game, this cell is the natural outcome. Finally, (iv) if all three conditions are not met, each player will attempt to avoid his worst outcome by choosing in accord with the Maximin decision rule.
Since some SGSs are not expected to be strictly ordered (in other words, some of these games may have at least two identical payoff values for at least one of the players), we expand the taxonomy to also include non-strictly ordinal games. Our revision focuses mainly on expending the definition of the natural outcome to account for games with weak dominance (i.e., having an alternative that provides a better or equal payoff under each and every choice of the opponent), and games with no Maximin preferred choices (see supplementary materials—Rapoport and Guyer's Taxonomy of Two-by-Two Games). Additionally, to focus on the main properties of the expected outcomes, we merge some of the original ten categories and add another category, resulting in the following five game categories: (1) Absolutely Stable games, in which both players can jointly obtain their maximal payoff. Such games are regarded as no-conflict games. In other words, both parties easily and naturally converge on a mutually beneficial solution. (2) Stable/Strongly Stable games, in which one or both players are not satisfied with the natural outcome, yet they are not able to influence the outcome of the game by changing, or threatening to change, their choice. In other words, even though there is no mutually beneficial solution, none of the players is motivated to depart from their initial choices. (3) Non-Stable games, in which one or both players are not satisfied with the natural outcome, yet the player/s are able to influence the game's expected outcome by changing or threatening to change their choice. Interactions modeled by these games may be regarded as intractable conflicts, since every action taken by one of the players can be answered with a counteraction of the other player ad infinitum. (4) Prisoners’ Dilemma (PD)-like games.Footnote 3 In these games neither of the players is satisfied with the natural outcome, yet they are not motivated to change their choice. However, unlike Stable/Strongly Stable games, the natural outcome of PD-like games is a Nash equilibrium but not a Pareto equilibrium (since there exists another cell in which both players obtain higher payoffs). In other words, two rational players that consider only the payoffs (and do not incorporate the properties of the opponent, specifically the strategic similarity of the players) are both expected to obtain a smaller payoff than jointly available for both of them in another cell of the matrix. (5) No Natural Outcome games—in this added category, one or both players have no preferred choice (this can only occur in some games that are non-strictly ordinal). Therefore, there is no predicted choice for one or both of the players and consequently no expected outcome. See Fig. 4 for example matrices, and supplementary materials—Rapoport and Guyer's Taxonomy of Two-by-Two Games for a detailed description of the revised taxonomy.
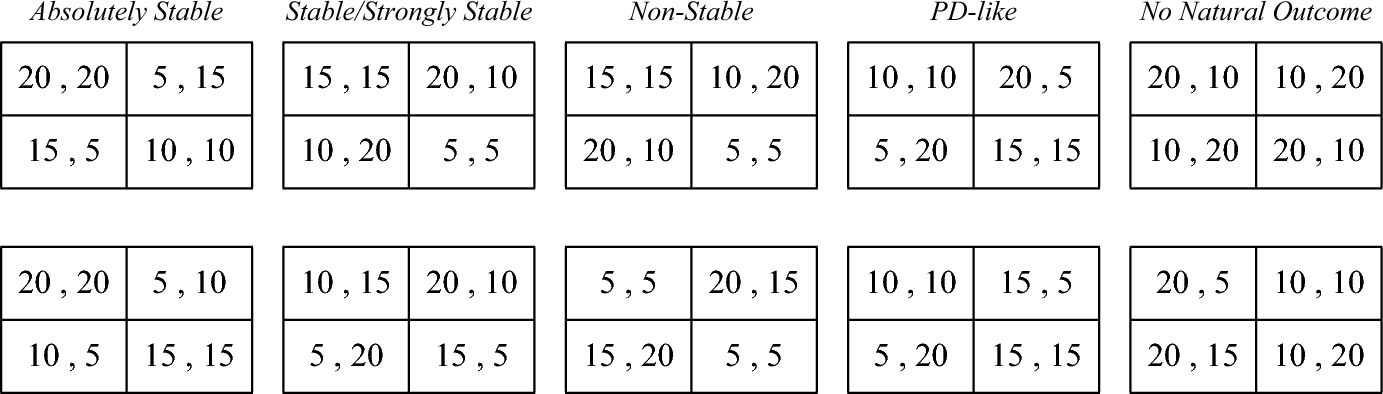
Fig. 4 Example matrices for the five categories of the revised and reduced Rapoport and Guyer taxonomy. In all matrices, except the No Natural Outcome games, the natural outcome is the top left cell. The top Absolutely Stable game is typically referred to as the Stag Hunt game (Skyrms, Reference Skyrms2001). The top Non-Stable game is a Chicken game (Rapoport & Chammah, Reference Rapoport and Chammah1966). The bottom Non-Stable game is typically referred to as Battle of the Sexes (Rapoport, Reference Rapoport1967). The top PD-like game is a classic PD (Flood, Reference Flood1958; Rapoport & Chammah, Reference Rapoport and Chammah1965). The top No Natural Outcome game is a Matching Pennies game (Budescu & Rapoport, Reference Budescu and Rapoport1994)
We also supplement Rapoport and Guyer's (Reference Rapoport and Guyer1966) taxonomy with a taxonomy that is based on the SERS theory (Fischer, Reference Fischer2009, Reference Fischer2012; Fischer & Savranevski, Reference Fischer and Savranevski2023; Fischer et al., Reference Fischer, Levin, Rubenstein, Avrashi, Givon and Oz2022a, Reference Fischer, Rubenstein and Levin2022b), which shifts the focus from the payoff structure per se to the interaction between the game's payoff structure and the players’ perceptions of their opponent; specifically, the prospects of both players to choose identical alternatives. SERS computes an expected value that integrates (i) the perception of strategic similarity, which indicates the probability the opponent will choose an alternative identical to the alternative selected by oneself, and (ii) the payoffs expected under each choice. For example, consider two players choosing their alternatives while interacting in a PD game (Fig. 1). A player who assumes his opponent is sufficiently strategically similar to himself may expect that if he chooses to cooperate the opponent is likely to cooperate as well. But, if the player chooses to defect, he may assume that the opponent is likely to defect as well. In contrast, a player who assumes his opponent is strategically dissimilar to himself may expect that if he chooses to cooperate the opponent is likely to defect. But, if the player chooses to defect, he may assume that the opponent is likely to cooperate. Therefore, a player who perceives the opponent as sufficiently similar is likely to cooperate, while a player who perceives the opponent as dissimilar is likely to defect. Notice that since the perception of strategic similarity is continuous (and not dichotomous—totally similar or totally dissimilar), SERS computes the optimal switching point between alternatives. As shown by previous research, SERS provides both a normative and a descriptive account of human behavior. Games in which the SERS-based expected choices vary under different perceptions of strategic similarity with the opponent are referred to as similarity-sensitive games. Games in which the SERS-based expected choices do not vary under different perceptions of strategic similarity with the opponent are referred to as non-similarity-sensitive games. Clearly, some games can be similarity-sensitive for one of the players and non-similarity-sensitive for the other. Therefore, the similarity-based taxonomy differentiates between two-player similarity-sensitive games, one-player similarity-sensitive games, and two-player non-similarity-sensitive games. The importance of this classification for analysis of the SGSs lies in its capacity to determine which games are susceptible to social and behavioral interventions. That is, influencing perceptions of strategic similarity between the interacting parties has the potential to alter the expected outcome of similarity-sensitive games without changing the game's actual payoffs. See supplementary materials—Similarity-Based Taxonomy of Games for a detailed description of SERS and the respective classification of games.
3.3 Methods
3.3.1 Participants
One hundred forty-one participants (Mage = 25.1, SDage = 3.8, 77% female) took part in the study at the University of Haifa campus, in exchange for the equivalent of 20 USD or for two academic credit points required for the completion of their bachelor's degree. One hundred twenty-one participants completed both sessions of the study (20 participants failed to show up for the second session).
3.3.2 Tools
3.3.2.1 Interaction scenarios
Eight short vignettes, each involving two opposing parties, describing various bilateral interactions. To generate these scenarios while avoiding addressing any actual ongoing conflicts, five research group members individually composed short vignettes describing fictitious geopolitical conflicts that also involve ideological, socio-economic, and terrorism-related aspects. The proposed scenarios were then jointly discussed and revised by all members until a consensus was reached. Five of the eight selected scenarios represent intersections of geopolitical and the other three aspects; two scenarios represent intersections only between the other aspects; and one scenario addresses a purely geopolitical conflict (Fig. 5). The following descriptions are abridged versions of the eight scenarios used in the study (See supplementary materials – Conflict Descriptions for the complete conflict descriptions).
The Caradian—Tiberian Conflict (geopolitical): Two ethnic groups involved in an armed territorial conflict, in which one party (the Caradian people) is militarily superior to the other party (the Tiberian people). The scenario suggests two options, one cooperative and the other confrontational.
The Mireen—Bagotan Conflict (geopolitical ∩ socio-economic): Two countries possess two different natural resources. Yet to benefit from its resource, each country must collaborate with the other country. The scenario suggests two alternatives: signing or rejecting a trade agreement.
The Choppo—Kaipeng Conflict (geopolitical ∩ socio-economic): Two countries struggle with different domestic problems; whose solution is dependent upon the resources of the neighboring country. The scenario suggests a collaborative or a confrontational alternative.
The Taizei—Comoro Conflict (geopolitical ∩ terrorism): A stateless ethnic group struggles for independence, while a powerful country perceives the aspirations of this group as a threat. The scenario suggests attacking or practicing restraint.
The Burgia—Sani Conflict (geopolitical ∩ terrorism): A sovereign country and an indigenous ethnic group claim ownership over the same territory. The sovereign country is more powerful, whereas the ethnic group is weaker and less organized. The scenario suggests a peaceful or an aggressive alternative.
The Maasai—Samburu Conflict (geopolitical ∩ ideological): Two tribes fight over the same territory. The scenario suggests two alternatives for each tribe: to stop, or to carry on fighting.
The Kibbutz Conflict (ideological ∩ socio-economic): A socialist community (kibbutz) is torn apart by two ideologies, each representing a different view on capital ownership. A referendum will determine the community's ideological and economic future.
The Cartel Conflict (socio-economic ∩ terrorism): A country is populated by both high and low socioeconomic-status groups. The low-status group supports the activity of a drug cartel, while the high-status group supports the government. Both sides must consider whether to increase or decrease hostile activities toward the other party.
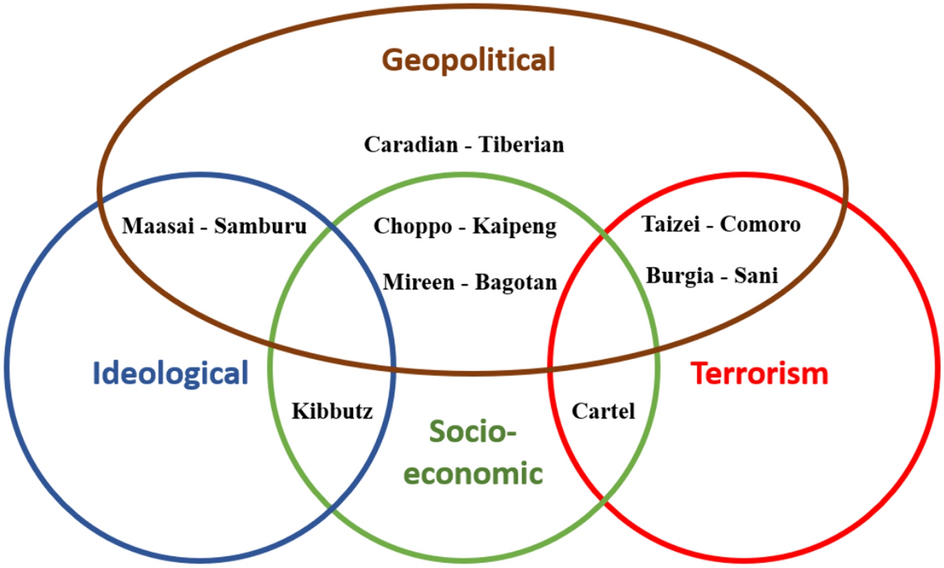
Fig. 5 The eight conflict scenarios applied in study 2 depicted according to four conflict aspects
3.3.2.2 Symbolic quantification tools (SQT)
After testing and selecting four SQTs in Study 1 (jars, trees with leaves, sliced trees, and treasure troves), we apply these SQTs in Study 2. Participants assigned to the Caradian-Tiberian, Mireen-Bagotan, Burgia-Sani and Kibbutz conflict scenarios responded by using the jars and the trees with leaves SQTs. Participants assigned to the Maasai-Samburu, Choppo-Kaipeng, Taizei-Comoro and the Cartel conflict scenarios responded by using the sliced trees and treasure troves SQTs.
3.3.3 Procedure
Participants were randomly assigned to one of four conditions. Each condition consisted of two specific conflict descriptions and two designated SQTs. All participants went through the following stages: (i) reading a conflict description while being assigned a specific side in the conflict; (ii) describing two possible and different courses of action that could be implemented by the participant's assigned group and by the opponents, yielding four distinct outcomes; (iii) describing a set of five possible consequences that each of the parties will experience under each of the four outcomes; (iv) using two SQTs to rate the consequences associated with each outcome by selecting the illustration that most accurately represents their attitudes towards the consequences provided in the previous stage. This process was implemented first in reference to the participant's assigned party and second in reference to the other party. Participants then repeated all four stages for the second conflict description.
The second session of the study took place about a week after the first. Participants followed the same procedure, with the same conflict descriptions and SQTs presented in reverse order. Finally, participants completed a basic demographic questionnaire and were compensated for their participation in both sessions.
Preparing the data for analysis entailed transforming the conflict alternatives (Stage ii) and the perceptions of the payoffs (Stage iv) into two-by-two game matrices (i.e., SGSs), in which the actions provided for the two sides formed the alternatives for the row and column players. Using the average ratings obtained in Study 1 enabled us to transform the selected SQT images into numeric values that represent expected payoffs. These payoff values were placed in their corresponding cells, generating two-by-two SGSs with action alternatives and expected payoffs (see Fig. 6).
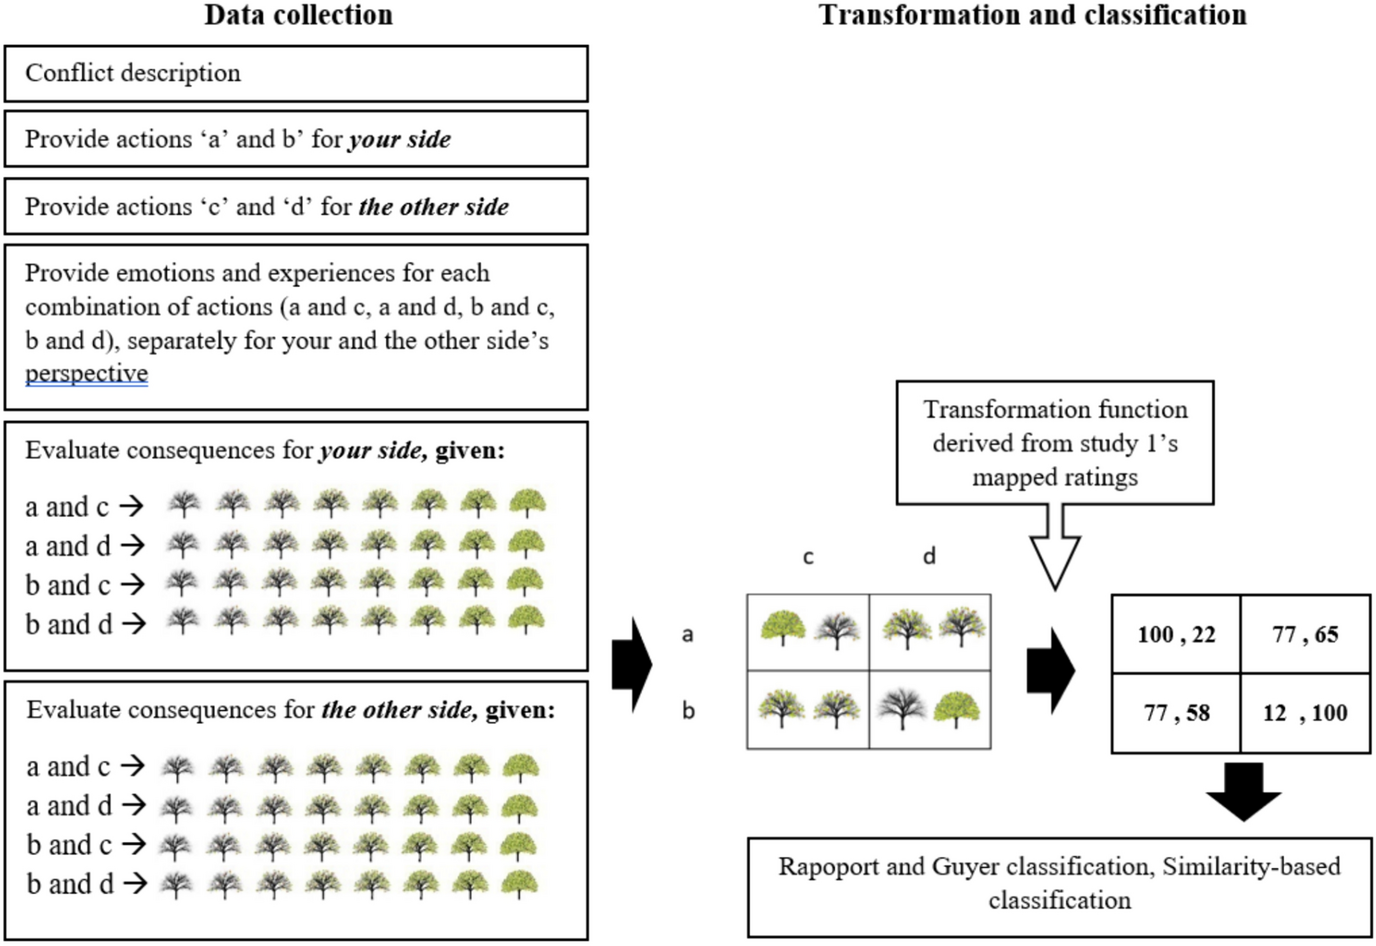
Fig. 6 Illustration of basic SGS elicitation, transformation, and classification processes
3.4 Results
Since the order of action alternatives was provided within each session by the participants, the within-session alternatives are aligned to each other by default. However, the alternatives provided in the two separate sessions are not necessarily reported in the same order. Therefore, these between-session alternatives must be aligned before computing the reliability index—the MSRI. To this end, we recruited four additional participants to serve as independent judges who separately determined whether the alternatives were described in the same order or whether they needed to be aligned. If alignment was necessary, the order of the alternatives in the second session was switched to match their order in the first session. The judges’ alignment recommendations were implemented if at least three of the independent judges reached identical conclusions. If no agreement was reached (two judges recommended switching the order of the alternatives while the other two judges did not recommend switching), the examined matrices were excluded from the between-session MSRI analysis. Overall, the judges reached a high level of agreement, assuring alignment of 91% of between-session SGS pairs. The remaining SGSs, comprising non-alignable matrix pairs and single-session data obtained from participants who did not show up for the second session, were included only in the within-session MSRI analysis.
The following analyses examine three main aspects of the generated SGSs. First, we test the consistency of participants’ conflict perceptions by computing the MSRI values for within-session (between two different SQTs) and between-session (for the same SQT) SGSs. Second, we describe and analyze the distribution of generated SGSs according to the revised Rapaport and Guyer (1966) taxonomy of two-by-two games. Finally, we describe and analyze the distribution of generated game structures according to the similarity-based taxonomy, as derived from the SERS theory (Fischer, Reference Fischer2012; Fischer et al., Reference Fischer, Levin, Rubenstein, Avrashi, Givon and Oz2022a, Reference Fischer, Rubenstein and Levin2022b).
3.4.1 Consistency of participants’ conflict perceptions
For each of the eight conflicts we calculated the MSRI scores for the within-session SGSs (comparing the results obtained from two different SQTs) and the between-sessions SGSs (comparing the results obtained from the same SQT in both sessions). We then compared these values with the MSRI values derived from a set of randomly generated matrix pairs. Comparing two sets of randomly generated two-by-two matrices, obtained under the same constraints on the range of values, is still likely to result in some resemblance of the matrix properties. Hence, the reliability of random matrix pairs serves as a benchmark, or a chance-level value, indicating the lack of genuine behavioral reliability. To evaluate the extent of the reliability observed in the elicited SGSs, we applied a Monte Carlo approach and compared the MSRI values of the SGSs with those of the randomly generated matrices. The larger the difference between MSRI values of behaviorally elicited SGSs and MSRI values of randomly generated matrix pairs, the better the consistency of participants’ conflict perceptions and the higher the reliability. To this end, we generated 30 matrix sets with random payoffs for each scenario. Each set consisted of the same number of matrix pairs as the number of the elicited matrix pairs. We then ran 30 separate t-tests for independent samples to compare participants’ MSRIs with the randomly generated matrices’ MSRIs. Pooling the t-test statistics yielded average t values,
 , (and their associated p values) and average Cohen's d values,
 .
.
Table 2 shows within- and between-session MSRIs and their comparison with the randomly generated sets for all eight conflict scenarios. Within-session MSRI analyses reveal relatively high reliability, ranging from 8.60 (out of a maximum of 10) for the Maasai-Samburu scenario to 9.28 for the Mireen-Bagotan scenario. All comparisons with the randomly generated matrix pairs MSRIs reveal significant differences (p < 0.001, average Cohen's
 = 2.23). Between-session MSRI analyses reveal a varied pattern of SGS test–retest reliability. The Caradian-Tiberian, Mireen-Bagotan, Burgia-Sani and Choppo-Kaipeng scenarios exhibit high average MSRI values, ranging from 7.30 (Choppo-Kaipeng) to 8.37 (Mireen-Bagotan) across the two SQTs, showing high consistency in the perceptions of these conflicts. The other four scenarios yielded lower between-session reliability, showing low to medium consistency, with the Kibbutz and Cartel scenarios showing the lowest MSRI means (5.34 and 5.24, respectively). These differences are supported by a two-way ANOVA (8 conflicts
 4 SQTs), revealing significant differences between the eight conflicts (F(7,416) = 16.25, p < 0.001, η2 = 0.21). As expected for equivalent measures, no significant differences between the four SQTs were found (F(2,416) = 1.28, n.s., η2 = 0.006), as well as no significant conflict
 SQT interaction (F(6,416) = 0.38, n.s., η2 = 0.005). Overall, these results suggest that the four SQTs generate equivalent SGSs for the examined scenarios, as shown by the high levels of within-session MSRI values (as compared to the randomly generated sets). Nevertheless, the resulting between-session reliability suggests a difference emanating from the properties of the conflict scenarios themselves. Some scenarios are characterized by high test–retest reliability, meaning that participants’ perceptions of these scenarios are stable over time, whereas other scenarios are characterized by lower test–retest reliability, suggesting that the described scenarios may be perceived in different ways.
Table 2 Study 2 MSRI scores

|
Scenario |
Overall number of participants, dual session participants, align-able matrix pairs |
SQT types |
Within-session MSRI |
Between-session MSRI—SQT 1 |
Between-session MSRI—SQT 2 |
Between session mean |
||||||
|---|---|---|---|---|---|---|---|---|---|---|---|---|
|
Mean (sd) |
Random mean (sd) |
t test |
Mean (sd) |
Random mean (sd) |
t test |
Mean (sd) |
Random mean (sd) |
t test |
||||
|
Caradian—Tiberian |
37, 27, 26 |
(1) Jars, (2) Trees with Leaves |
8.64 (1.73) |
5.33 (1.65) |
|
7.49 (2.08) |
5.37 (1.76) |
|
7.45 (1.79) |
5.39 (1.77) |
|
7.47 |
|
Mireen—Bagotan |
37, 27, 25 |
(1) Jars, (2) Trees with Leaves |
9.28 (1.06) |
5.33 (1.64) |
|
8.36 (1.65) |
5.40 (1.67) |
|
8.37 (1.56) |
5.39 (1.76) |
|
8.37 |
|
Burgia—Sani |
34, 32, 28 |
(1) Jars, (2) Trees with Leaves |
9.09 (1.18) |
5.27 (1.67) |
|
7.67 (2.09) |
5.43 (1.58) |
|
7.18 (2.17) |
5.50 (1.83) |
p = .01,
|
7.43 |
|
Kibbutz |
34, 32, 25 |
(1) Jars, (2) Trees with Leaves |
8.73 (1.63) |
5.33 (1.72) |
|
5.84 (2.35) |
5.40 (1.77) |
|
4.84 (2.46) |
5.27 (1.72) |
|
5.34 |
|
Maasai—Samburu |
35, 33, 28 |
(1) Sliced Trees, (2) Treasure Rooms |
8.60 (1.91) |
5.36 (1.66) |
|
6.72 (2.04) |
5.49 (1.74) |
|
6.74 (1.91) |
5.37 (1.76) |
p = .018,
|
6.73 |
|
Choppo—Kaipeng |
35, 33, 29 |
(1) Sliced Trees, (2) Treasure Rooms |
8.82 (1.32) |
5.31 (1.60) |
|
7.22 (2.23) |
5.30 (1.75) |
|
7.37 (1.78) |
5.37 (1.715) |
p = .002,
|
7.30 |
|
Taizei—Comoro |
33, 32, 27 |
(1) Sliced Trees, (2) Treasure Rooms |
8.67 (1.45) |
5.33 (1.69) |
|
5.67 (2.38) |
5.46 (1.70) |
|
6.08 (1.83) |
5.30 (1.69) |
|
5.88 |
|
Cartel |
33, 32, 28 |
(1) Sliced Trees, (2) Treasure Rooms |
8.72 (1.47) |
5.28 (1.68) |
|
5.07 (2.02) |
5.30 (1.78) |
|
5.40 (1.87) |
5.36 (1.78) |
|
5.24 |


Within- and between-session Matrix Strategic Resemblance Indices (MSRIs) across eight scenarios, and four Symbolic Quantification Tools (SQTs). Mean MSRI values express behavioral consistency, while random means serve as a reference point for chance-level MSRI values. The t tests compare the elicited MSRI means with the random means
3.4.2 SGS distributions
After establishing relatively high MSRI levels for most of the conflicts, we examine the embedded properties of the elicited SGSs in accordance with two game taxonomies. This stage reveals the previously hidden characteristics of the SGSs, providing meaningful insights that inform decision makers what can and what cannot be attained in each conflict scenario. It also indicates when intervention may be fruitful and help attain cooperative solutions. We first consider the revised Rapoport and Guyer taxonomy of two-by-two games, followed by the similarity-based classification. Together these two perspectives point to both strategic and behavioral properties of the elicited SGSs.
Figure 7 depicts the distribution of game types in accordance with the revised Rapoport and Guyer taxonomy for each of the eight conflicts. All conflicts are characterized by a high proportion of absolutely stable games (ranging from 42% of SGSs for the Taizei-Comoro scenario to 84% of SGSs for the Mireen-Bagotan scenario), followed by a lower proportion of non-stable games (ranging from 12% of SGSs for the Mireen-Bagotan scenario to 36% of SGSs for the Taizei-Comoro scenario). The depicted distributions show that four of the scenarios (Caradian-Tiberian, Mireen-Bagotan, Burgia-Sani and Choppo-Kaipeng) are characterized by a rather similar distribution of game types. These scenarios exhibit a high proportion, about 75%, of absolutely stable games. The other four scenarios are characterized by a more uniform distribution, albeit absolutely stable games remain the most frequent game type. Two of these (Cartel and Taizei-Comoro) show a rather low proportion, about 40%, of absolutely stable games, and the two others (Kibbutz and Maasai-Samburu) reveal a higher proportion of about 55% absolutely stable games. Note that scenarios with high proportions of absolutely stable games are also those that are characterized by high between-session MSRI means.

Fig. 7 Distribution of game types in accordance with the revised Rapoport and Guyer taxonomy, for each of the eight scenarios in Study 2
Figure 8 depicts the distribution of game types in accordance with the similarity-based taxonomy for each of the eight scenarios. For six scenarios, the category of one-player similarity-sensitive games is the most frequent, ranging from 38% for the Kibbutz conflict to 57% for the Taizei-Comoro scenario. For the other two scenarios, Choppo-Kaipeng and Maasai-Samburu, the most frequent category is the two-player similarity-sensitive game, representing 44% and 46%, respectively. Overall, 54% of the players experience the described scenarios as a similarity-sensitive game (summing the percentage of two-player similarity-sensitive games and half of the percentage of one-player similarity-sensitive games). The percentage of these players ranges from 45% for the Kibbutz scenario to 67% for the Maasai-Samburu scenario. This is an important outcome from the perspective of conflict management, since it points to the possibility of applying similarity inducing interventions, which are expected to promote cooperative solutions.
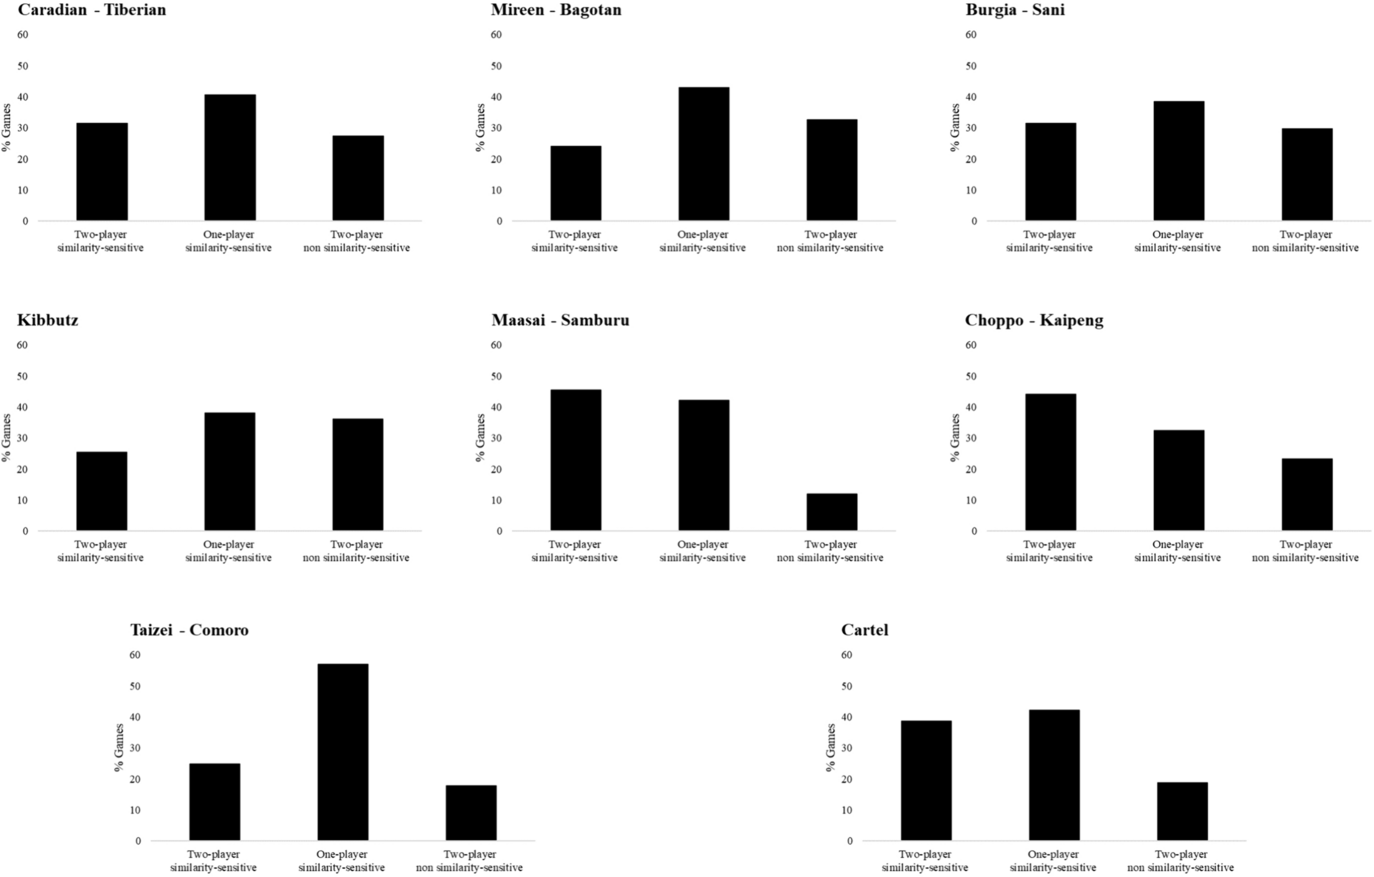
Fig. 8 Distribution of game types in accordance with the similarity-based taxonomy, for each of the eight scenarios in Study 2
4 Discussion
The present study aimed to transform conflict perceptions into formally defined games, termed Subjective Game Structures (SGS), which allow analyzing strategic properties and identifying opportunities for behavioral interventions. To this end we: (i) transformed subjective perceptions of vague scenarios into a set of payoffs and corresponding two-by-two matrices; (ii) developed and applied a novel reliability index, termed the Matrices' Strategic Resemblance Index (MSRI), to test whether repeatedly elicited SGSs exhibit similar strategic properties; and (iii) classified the SGSs by using two taxonomies: Rapoport and Guyer's (Reference Rapoport and Guyer1966) taxonomy of two-by-two games, and a similarity-based taxonomy derived from the theory of Subjective Expected Relative Similarity (SERS; Fischer, Reference Fischer2009).
Study 1 tested several Symbolic Quantification Tools (SQTs), four of them were then applied in Study 2 to transform subjective conflict perceptions into SGSs across eight scenarios. MSRI values of the repeatedly elicited SGSs revealed high within-session reliability for all scenarios, showing that participants exhibit rather steady perceptions. Comparing between-session MSRIs further revealed high reliability levels for five of the conflict scenarios, and low to medium reliability levels for three other scenarios. These differences raise a post-hoc question—what distinguishes scenarios with high reliability from those with low reliability? To suggest possible answers, we examined the distribution of game types for the eight scenarios. The revised classification of Rapaport and Guyer's (1966) taxonomy revealed two patterns: one where the perceptions of most participants reflect the same game type, and the other where participants’ perceptions differ and are represented by various game types. Scenarios that were characterized by high between-session MSRI values were also characterized by one main game type that was perceived by most participants. More specifically, scenarios that gave rise to a high proportion of absolutely stable games were also associated with high MSRI values; whereas scenarios that were characterized by a more uniform distribution of game types were associated with rather low between-session MSRI values. Thus, the scenarios that were identically perceived across participants were also consistently perceived over time by individual participants. Other scenarios were more susceptible to diverse interpretations and were also characterized by less consistent individual perceptions. This seems to suggest that interactions characterized by flatter cross-participants game distributions (i.e., different participants perceive the interaction as reflecting different game types) are also those that are more difficult for the individual to reconstruct, hence resulting in lower consistency and in lower between-session MSRI values.
Although the eight scenarios tested in this study reflect various conflict types (geopolitical, ideological, socio-economic, and terrorism), they are clearly not a representative set of all possible interaction types. Nevertheless, these scenarios gave rise to a total of 61% absolutely stable games (being the most frequent game type for each of the eight conflict scenarios), 10% stable / strongly stable games, 23% non-stable games, less than 4% no natural outcome games, and less than 3% PD-like games. This suggests that participants tended to perceive conflictual interactions as having mutually beneficial solutions, as revealed by the high proportion of absolutely stable games, also referred to as no conflict games.
Since PD games have been widely accepted as a model of mixed-motives conflicts (Axelrod, Reference Axelrod1984; Axelrod & Hamilton, Reference Axelrod and Hamilton1981), it is worth noting that their obtained proportion in the present study is less than 3% of the elicited SGSs. This outcome differs from the results reported by Halevy et al. (Reference Halevy, Chou and Murnighan2012), who found that 22–32% of games in negotiation scenarios are perceived by participants as PD games. This gap may stem from the different procedures applied in both studies. While in Halevy's study participants filled in ordinal payoffs into an empty two-by-two matrix with predefined alternatives, the procedure applied in the present study allowed participants to define their own alternatives for both parties and to use a large range of non-numerical payoff estimates. Moreover, the participants in the present study were prompted to consider and report experiences and consequences associated with each proposed outcome before using the SQTs to indicate their perceived payoffs. This procedure allowed the participants to express their estimates while using a rather continuous and fully flexible paradigm, thus eliciting conflict perceptions that were better discriminated. Our findings correspond to the proposition that PD games are uncommon among actual field cases (Northcott & Alexandrova, Reference Northcott, Alexandrova and Peterson2015), and have thus rarely been found in natural settings (Johnson et al., Reference Johnson, Stopka and Bell2002). Clearly more research is needed in order to determine the actual role of PD games in driving real world interactions.
The similarity-based classification revealed that about 75% of all elicited SGSs are similarity-sensitive for either one or both parties. For this type of games, the payoff maximizing solution, according to SERS, depends not only on the payoff structure, but also on the strategic similarity perceptions of the opponents (Fischer, Reference Fischer2012; Fischer et al., Reference Fischer, Levin, Rubenstein, Avrashi, Givon and Oz2022a, Reference Fischer, Rubenstein and Levin2022b). In many similarity-sensitive games—such as PD, Chicken, and Battle of the Sexes games—raising similarity perceptions beyond the game's similarity threshold (Table 1) is directly related to increased cooperation rates (Fischer & Savranevski, Reference Fischer and Savranevski2023). Hence, similarity sensitive games provide the opportunity to reconcile conflicted parties, not only by addressing the payoffs, but also by raising strategic similarity perceptions of the parties. As shown in previous studies, similar traits, attitudes, and cognitions serve as indicators of strategic similarity and motivate the parties to make cooperative choices (Chierchia & Coricelli, Reference Chierchia and Coricelli2015; Fischer, Reference Fischer2009, Reference Fischer2012).
Notwithstanding the necessity of additional research addressing real life conflicts—the presently developed elicitation tools, the Matrices’ Strategic Resemblance Index (MSRI) and the two applied game taxonomies—provide a meaningful addition to the behavioral game theory toolbox and extend the reach of game theoretic analyses. This, in turn, enables to identify both overlapping interests and intrinsic disagreements, and provides powerful conflict management tools (Thompson & Hastie, Reference Thompson and Hastie1990).
Future research and applications of SGS elicitation can encompass a wide range of social interactions, spanning from interpersonal relations to trade, political conflicts, and warfare. SGS elicitation may serve as a potent tool for delving into customers behavior and analyzing political and international disputes. By sampling designated populations, researchers can examine individual differences as well as identify divisions and subgroups within the population. It offers an invaluable resource for conducting polls, studying implicit attitudes, and aiding in the planning of political, commercial, and social policies. Furthermore, SGSs allow performing game-theoretical analysis, and when complemented by sampling of similarity perceptions, may also be analyzed by the application of SERS, holding the promise of generating empirically validated behavioral forecasts (Fischer, Reference Fischer2009, Reference Fischer2012; Fischer & Savranevski, Reference Fischer and Savranevski2023).
Supplementary Information
The online version contains supplementary material available at https://doi.org/10.1007/s10683-024-09828-y.
Acknowledgements
We gratefully acknowledge many valuable comments provided by the anonymous reviewers and by the editors. We thank Hadas Yehushua, Yuval Tsuk-Marienberg, and Koral Gutman-Attia for their assistance in data collection, graphic design and data analysis.
Funding
Open access funding provided by University of Haifa. This study was supported by ISF grant no. 640/15, Forecasting of inter-group conflict potentials.


 Open access