


INTRODUCTION
Multiple sclerosis (MS) is a chronic inflammatory and neurodegenerative disease of the central nervous system. It is characterized by the occurrence of widespread lesions or plaques in the brain and spinal cord (Buchanan et al., Reference Buchanan, Minden, Chakravorty, Hatcher, Tyry and Vollmer2010; Compston & Coles, Reference Compston and Coles2002). Because of these lesions and their unpredictable locations, MS results in a broad range of symptoms, including motor, visual, cognitive, and neuropsychiatric difficulties. The clinical course descriptions revised in 2013 retain the core MS phenotype descriptions of relapsing versus progressive disease (Lublin & Reingold, Reference Lublin and Reingold1996; Lublin et al., Reference Lublin, Reingold, Cohen, Cutter, Sørensen, Thompson and Polman2014). Relapsing disease includes the clinically isolated syndrome and relapsing-remitting MS (RRMS) subtypes, while progressive disease includes the secondary progressive MS (SPMS) and progressive primary MS (PPMS) subtypes. RRMS, the most frequent form of MS (80–85%), is characterized by episodes of acute worsening, followed by periods of partial or complete recovery. The SPMS subtype follows the RR course, but the disease progresses more steadily, with or without superimposed relapses. PPMS (10–15%) is characterized by progressive accumulation of disability from the onset.
Neuropsychiatric symptoms, such as depression and anxiety and cognitive impairments, are well recognized and frequently observed in MS (Chiaravalloti & DeLuca, Reference Chiaravalloti and DeLuca2008; Feinstein, DeLuca, Baune, Filippi, & Lassman, Reference Feinstein, DeLuca, Baune, Filippi and Lassman2013; Rao, Leo, Bernardin, & Unverzagt, Reference Rao, Leo, Bernardin and Unverzagt1991). Cognitive deficits mainly concern sustained attention, information processing speed, memory, and executive functions (Chiaravalloti & DeLuca, Reference Chiaravalloti and DeLuca2008). However, recent studies have also highlighted social cognition deficits (Henry et al., Reference Henry, Phillips, Beatty, McDonald, Longley, Joscelyne and Rendell2009; Pottgen, Dziobek, Reh, Heesen, & Gold, Reference Pottgen, Dziobek, Reh, Heesen and Gold2013). Social cognition is defined as the set of mental operations that subtend social behavior, such as perceiving and interpreting the intentions and emotions of others, and generating appropriate behavioral responses (Brothers, Reference Brothers1990; Green et al., Reference Green, Penn, Bentall, Carpenter, Gaebel, Gur and Heinssen2008).
There is, therefore, a close relationship between social cognition and social behavior. The integrity of social cognition seems crucial for successful social interactions and adequate psychosocial functioning. Social cognition is a multidimensional construct encompassing several abilities. The most studied ones in MS are emotion processing and theory of mind (ToM). Emotion processing refers to the ability to perceive and use emotional information (from recognizing emotions to managing and regulating them), while ToM refers to the ability to make inferences about others’ intentions and beliefs (Adolphs, Reference Adolphs2002; Brune & Brune-Cohrs, Reference Brune and Brune-Cohrs2006). A small number of studies have examined emotion perception in patients with MS. The majority reported impaired recognition of facial emotions (Berneiser et al., Reference Berneiser, Wendt, Grothe, Kessler, Hamm and Dressel2014; Prochnow et al., Reference Prochnow, Donell, Schafer, Jorgens, Hartung, Franz and Seitz2011), especially anger and fear (Henry et al., Reference Henry, Bakchine, Maarouf, Chaunu, Rumbach, Magnin and Montreuil2015, Reference Henry, Tourbah, Chaunu, Rumbach, Montreuil and Bakchine2011, Reference Henry, Phillips, Beatty, McDonald, Longley, Joscelyne and Rendell2009; Krause et al., Reference Krause, Wendt, Dressel, Berneiser, Kessler, Hamm and Lotze2009; Phillips et al., Reference Phillips, Henry, Scott, Summers, Whyte and Cook2011) and, to a lesser extent, sadness (Krause et al., Reference Krause, Wendt, Dressel, Berneiser, Kessler, Hamm and Lotze2009).
Furthermore, one study found a small deficit in the recognition of bodily expressions of emotion (Cecchetto et al., Reference Cecchetto, Aiello, D’Amico, Cutuli, Cargnelutti, Eleopra and Rumiati2014) and two impairments in affective prosody (Berneiser et al., Reference Berneiser, Wendt, Grothe, Kessler, Hamm and Dressel2014), suggesting that the emotion processing deficit is not restricted to faces in MS. A ToM deficit has also been reported by several studies (Henry et al., Reference Henry, Bakchine, Maarouf, Chaunu, Rumbach, Magnin and Montreuil2015, Reference Henry, Tourbah, Chaunu, Rumbach, Montreuil and Bakchine2011, Reference Henry, Phillips, Beatty, McDonald, Longley, Joscelyne and Rendell2009; Ouellet et al., Reference Ouellet, Scherzer, Rouleau, Metras, Bertrand-Gauvin, Djerroud and Duquette2010; Pottgen et al., Reference Pottgen, Dziobek, Reh, Heesen and Gold2013; Roca et al., Reference Roca, Manes, Gleichgerrcht, Ibanez, Gonzalez de Toledo, Marenco and Sinay2014). This deficit is found in both verbal and nonverbal tasks (Banati et al., Reference Banati, Sandor, Mike, Illes, Bors, Feldmann and Illes2010).
The social cognition abilities of patients with MS may be influenced by cognitive dysfunction, in particular executive dysfunction. Executive functions refer to a set of higher level cognitive abilities needed for planning and executing goal-directed operations. Social cognition and executive functions are often associated for two reasons. First, emotion recognition and ToM tasks rely on executive functions, such as working memory, flexibility and/or inhibition (inhibiting one’s own perspective to adopt an alternative point of view; Samson, Apperly, Kathirgamanathan, & Humphreys, Reference Samson, Apperly, Kathirgamanathan and Humphreys2005), and second, the neuroanatomical systems underlying social cognition and executive functions overlap.
However, while some research in healthy and clinical populations has yielded evidence of a link between social cognition components and executive functions (Bull, Phillips, & Conway, Reference Bull, Phillips and Conway2008; Honan, McDonald, Gowland, Fisher, & Randall, Reference Honan, McDonald, Gowland, Fisher and Randall2015; Lough et al., Reference Lough, Kipps, Treise, Watson, Blair and Hodges2006; Pickup, Reference Pickup2008), several studies have failed to do so (Gregory et al., Reference Gregory, Lough, Stone, Erzinclioglu, Martin, Baron-Cohen and Hodges2002; Lough, Gregory, & Hodges, Reference Lough, Gregory and Hodges2001). It is a similar pattern for MS, with some researchers reporting that executive function is related to social cognition performance (Banati et al., Reference Banati, Sandor, Mike, Illes, Bors, Feldmann and Illes2010; Henry et al., Reference Henry, Phillips, Beatty, McDonald, Longley, Joscelyne and Rendell2009; Ouellet et al., Reference Ouellet, Scherzer, Rouleau, Metras, Bertrand-Gauvin, Djerroud and Duquette2010), but others not (Di Bitonto et al., Reference Di Bitonto, Longato, Jung, Fleury, Marcel, Collongues and Blanc2011; Henry et al., Reference Henry, Tourbah, Chaunu, Rumbach, Montreuil and Bakchine2011; Roca et al., Reference Roca, Manes, Gleichgerrcht, Ibanez, Gonzalez de Toledo, Marenco and Sinay2014). The relationship between social cognition performance and executive function, therefore, remains controversial. These apparently contradictory results may be due to the heterogeneous clinical characteristics of MS samples, and differences in the methodologies used.
None of these studies included samples of patients with progressive forms of MS. SPMS can be regarded as a more advanced stage of the disease that might be expected to entail greater impairment of social cognition abilities. By contrast, patients with PPMS have no prior history of relapsing disease and we would not, therefore, necessarily expect a comparison between them and patients with RRMS to reveal a difference. In cognitive studies, patients with chronic progressive forms of MS have been found to have more pronounced impairments than those with RRMS. When patients with PPMS and SPMS are studied separately, the latter have greater cognitive impairments than the former (Comi et al., Reference Comi, Filippi, Martinelli, Campi, Rodegher, Alberoni and Canal1995; Denney, Sworowski, & Lynch, Reference Denney, Sworowski and Lynch2005; Foong et al., Reference Foong, Rozewicz, Chong, Thompson, Miller and Ron2000; Huijbregts, Kalkers, de Sonneville, de Groot, & Polman, Reference Huijbregts, Kalkers, de Sonneville, de Groot and Polman2006). Several studies have found qualitative differences between the three MS subtypes on cognitive deficits. For instance, Denney, Lynch, Parmenter, and Horne (Reference Denney, Lynch, Parmenter and Horne2004) found that patients with SPMS performed worse than those with PPMS on a visuospatial working memory task, while patients with RRMS showed a greater slowing of information processing speed than those with PPMS.
No study evaluating social cognition abilities in patients with PPMS and SPMS is currently available. The aims of the present study were thus to (a) confirm ToM and facial emotion recognition impairments in MS; (b) look for differences between MS subtypes on the course of social cognition, in particular on emotion recognition and ToM task scores; and (c) explore the relationship between patients’ social cognition performances and their executive abilities, mood variables, and clinical disease characteristics.
METHODS
Participants
We recruited 62 patients with clinically definite MS (Polman et al., Reference Polman, Reingold, Banwell, Clanet, Cohen, Filippi and …Wolinsky2011) during their regular appointments at the Neurology Department of Reims University Medical Centre. Exclusion criteria were (a) history of alcohol or drug abuse, (b) history of major psychiatric illness, (c) history of a neurological disorder other than MS, (d) significant visual or motor impairment that would interfere with cognitive testing, (e) current relapse in the patient’s illness, and (f) pathological performance on the Benton Facial Recognition Test (BFRT, Benton, Sivan, Hamsher, Varney, & Spreen, Reference Benton, Sivan, Hamsher, Varney and Spreen1983; see measures below).
The sample consisted of 31 patients with RRMS and 31 with a chronic-progressive disease course; 16 had PPMS, and 15 SPMS. Their length of illness was measured from the time of diagnosis and their level of disability with the Expanded Disability Status Scale (EDSS; Kurtzke, Reference Kurtzke1983). For comparison purposes, a sample of 33 healthy participants was also recruited for this study. The healthy participants were mainly staff members with no history of psychiatric or neurological illness, no head trauma, and no alcohol or drug abuse. The participants’ details are given in Table 1.
Table 1 Sociodemographic, clinical, and cognitive characteristics of patients With MS and Healthy Participants
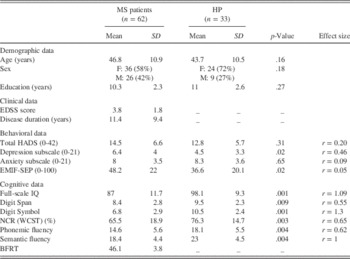
HADS=Hospital Anxiety and Depression; EMIF-SEP=Échelle Modifiée d’Impact de la Fatigue – Sclérose en Plaques; WCST=Wisconsin Card Sorting Test; BFRT=Benton Facial Recognition Test; HP=healthy participants; EDSS=Expanded Disability Status Scale; NCR=number of conceptual responses.
Measures
Neuropsychological measures
The cognitive battery included the Ward 7-subtest short form of the Wechsler Adult Intelligence Scale III (WAIS-III; Wechsler, Reference Wechsler1997), the Wisconsin Card Sorting Test (WCST; Heaton, Chelune, Talley, Kay, & Curtiss, Reference Heaton, Chelune, Talley, Kay and Curtiss1993), verbal fluency measures (Cardebat, Doyon, Puel, Goulet, & Joanette, Reference Cardebat, Doyon, Puel, Goulet and Joanette1990), and the BFRT (Benton et al., Reference Benton, Sivan, Hamsher, Varney and Spreen1983).
We used Ward’s short form of the WAIS-III as an index of overall cognitive ability. This short form comprises the Information, Digit Span, Arithmetic, Similarities, Picture Completion, Block Design and Digit Symbol subtests. It provides satisfactory estimates of verbal intelligence quotient, performance IQ, and full-scale IQ, plus information for subtest analysis (Pilgrim, Meyers, Bayless, & Whetstone, Reference Pilgrim, Meyers, Bayless and Whetstone1999). In the present study, we analyzed two of these subtests in particular, Digit Span (working memory) and Digit Symbol (information processing speed), as the processes they measure are often correlated with social cognitive performances, and are, therefore, generally found to be impaired in patients with MS.
The WCST is a measure of executive functions, notably problem solving, use of feedback and cognitive flexibility. This task requires participants to sort cards along one of three dimensions (color, shape, or number). Only one of these dimensions is correct at any one time, but its identity is not disclosed. The examiner does, however, provide feedback. After 10 consecutive correct responses, the rule is changed. The number of correct conceptual responses and the number of perseverative responses are recorded.
We also used a measure of phonemic (letter r) and semantic (fruit category) fluency. Verbal fluency is one of the most sensitive measures of an executive dysfunction in MS (Henry & Beatty, Reference Henry and Beatty2006), requiring initiation and the monitoring of executive processes.
The BFRT measures the recognition of neutral faces from various perspectives. We used the 13-item short form, converting the short-form scores to long-form ones. Scores of 41 and over are classified as normal. As suggested by Benton, Sivan, Hamsher, Varney, and Spreen (Reference Benton, Sivan, Hamsher, Varney and Spreen1994), a score below 39 is considered to reflect impaired performance, corresponding to the 3rd–6th percentile.
Social cognition measures
To assess social cognitive abilities, we administered one facial affect recognition task and six ToM tasks. The Ekman 60-faces test (Ekman & Friesen, Reference Ekman and Friesen1976) consists of 60 faces drawn from the Ekman and Friesen series, representing the six basic emotions: 10 expressions of anger, 10 of disgust, 10 of fear, 10 of happiness, 10 of sadness, and 10 of surprise. Each picture is displayed on a computer screen for 5s, followed by a forced-choice menu to indicate the detected emotion.
The ToM tasks featured six stories: two for first-order false belief, two for second-order false belief, and two for faux pas tasks. The stories and questions were based on those used by Rowe, Bullock, Polkey, and Morris (Reference Rowe, Bullock, Polkey and Morris2001) and Stone, Baron-Cohen, and Knight (Reference Stone, Baron-Cohen and Knight1998), and were adapted for a French population (for full details about the stories, questions, and scoring, see Ehrle, Henry, Pesa, & Bakchine, Reference Ehrle, Henry, Pesa and Bakchine2011; Henry et al., Reference Henry, Tourbah, Chaunu, Rumbach, Montreuil and Bakchine2011). To reduce the demand on verbal working memory and comprehension during the test, a combination of pictures and a written text was used to illustrate each ToM task. Four ToM scores were calculated: a first-order ToM mean score; a second-order ToM mean score; a faux pas mean score; and an overall ToM mean score. For each story, there was a question to assess attention and comprehension that was not included in the ToM mean scores (comprehension score).
Self-report questionnaires
Patients’ self-reported levels of fatigue were collected via two questionnaires: the EMIF-SEP (Échelle Modifiée d’Impact de la Fatigue – Sclérose en Plaques; Debouverie, Pittion-Vouyovitch, Louis, & Guillemin, Reference Debouverie, Pittion-Vouyovitch, Louis and Guillemin2007), a French validated version of the Fatigue Impact Scale (Fisk, Pontefract, Ritvo, Archibald, & Murray, Reference Fisk, Pontefract, Ritvo, Archibald and Murray1994); and the Hospital Anxiety and Depression Scale (HADS; Zigmond & Snaith, Reference Zigmond and Snaith1983).
The EMIF-SEP is a 40-item self-report questionnaire encompassing four dimensions: cognitive, physical, social role, and psychological. Each item is rated on a 4-point Likert scale, and the total fatigue scores are standardized from 0 (no fatigue) to 100 (high fatigue). This scale has high internal consistency and very satisfactory test–retest reliability (Debouverie et al., Reference Debouverie, Pittion-Vouyovitch, Louis and Guillemin2007).
The HADS is a widely used self-assessment instrument for determining the severity of depressive and anxiety symptoms. It comprises 14 items: 7 for depression and 7 for anxiety. Each item is rated on a 4-point Likert scale ranging from 0 to 3, yielding a total score of 0–21 for each subscale.
Procedure
After providing demographic information, participants completed several neuropsychological assessments and measures of facial affect recognition and ToM, followed by self-report measures of depression, anxiety, and fatigue. All participants gave their written informed consent, and the study was conducted in accordance with the Declaration of Helsinki.
Statistical Analyses
All statistical analyses were performed using SPSS 21.0 for Mac. Nonparametric statistical tests were used, as the hypothesis for normal distribution of variables was not satisfied. A p-value of 0.05 was considered statistically significant. The chi-squared test was performed to compare proportions of categorical data, and the Mann-Whitney test to compare the MS and control groups. To check that overall cognitive performance (full-scale IQ), anxiety (HADS), depression (HADS), and fatigue (EMIF-SEP) did not explain social cognition performances, we performed a principal component analysis with all these confounding variables, from which we were able to extract a factor. We then performed a hierarchical regression analysis for the emotion recognition and ToM measures. In the first block, we entered the factor extracted from the principal component analysis, and in the second block we entered group. As assumptions were not met, we performed a bias-corrected (BCa) bootstrap on the b.
A Kruskall-Wallis nonparametric analysis of variance was performed to compare the three MS subgroups and healthy participants in terms of demographics, cognitive and self-report measures, and social cognition tests. We conducted Steel-Dwass-Critchlow-Fligner post hoc analyses. The relationship between demographic (age, sex, years of education), clinical (EDSS, disease duration), cognitive data (executive functions and social cognition performances), and self-reported measures was determined using Spearman correlations.
RESULTS
Demographic, Clinical, and Cognitive Data
The MS and control groups did not differ significantly with respect to age, sex distribution, or years of education (Table 1). The HADS showed a significantly higher level of depressive symptoms in the MS group than among the healthy participants. However, the scores of the patients with MS were well below (M=6.4; SD=4) the cutoff level for depression. These two groups did not differ on the HADS anxiety subscale. The EMIF-SEP score was significantly higher for patients than for healthy participants. On the cognitive measures, patients with MS scored significantly lower than healthy participants on all measures (IQ scores, Digit Span and Digit Symbol subtests, verbal fluency, WCST indices). These results are summarized in Table 1.
Comparison Between the Patients With MS and Healthy Participants on Social Cognition Performances
The results of the Mann–Whitney test revealed that patients with MS performed significantly more poorly than healthy participants on the emotion facial recognition task (see Table 2). Recognition of fear and sadness was impaired in the patients with MS. A statistical trend was observed for the MS group compared with healthy participants for disgust recognition. No differences between patients with MS and healthy participants were observed on the recognition of anger, happiness, and surprise.
Table 2 Performances of patients with MS and healthy participants on facial emotion recognition and ToM tasks

MS=multiple sclerosis; HP=healthy participants; ToM=Theory of Mind.
The overall ToM scores were significantly lower for the MS group than for healthy participants. Patients performed significantly worse than healthy participants on all three levels of ToM tasks: first-order, second-order, and faux pas (see Table 2). Patients performed more poorly on comprehension than controls, but this difference was not significant.
Correlations
We found no significant correlations between social cognition measures (emotion recognition and ToM tasks) and demographic or clinical characteristics (age, years of education, EMIF-SEP, HADS, disease duration, or EDSS) in either the MS or the control group. In the control group, no significant correlation was observed between social cognition tests and cognitive measures. In the MS group, the overall emotion recognition score was significantly positively correlated with IQ, semantic fluency, and the number of conceptual-level responses in the WCST. The ToM scores were positively correlated with IQ, executive measures (phonemic and semantic fluency, number of conceptual-level WCST responses) and with information processing speed. These results are summarized in Table 3.
Table 3 Correlations between ToM and FER performances with the cognitive measures for the MS group

ToM=Theory of Mind; FER=facial emotion recognition; WCST=Wisconsin Card Sorting Test.
†p<.10.
*p<.05.
**p<.01.
***p<.001.
Variables that reflected confounding factors (IQ, EMIF-SEP, HADS anxiety, and depression subscores) were subjected to an exploratory factor analysis using the principal component analysis method. The solution is provided in Supplementary Table S1, which shows the factor loading for each variable. The extracted factor had an eigenvalue of 2.03 and accounted for 50.9% of the variance. We then performed a hierarchical regression analysis for the emotion recognition and ToM measures. In the first block, we entered the factor extracted from the principal component analysis, and in the second block we entered group. As assumptions were not met, we performed a bias-corrected (BCa) bootstrap on the b. This analysis revealed that the overall model was significant: F(2,99)=5.38, p=.006, R 2=0.098 for emotion recognition, and F(2,99)=15,403, p=.001, R 2=0.23 for ToM. Group significantly increased the proportion of explained variance. These results are summarized in Table 4.
Table 4 Hierarchical multiple regression analysis

ToM=Theory of Mind; BCa=bias-corrected.
**p<.01.
***p<.001.
We performed a hierarchical regression to determine the contribution of high levels of cognitive functions to performances on ToM measures. Analyses included all patients with MS. Measures that were significantly correlated with the ToM measures were retained for the hierarchical regression. We added Digit Span and Digit Symbol subtests because of the relationship between these abilities and ToM in MS. Digit Span and Digit Symbol subtests were first entered as a single unit in the hierarchical regression to control for the contribution of working memory and processing speed to performance on ToM measures.
The following measures were then entered one by one: verbal fluency and the number of conceptual-level responses in the WCST. The unit composed of the Digit Span and Digit Symbol subtests accounted for 14.3% of the variance in performance (p<.01). Adding the number of conceptual-level WCST responses in the second step did not contribute significantly to predicting performances on the ToM measures, so it was removed from the model. Verbal fluency accounted for 22.6% of the variance (p<.01).
Finally, adding verbal fluency to the equation did contribute significantly to predicting performance on the ToM measures. A similar regression analysis was then carried out, with emotion recognition performance as the dependent variable and the same set of independent variables as before, with the exception of the number of conceptual-level WCST responses. The results of this second regression showed that semantic fluency was the only significant predictor of emotion recognition performance. Semantic fluency accounted for 12.2% of the variance (p<.01). A summary of the hierarchical regressions on the two social cognition measures and the contribution of the independent variables is provided in Table 5.
Table 5 Hierarchical regression summary

WCST=Wisconsin Card Sorting Test; ToM=Theory of Mind; NCR=number of conceptual responses.
Comparison Between the Three MS Subgroups and Healthy Participants on Performances
The demographic, psychometric, and clinical properties of the three MS groups and healthy participants are shown in Table 6. The three MS subgroups and healthy participants did not differ significantly with respect to age, sex distribution, or years of education. The three MS subgroups did differ significantly on length of illness, as patients with SPMS had been diagnosed for longer (M=18.5; SD=8.5) than those with PPMS (M=5; SD=3.8) or RRMS (M=11.3; SD=9.5). Patients with SPMS or PPMS also had significantly greater disability (M=5.6; SD=1 and M=4; SD=1.3) than those with RRMS (M=2.3; SD=1.7). On the cognitive measures, patients with MS scored significantly lower than healthy participants on all measures (IQ scores, Digit Span and Digit Symbol subtests, semantic fluency, WCST indices), with the exception of phonemic fluency. No difference was observed between the MS subgroups for mood and cognitive variables.
Table 6 Sociodemographic, clinical, and cognitive characteristics of patients with MS subtypes and healthy participants

Note. RR=relapsing remitting; PP=progressive primary; SP=secondary progressive; MS=multiple sclerosis; HP=healthy participants; EDSS=Expanded Disability Status Scale; HADS=Hospital Anxiety and Depression; EMIF-SEP=Échelle Modifiée d’Impact de la Fatigue – Sclérose en Plaques; NCR=number of conceptual responses; WCST=Wisconsin Card Sorting Test.
* p<.05.
** p<.01.
*** p<.001.
Table 7 displays performances on all social cognition tasks (emotion recognition and ToM tasks) in patients with RRMS, PPMS, or SPMS and healthy participants. Pairwise comparisons revealed that the SPMS and PPMS subgroups had significant lower facial emotion recognition scores than both the patients with RRMS and the healthy participants. The patients with SPMS differed from the healthy participants on the recognition of sadness, while those with PPMS differed from the healthy participants on the recognition of fear. We once again, we observed a statistical trend for disgust recognition between patients with PPMS and healthy participants. No other differences were observed.
Table 7 Performances of patients with MS and healthy participants on facial emotion recognition and ToM tasks
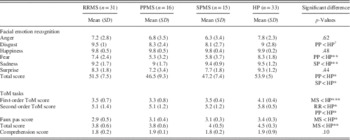
ToM=Theory of Mind; RR=relapsing remitting; PP=progressive primary; SP=secondary progressive; MS=multiple sclerosis; HP=healthy participants.
†p<.10. * p<.05. ** p<.01. *** p<.001.
The statistical comparison (Kruskall-Wallis) of task performances between patients with RRMS, PPMS, or SPMS revealed significant differences on all ToM measures. Post hoc tests demonstrated that healthy participants performed significantly better than all three MS subgroups for first-order ToM and faux pas stories. For the second-order ToM stories, patients with RRMS or PPMS performed significantly worse than healthy participants. Patients with SPMS also scored lower on the second-order ToM stories, but the difference was not significant.
Correlations
A simple Spearman correlation analysis was carried out in the three MS subgroups to reveal the relationship between performance on social cognition measures (ToM and emotion recognition) and age, education level, disease duration, physical disability (EDSS), and cognitive measures. ToM performances were significantly correlated with disease duration (r s =–.57; p=.02), the number of conceptual-level WCST responses (r s =.63; p=.01), QIG (r s =.58; p=.02) and semantic fluency (r s =.52; p=.04) in patients with SPMS. Emotion recognition performances were related to semantic fluency (r s =.70; p=.003) in patients with SPMS. In the RRMS subgroup, we found significant correlations between ToM measures and the number of conceptual-level WCST responses (r s =.44; p=0.01) and phonemic fluency (r s =.39; p=.02), as well as between emotion recognition and age (r s =–.37, p=.04) and phonemic fluency (r s =.36; p=.04). No significant correlations were observed in the PPMS subgroup.
DISCUSSION
The present study was designed to (a) confirm ToM and facial emotion recognition deficits in MS, (b) explore ToM and facial emotion recognition in patients with three MS subtypes, and (c) examine the impact of clinical disease characteristics and cognitive deficits, in particular executive deficits, on these processes. Consistent with previous studies, patients with MS performed significantly worse than healthy controls on the measures of facial emotion recognition (Henry et al., Reference Henry, Phillips, Beatty, McDonald, Longley, Joscelyne and Rendell2009; Phillips et al., Reference Phillips, Henry, Scott, Summers, Whyte and Cook2011; Prochnow et al., Reference Prochnow, Donell, Schafer, Jorgens, Hartung, Franz and Seitz2011) and ToM (Banati et al., Reference Banati, Sandor, Mike, Illes, Bors, Feldmann and Illes2010; Henry et al., Reference Henry, Bakchine, Maarouf, Chaunu, Rumbach, Magnin and Montreuil2015, Reference Henry, Tourbah, Chaunu, Rumbach, Montreuil and Bakchine2011; Ouellet et al., Reference Ouellet, Scherzer, Rouleau, Metras, Bertrand-Gauvin, Djerroud and Duquette2010; Roca et al., Reference Roca, Manes, Gleichgerrcht, Ibanez, Gonzalez de Toledo, Marenco and Sinay2014). Patients scored lower than healthy participants for all three levels of ToM, suggesting that individuals with MS have a specific ToM impairment even for simple inferences such as first-order mental state attributions.
In our study, patients also had difficulty recognizing the facial emotions of fear and sadness, and a statistical trend was observed for disgust recognition. In contrast to previous reports, no deficit was observed for anger recognition in the MS sample relative to controls (Henry et al., Reference Henry, Bakchine, Maarouf, Chaunu, Rumbach, Magnin and Montreuil2015, Reference Henry, Tourbah, Chaunu, Rumbach, Montreuil and Bakchine2011, Reference Henry, Phillips, Beatty, McDonald, Longley, Joscelyne and Rendell2009; Krause et al., Reference Krause, Wendt, Dressel, Berneiser, Kessler, Hamm and Lotze2009; Lenne et al., Reference Lenne, Barthelemy, Nandrino, Sequeira, Pinti, Mecheri and Hautecoeur2014; Prochnow et al., Reference Prochnow, Donell, Schafer, Jorgens, Hartung, Franz and Seitz2011). These deficits cannot simply be explained by a facial recognition deficit, as patients with MS were only included in our study if their BFRT score was within the normal range. These results argue for an emotional rather than a perceptual deficit. The deficit in facial affect recognition and ToM measures was not explained by demographic or clinical characteristics such as disease duration, disability, fatigue, or depressive symptoms.
By contrast, performances on both measures of social cognition were associated with several measures of executive functioning. In the MS group, ToM performances were significantly correlated with the WAIS-III Digit Span subtest and semantic fluency, and both measures of social cognition (ToM stories and facial recognition task) were related to verbal fluency (semantic and phonemic fluency) and the number of conceptual-level WCST responses. In the multivariate analysis, the verbal fluency, and Digit Span and Digit Symbol subtests emerged as significant predictors of ToM abilities, for together, they accounted for 22.6% of the observed variance. Semantic fluency was the only significant predictor of emotion recognition accuracy, explaining 12.2% of the variance observed. This suggests that processing speed, working memory, and verbal fluency may be related to social cognition difficulties in MS.
We also found that all MS patient subtypes differed significantly from healthy participants on ToM measures. However, no difference was found between the three subtypes. These results suggest that patients with MS have difficulty making simple mental state attributions such as first-order attributions. The only exceptions were the patients with SPMS, for although they performed at a lower level than healthy controls on the second-order ToM stories, this difference was not significant. This suggests that they are able to make second-order mental state attributions but not first-order ones. This seems counterintuitive. In our study, the tasks we used were developmentally graded, ranging in difficulty. First-order mental state attribution is acquired at around 3–4 years (Wimmer & Perner, Reference Wimmer and Perner1983), second-order mental state attribution at around 6–7 years (Perner & Wimmer, Reference Perner and Wimmer1985), and faux pas at around 9–11 years (Baron-Cohen, O’Riordan, Stone, Jones, & Plaisted, Reference Baron-Cohen, O’Riordan, Stone, Jones and Plaisted1999). Both first- and second-order false belief stories are traditionally used to assess the cognitive component of ToM. The result for the second-order false belief test may, therefore, have stemmed from the small size of our sample. Overall results quite clearly demonstrate that the SPMS group was impaired on tasks involving ToM. The correlations seem to indicate that executive functions, especially mental flexibility, play a role in ToM performances for the RRMS and SPMS groups. However, these results should be viewed with caution. Again, the small sample size prevents us from drawing any conclusions, even if the results for the RRMS and SPMS subgroups seem consistent with those obtained for the whole group and with the findings of several other studies (Banati et al., Reference Banati, Sandor, Mike, Illes, Bors, Feldmann and Illes2010; Henry et al., Reference Henry, Phillips, Beatty, McDonald, Longley, Joscelyne and Rendell2009; Ouellet et al., Reference Ouellet, Scherzer, Rouleau, Metras, Bertrand-Gauvin, Djerroud and Duquette2010).
Importantly, the comparison between patient subgroups revealed several differences in the pattern of emotion recognition impairment. Patients with chronic progressive MS were found to have difficulty with emotion recognition relative to healthy participants, whereas patients with RRMS showed no such impairment, in accordance with several studies (Di Bitonto et al., Reference Di Bitonto, Longato, Jung, Fleury, Marcel, Collongues and Blanc2011; Jehna et al., Reference Jehna, Neuper, Petrovic, Wallner-Blazek, Schmidt, Fuchs and Enzinger2010; Pinto et al., Reference Pinto, Gomes, Moreira, Rosa, Santos and Silva2012). These results underscore the importance of considering the MS forms separately in studies of social cognition abilities. None of the studies in the existing literature on emotion recognition impairment undertook such a comparison. Typically, in both these studies and ours, patients with MS obtained lower emotion recognition scores than healthy participants (Banati et al., Reference Banati, Sandor, Mike, Illes, Bors, Feldmann and Illes2010; Berneiser et al., Reference Berneiser, Wendt, Grothe, Kessler, Hamm and Dressel2014; Prochnow et al., Reference Prochnow, Donell, Schafer, Jorgens, Hartung, Franz and Seitz2011).
However, when we distinguished between patient subgroups, only patients with progressive forms were found to have difficulty recognizing emotions. Moreover, the patients with PPMS performed significantly worse than the healthy participants on fear recognition, though not on sadness recognition, unlike the patients with SPMS. This result supports the idea of dissociable neural substrates for recognizing specific emotions (Adolphs, Reference Adolphs2009). Neuropsychological and neuroimaging data indicate that the different facial emotional expressions are encoded through specific neural substrates. Selective impairment of anger recognition has been associated with lesions of the ventral striatum (Calder, Keane, Lawrence, & Manes, Reference Calder, Keane, Lawrence and Manes2004), fear with lesions of the amygdala (Adolphs, Reference Adolphs2002), and disgust with lesions of the insula (Kipps, Duggins, McCusker, & Calder, Reference Kipps, Duggins, McCusker and Calder2007).
Selective emotion recognition impairment in MS is, however, not a universal finding. Prochnow et al. (Reference Prochnow, Donell, Schafer, Jorgens, Hartung, Franz and Seitz2011) and Krause et al. (Reference Krause, Wendt, Dressel, Berneiser, Kessler, Hamm and Lotze2009) reported no evidence of selectivity. It is unclear whether the variability among studies relates to differences in stimulus materials or in study populations. Another possible explanation is the specific neural involvement of the brain regions thought to be implicated in decoding these facial emotions. A meta-analysis conducted by Fusar-Poli et al. in Reference Fusar-Poli, Placentino, Carletti, Landi, Allen, Surguladze and Politi2009 showed that sad faces activate the right amygdala and left lingual gyrus, and fear is associated with activation in the bilateral amygdala and fusiform and medial frontal gyri. The processing of fearful faces, as opposed to sad faces, elicits increased activation in the bilateral amygdala and right fusiform gyrus. No brain regions are activated more by sad faces than by fearful ones.
Emotional face recognition is a complex process that cannot be related to a single brain region, but instead involves an interactive network with distributed activity in time and space. The focality and location of MS lesions are highly variable. White- and grey-matter pathology in MS affects multiple brain regions and disrupts several neural networks that play key roles in facial emotion recognition. This could result in different profiles of emotion recognition difficulties in MS samples across studies. The relative proportion of damage to areas such as amygdala and ventral putamen could determine whether the emotion recognition impairment in MS is more severe for fear or for sadness. Additional studies including structural and functional connectivity MRI examinations are needed to confirm this hypothesis.
Our study had several limitations. First, the MS sample size, in particular for the progressive MS subgroups, was relatively small, and the findings, therefore, need to be interpreted with caution. It could be argued that low statistical power accounted for our failure to find other significant differences between the MS subgroups and healthy participants, as well as restricting our choice of statistical techniques. Further studies with larger samples of primary and secondary progressive MS forms are needed to confirm our preliminary results. Second, our study design did not include any neuroimaging data.
Future studies should explore the anatomo-functional network underlying social cognition abilities, specifically emotion recognition, given the heterogeneous pattern of deficits observed in the present study. This apparent heterogeneity could be the result of factors that we did not consider, and that is a further limitation of our research. Dividing the MS sample according to the form of the disease may mask other, more relevant, factors such as disease activity. The revised 2013 clinical course descriptions (Lublin et al., Reference Lublin, Reingold, Cohen, Cutter, Sørensen, Thompson and Polman2014) recommended assessing disease activity on clinical (with or without progression) and brain imaging (active or not active) criteria for relapsing and progressive MS. Future research including an assessment of disease activity is, therefore, needed to better understand and define ToM and emotion recognition deficits in MS.
In summary, to our knowledge, few studies have specifically explored social cognition abilities in different MS subtypes. Our data revealed ToM difficulties in all three MS subgroups, albeit at different levels of complexity, but emotion recognition difficulties were restricted to patients with a chronic progressive form. We found qualitative differences between the PPMS and SPMS subtypes on emotion recognition deficits. Patients with SPMS performed worse than both healthy participants and patients with RRMS on sadness recognition, and patients with PPMS performed worse than both healthy participants and patients with RRMS on fear recognition. These deficits do not seem to be related to either disease characteristics (disease duration, level of disability) or mood disorders (anxiety and depression).
By contrast, executive functions, in particular verbal fluency, seem to play a role in social cognition abilities in MS. In our sample and in the literature, it remains unclear whether social cognition difficulties are primary, or secondary to cognitive disorders. Our results are preliminary and must be viewed with caution given the small sample size of progressive MS subgroups. It seems that further research on larger samples will be required to specifically investigate the origin of the observed social cognition difficulties before we can conclude that there is a primary social cognition deficit in MS.
Social cognition impairments are associated with disturbances in the quality of social interactions. Recognizing emotional expressions and attributing independent mental states to others are prerequisites for successful social interactions (Van Kleef, Reference Van Kleef2009). These processes allow individuals to quickly adapt their behaviour to their environment. Given the importance of these processes for the development and maintenance of close interpersonal relationships, social cognition difficulties could, at least in part, be responsible for the deterioration in the quality of social interactions in MS (Phillips et al., Reference Phillips, Henry, Scott, Summers, Whyte and Cook2011). The impact of disorders affecting social cognition could be just as important as cognitive disorders for social functioning in MS. Several studies of other neurological and psychiatric diseases (e.g., schizophrenia) have shown that social cognition is more closely associated with social functioning than neurocognition (Fett et al., Reference Fett, Viechtbauer, Dominguez, Penn, van Os and Krabbendam2011; Mancuso, Horan, Kern, & Green, Reference Mancuso, Horan, Kern and Green2011).
Thus, it is important to include assessments of social cognition in clinical evaluations and to assess the functional impact of social cognition difficulties on the daily lives of patients with MS. Further research is needed to specify the links between social cognition and quality of life, describe the impact of social cognition difficulties on patients’ social interactions, and define possible interventions to remediate social cognition dysfunctions in MS.
ACKNOWLEDGMENTS
The authors thank all the people who took part in this study and Elizabeth Portier for reviewing the English style. The authors declare that they have no conflicts of interest affecting this article. This research received no specific grant from any funding agency, commercial or not for profit sectors.
Supplementary material
To view supplementary material for this article, please visit https://doi.org/10.1017/S1355617717000510


