1. Introduction
The so-called ‘Purana’ or Proterozoic basins (Fig. 1a) cover large expanses of cratonic India (Chaudhuri et al. Reference Chaudhuri, Mukhopadhyay, Deb and Chanda1999, Reference Chaudhuri, Saha, Deb, Patranabis-Deb, Mukherjee and Gosh2002; Kale & Phansalkar, Reference Kale and Phansalkar1991). For over a century, the largely unmetamorphosed and undeformed successions of the Purana basins were considered to have been deposited during be Neoproterozoic era (Chaudhuri et al. Reference Chaudhuri, Mukhopadhyay, Deb and Chanda1999), but this has been challenged with the publication of 990–1020 Ma U–Pb zircon SHRIMP ages for magmatic zircons from tuff horizons near the top of the sedimentary succession in the Chattisgarth Basin (Patranabis-Deb et al. Reference Patranabis-Deb, Bickford, Hill, Chaudhuri and Basu2007), and a 1405±9 Ma U–Pb detrital zircon SHRIMP age some c. 100 m above the succession base (Bickford et al. Reference Bickford, Basu, Patranabis-Deb, Dhang and Schieber2011; Fig. 1b). The largest of the Purana basins, the Vindhyan Basin, is now also considered mostly Mesoproterozoic in age. This is based on the palaeomagnetic signature of sandstones of the Upper Vindhyan succession, which is similar to that of the c. 1000 Ma Majhgawan Kimberlite (Malone et al. Reference Malone, Meert, Banerjee, Pandit, Tamrat, Kamenov, Pradhan and Sohl2008). Furthermore, magmatic zircons near the base of the Vindhyan Supergroup have been dated between 1628±8 Ma and 1599±8 Ma (Rasmussen et al. Reference Rasmussen, Bose, Sarkar, Banerjee, Fletcher and McNaughton2002). According to Rasmussen et al. (Reference Rasmussen, Bose, Sarkar, Banerjee, Fletcher and McNaughton2002), the lower Vindhyan succession was probably deposited during the early–middle Mesoproterozoic; according to Malone et al. (Reference Malone, Meert, Banerjee, Pandit, Tamrat, Kamenov, Pradhan and Sohl2008), the upper Vindhyan succession appears to have been deposited near the end of the Stenian period (i.e. late Mesoproterozoic era). Similarly, it appears that the lower Chandarpur–Raipur succession of the Chattisgarth Basin was deposited during the early–middle Mesoproterozoic era (following the age assignment by Bickford et al. Reference Bickford, Basu, Patranabis-Deb, Dhang and Schieber2011), while the upper part of the succession was deposited during the late Mesoproterozoic era (Patranabis-Deb et al. Reference Patranabis-Deb, Bickford, Hill, Chaudhuri and Basu2007). This depends on the exact stratigraphic placement of the c. 1000 Ma tuff beds within the Chandarpur–Raipur succession however, which has been the subject of some debate. Basu et al. (Reference Basu, Patranabis-Deb, Schieber and Dhang2008) made a very convincing argument for placement of these tuffs near the upper part of the Chandarpur–Raipur succession. This placement is at odds with available maps published by the Geological Survey of India which place the tuffs near the base of the succession (Basu et al. Reference Basu, Patranabis-Deb, Schieber and Dhang2008), suggesting that most of the Chandarpur–Raipur succession was deposited near the end of the Stenian period.
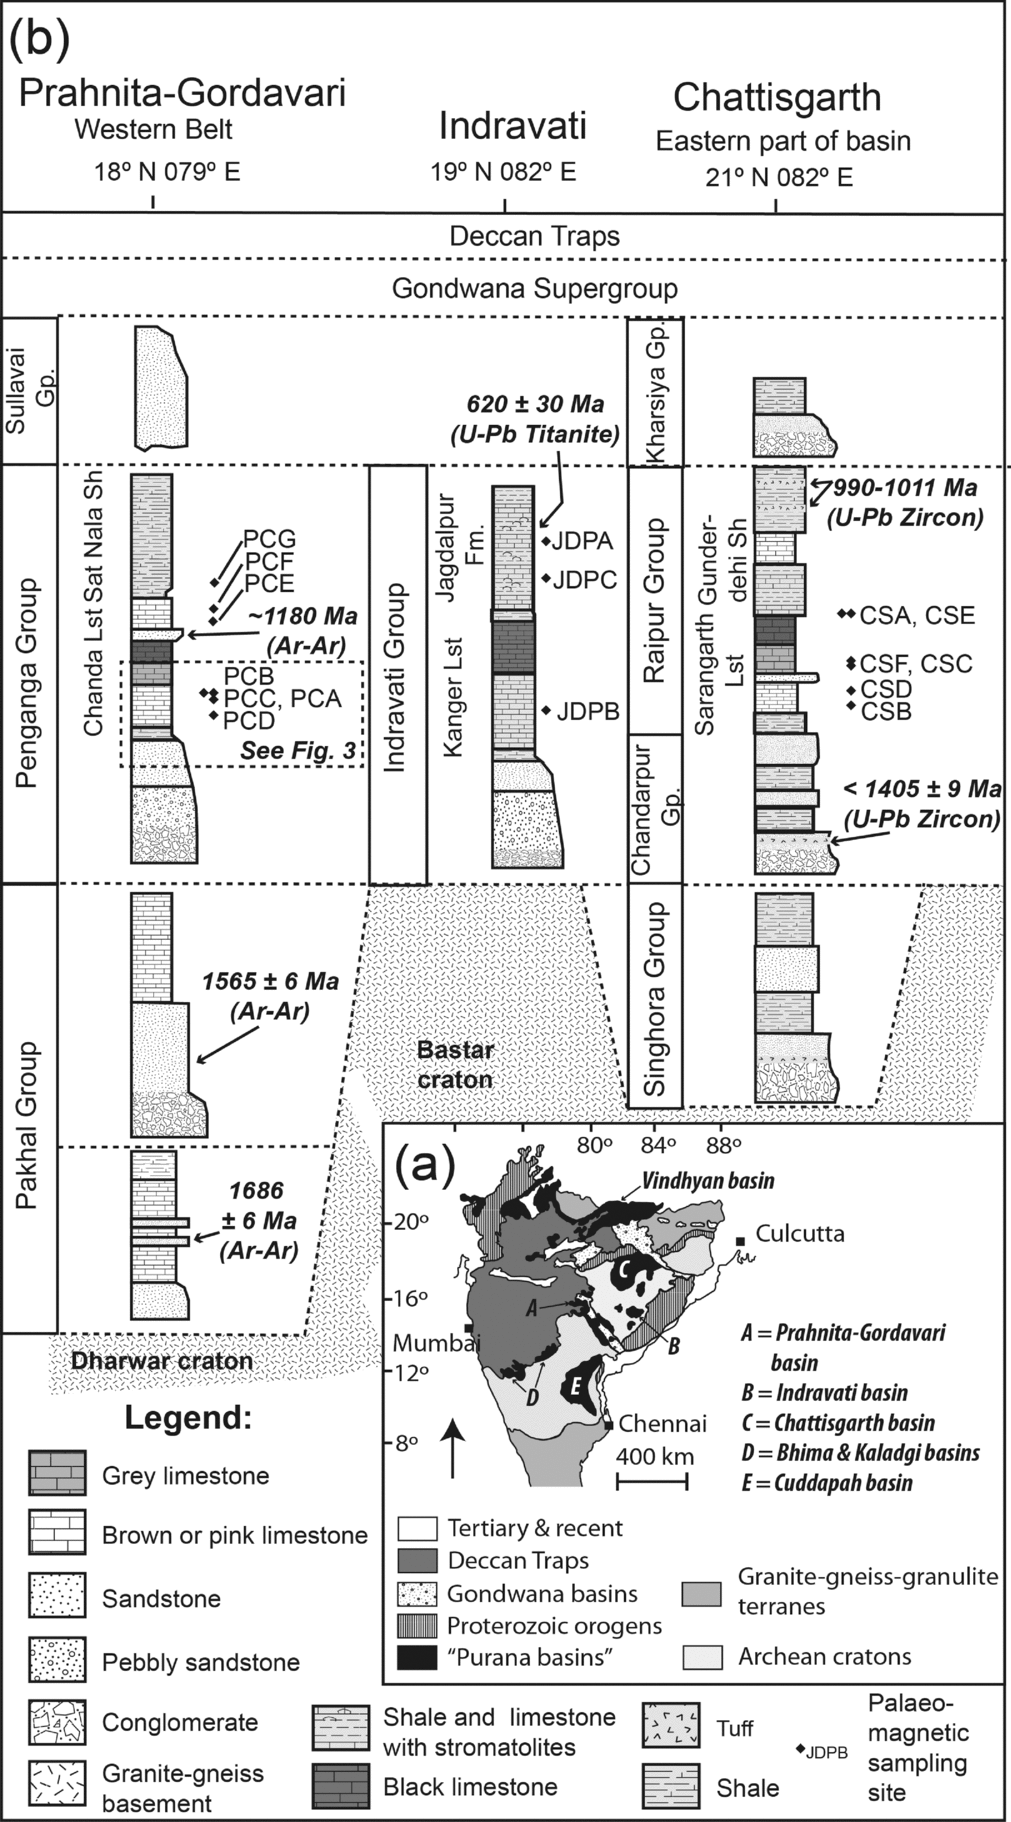
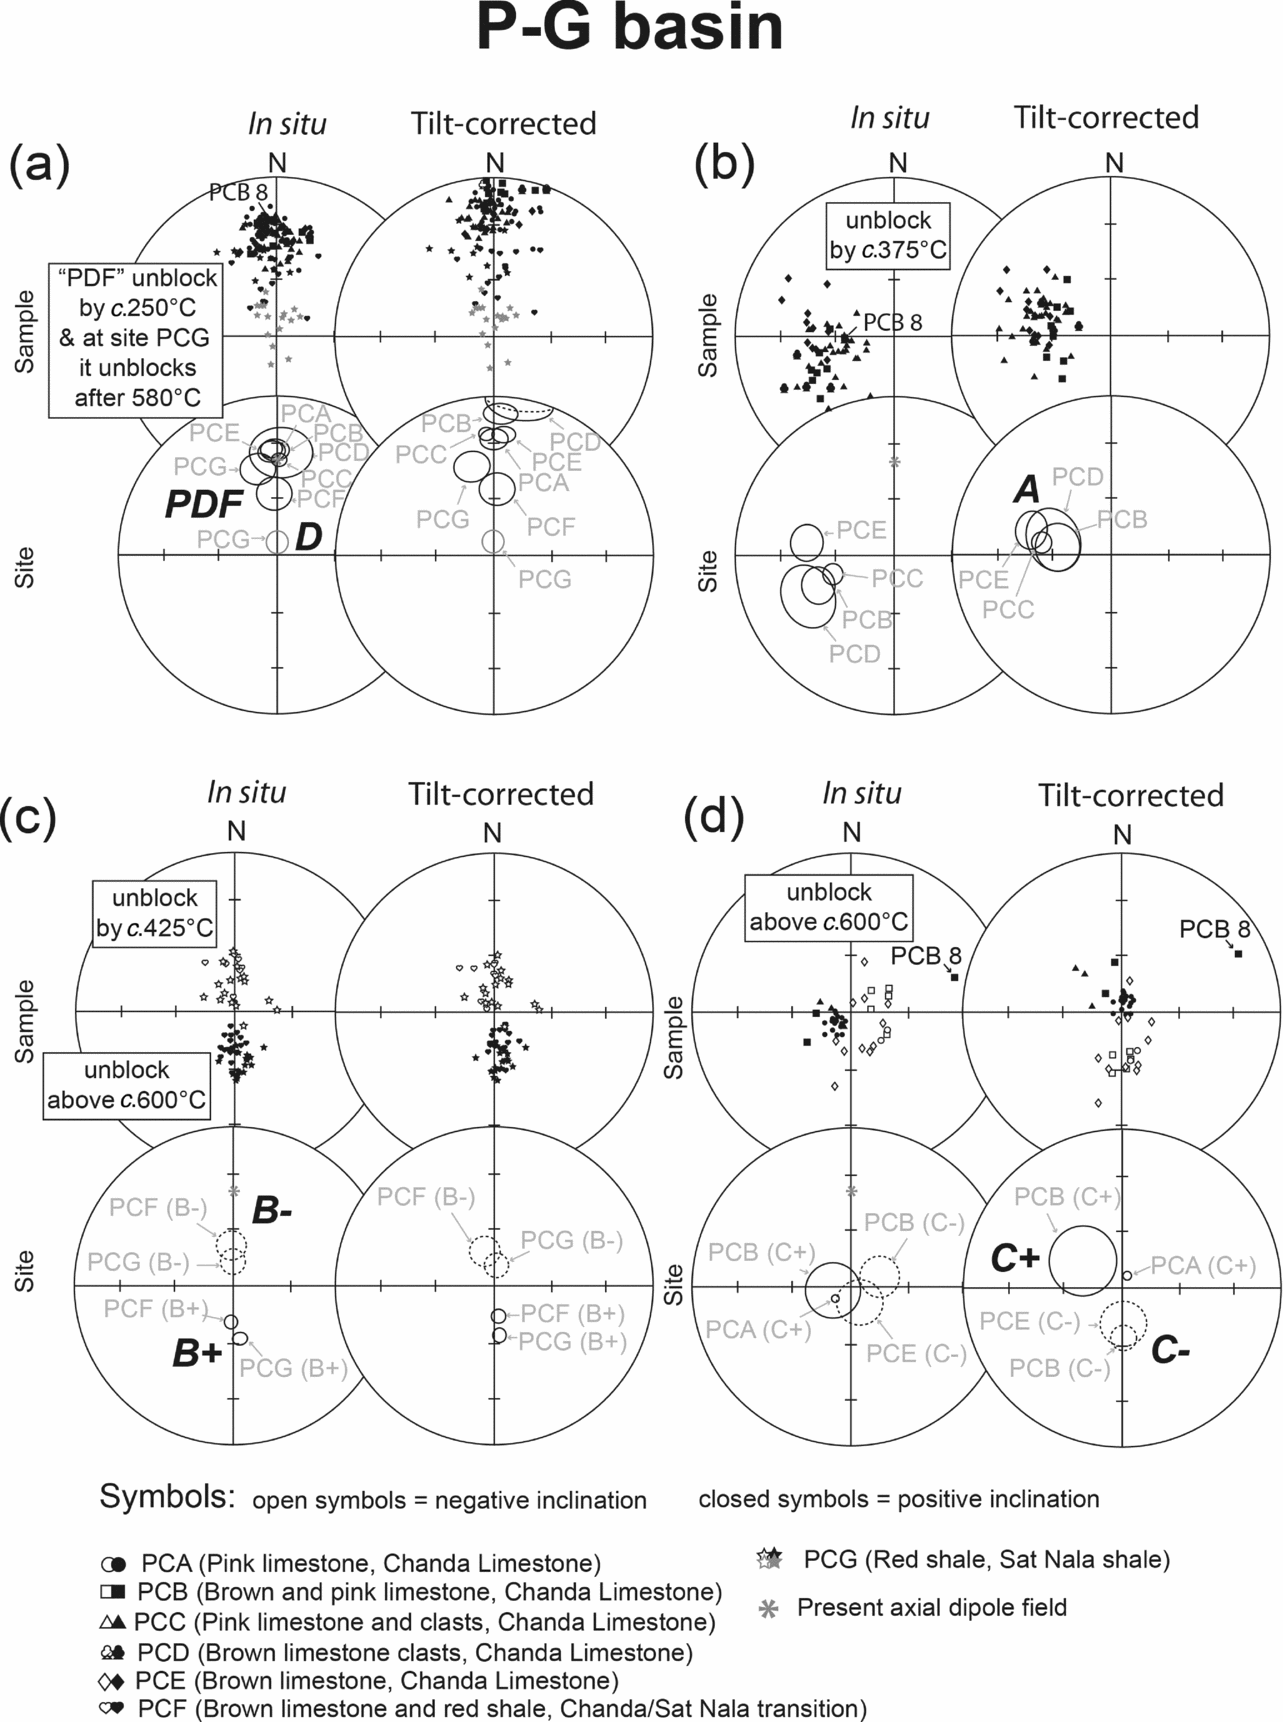
Figure 1. (a) Simplified geological map of India shows the locality and outcrop distribution of the Purana basins, the Gondwana Supergroup and the Deccan Traps. (b) Illustration of the >1800 Ma Penganga Group of Prahnita–Gordavari Basin and its correlation over considerable distance to the Indravati Group and the 1405–990 Ma Chattisgarth Group further to the northeast (diagram modified after Conrad et al. Reference Conrad, Hein, Chaudhuri, Patranabis-Deb, Mukhopadhyay, Deb and Beukes2011). Sh – shale; Lst – limestone; Fm. – formation. Palaeomagnetic sampling sites from this study are indicated.
Correlating successions among the Purana basins without geochronological constraints have proven difficult. Historically the successions were correlated in terms of their relative stratigraphic position, lithological similarities, degree of metamorphism and deformation, and stromatolite morphology (e.g. Chaudhuri et al. Reference Chaudhuri, Saha, Deb, Patranabis-Deb, Mukherjee and Gosh2002). Palaeomagnetic studies in recent years have shown that India's palaeolatitude in the early and middle Mesoproterozoic era was characteristically different, and also different from that in the latest Meso- to earliest Neoproterozoic. Current data suggest that India was occupying a relatively high latitudinal position at 1460 Ma (Pisarevsky et al. Reference Pisarevsky, Biswal, Wang, Waele, Ernst, Söderlund, Tait, Ratre, Singh and Cleve2013) and at c. 1.2 Ga (Pradhan et al. Reference Pradhan, Meert, Pandit, Kamenov, Gregory and Malone2010), compared to a well-established more equatorial position at c. 1.1 Ga (Gregory et al. Reference Gregory, Meert, Pradhan, Pandit, Tamrat and Malone2006; Malone et al. Reference Malone, Meert, Banerjee, Pandit, Tamrat, Kamenov, Pradhan and Sohl2008; Pradhan et al. Reference Pradhan, Meert, Pandit, Kamenov and Mondal2012). Constraining palaeolatitude therefore provides a potentially invaluable tool to assist in the correlation of Purana basin successions in the absence of robust geochronological constraints or in areas where direct correlation of isolated outcrops prove difficult.
Here we report palaeomagnetic data from three of the Purana basins on the Dharwar and Bastar cratons, namely the Pranhita–Godavari (P-G), Chattisgarth, and the Indravati basins (Fig. 1b). Our data allow us to correlate the limestone and shale successions among these basins, and we provide an additional constraint on the latitudinal position of India in the interval spanning supercontinent Columbia's break-up and the supercontinent Rodinia's assembly. The relative age of the successions in the Purana basins (i.e. early versus late Mesoproterozoic age) is of some importance given the relative rarity of Mesoproterozoic-aged basins worldwide, and because of the controversial presence of fossils of Ediacaran-like creatures in the Chattisgarth and Vindhyan basins (Basu, Reference Basu2009; Bengtson et al. Reference Bengtson, Beltvanova, Rasmussen and Whitehouse2009).
2. Geological setting
The Purana basins of India's southern cratonic province include, among others, the P-G basin, the Chattisgarth basin, and the Indravati basin (Fig. 1a). Fill in these basins is represented by up to 6.6 km in preserved thickness (Chaudhuri et al. Reference Chaudhuri, Saha, Deb, Patranabis-Deb, Mukherjee and Gosh2002) of virtually unmetamorphosed and mildly deformed marine sedimentary successions. These comprise sheet-like unconformity-bounded sequences, some of which exhibit transitions from immature siliciclastics to carbonate-shale successions, which are suggestive of passive margin settings. One such sequence, the Penganga Group (of the P-G basin), has been correlated over 300 km to the Chandarpur–Raipur succession of the Chattisgarth basin (Conrad et al. Reference Conrad, Hein, Chaudhuri, Patranabis-Deb, Mukhopadhyay, Deb and Beukes2011); see Figure 1b.
The only age constraints for the Penganga Group are 39Ar/40Ar ages on early authigenic glauconite (Conrad et al. Reference Conrad, Hein, Chaudhuri, Patranabis-Deb, Mukhopadhyay, Deb and Beukes2011). These suggest that the maximum age of Penganga sedimentation must be significantly younger than 1565±6 Ma, and that the minimum age of deposition is c. 1180 Ma (Fig. 1b). It is however unclear whether the Penganga Group was largely deposited during the Stenian period, or if its deposition also spans earlier parts of the Mesoproterozoic era. The Indravati Group (Indravati basin) is historically regarded as the equivalent of the Penganga Group and Chandarpur–Raipur succession (Chaudhuri et al. Reference Chaudhuri, Mukhopadhyay, Deb and Chanda1999), but no robust geochronological constraints exist to support this.
3. Palaeomagnetism
We collected 168 individually oriented core samples at seven localities of brown and pink limestone and calcareous shale of the Penganga Group exposed along the western flank of the P-G basin north and northeast of Adilabad (Fig. 2a). Samples originate from various stratigraphic levels of this c. 1225-m-thick succession (Chaudhuri et al. Reference Chaudhuri, Saha, Deb, Patranabis-Deb, Mukherjee and Gosh2002). The sampled intervals include the lower stratigraphic levels of the Chanda limestone (Figs 1b and 2b), as well as the Sat Nala shale stratigraphically near the top of the Penganga Group (Fig. 1b). Our sampling strategy included two prominent inter-bedded autoclastic limestone conglomerate units (sites PCC and PCD, Figs 1b and 2b) of debris-flow origin (Mukhopadhyay et al. Reference Mukhopadhyay, Chanda, Fukuoka and Chaudhuri1996).
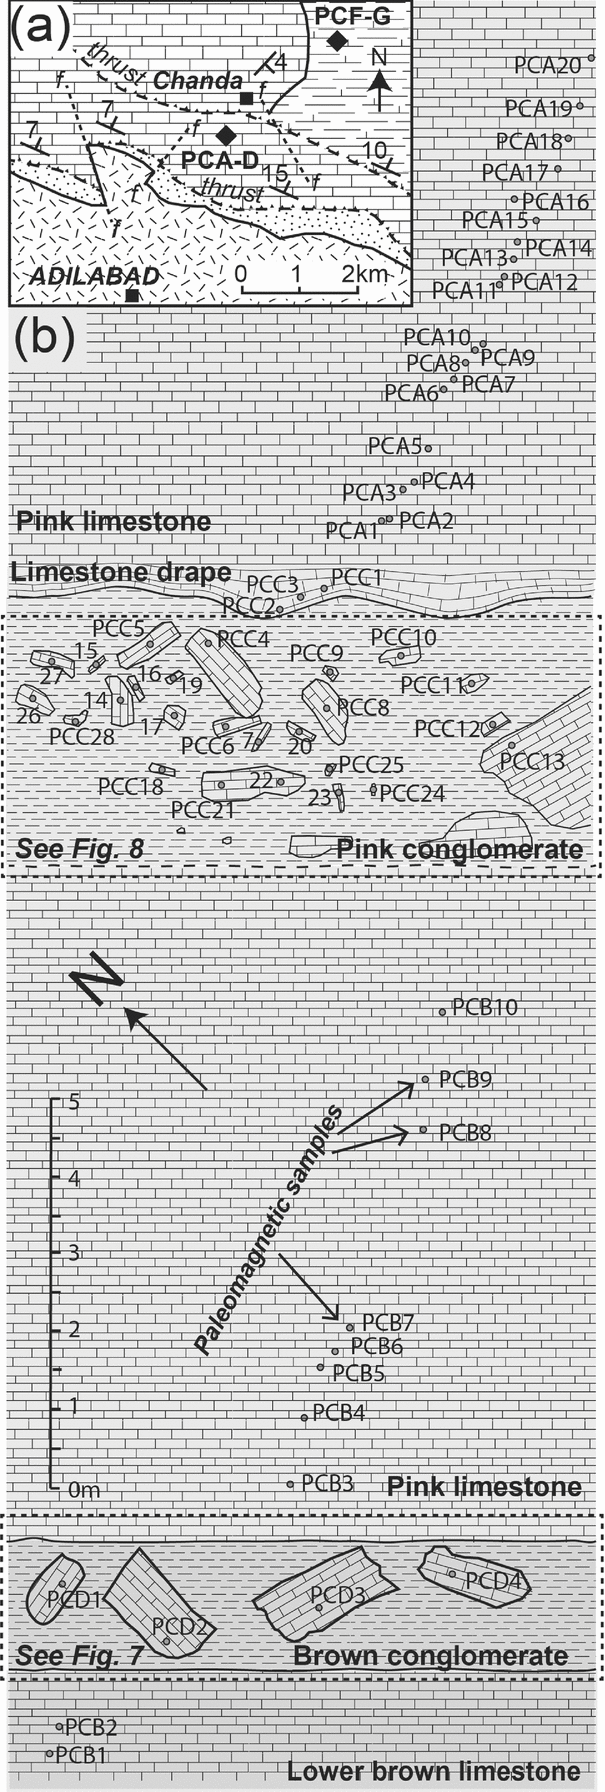
Figure 2. (a) Simplified geological map of an area northeast of Adilabad showing the relative locality of palaeomagnetic sampling sites within the Penganga Group. Lithological symbols as for Figure 1b. (b) Relative stratigraphic and spatial distribution of palaeomagnetic samples from site PCA to PCD, including sketched details of two debris-flow conglomerates.
From the Chattisgarth Basin, we collected 45 individually oriented core samples from five sites. Samples are representative of brown and grey limestone from the lower and upper parts of the c. 350-m-thick (Patranabis-Deb et al. Reference Patranabis-Deb, Bickford, Hill, Chaudhuri and Basu2007) Sarangarth limestone of the Raipur Group (Fig. 1b). One of these sampling sites (site CSC) represents a grey limestone–clast conglomerate with a quartz sand matrix.
From the Indravati Basin a further 30 individually oriented core samples originate from siliceous limestone (JDPB) and shale units (JDPA and JDPC) in the vicinity of Jagdalpur from the Kanger limestone and the Jagdalpur Formation, respectively (see Fig. 1b).
Limestone is notoriously prone to remagnetization and often records multiple remanence directions (e.g. Trindade et al. Reference Trindade, D’Agrella-Filho, Babinski, Font and Brito Neves2004; De Kock et al. Reference De Kock, Evans, Kirschvink, Beukes, Rose and Hilburn2009), but it is important to realize that there are many examples of limestone being faithful carriers of primary magnetic signatures (e.g. Idnurm, Giddings and Plumb, Reference Idnurm, Giddings and Plumb1995; Trindade et al. Reference Trindade, Font, D’Agrella-Filho, Nogueira and Riccomini2003; Kirschvink et al. Reference Kirschvink, Kopp, Raub, Baumgartner and Holt2008). This is particularly true if the limestone in question has experienced a very low degree of metamorphism and weathering. The use of stability field tests (e.g. Tauxe et al. Reference Tauxe, Butler, Banerjee and Van der Voo2009) is therefore essential to establish the timing of remanence acquisition. Our sampling strategy provides for several conglomerate and fold tests of palaeomagnetic stability.
Palaeomagnetic samples were drilled with a portable gasoline drill and oriented with magnetic compass and (for most samples) a solar compass. Cores were trimmed to c. 2.4-cm-long specimens and measured on a 2G-Enterprises™ superconducting rock magnetometer with an automatic sample changer (Kirschvink et al. Reference Kirschvink, Kopp, Raub, Baumgartner and Holt2008) housed at the California Institute of Technology. One specimen from each sample was demagnetized in approximately 30 demagnetization steps. Steps included a measurement of natural remanent magnetization (NRM), alternating-field (AF) cleaning in five 2 mT steps up to 10 mT, and thermal demagnetizion steps from 80°C to 650°C. Thermal demagnetization was completed within about 25 decreasing increments, or until specimen intensity dropped below instrument noise level (below c. 1 pA m2). Magnetic components were identified and quantified via least-squares analysis (Kirschvink, Reference Kirschvink1980) utilizing Paleomag 3.1 (Jones, Reference Jones2002). Pmagpy routines (Tauxe et al. Reference Tauxe, Butler, Banerjee and Van der Voo2009), and Gplates (Williams et al. Reference Williams, Müller, Landgrebe and Whittaker2012) were also used for evaluating some aspects of the data and for plotting palaeopole positions.
4. Demagnetization results
4.a. Penganga Group
4.a.1. Lower Chanda limestone
Brown and pink limestone samples from the lower Penganga Group (Figs 1b and 2b) display comparable behaviour during demagnetization (Fig. 3). North- and downwards-directed components are removed in all samples during low field-strength AF demagnetization steps and thermal demagnetization steps up to c. 250°C. In a small amount of samples these components are already removed when 200°C is reached. These components are nearly parallel to the present-day axial dipole field at the various localities, and we use the abbreviation PDF (for present-day field) when referring to them (Fig. 4a).

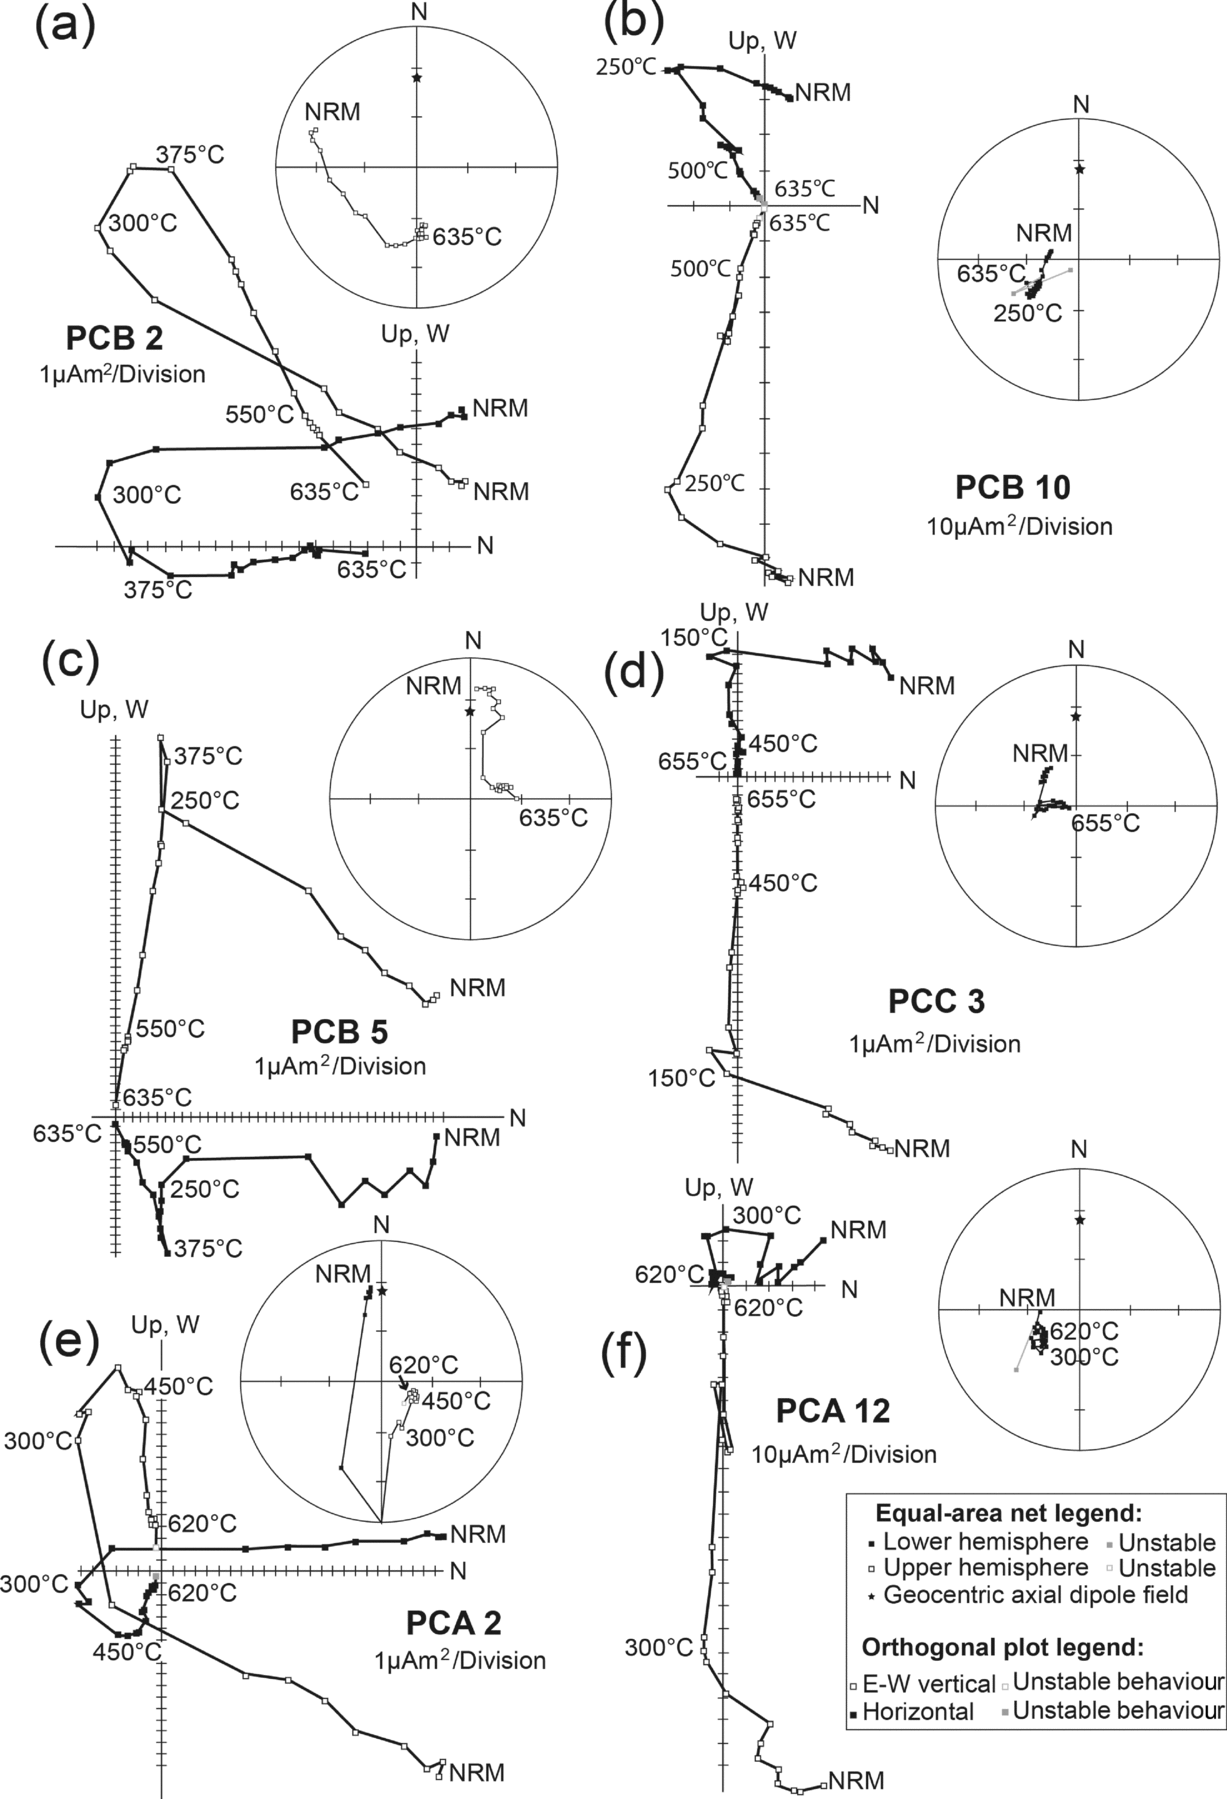
Figure 3. Representative demagnetization behaviour of pink limestone from the basal Chanda limestone of the Penganga Group (Pranitha–Godavari Basin) represented as orthogonal projection onto the horizontal and E–W vertical planes, as well as on equal-area diagrams (both in geographic coordinates). Samples are characterized by two to three magnetic components. In all samples, a north- and downwards-directed PDF component is removed below c. 250ºC (a–f) and a poorly developed west- and downwards-directed A component was removed between c. 250ºC and 375ºC (a, c–e). At higher themal demagnetization steps (i.e. above c. 375ºC up to c. 635ºC), either steep upwards-directed C– characteristic components (a, c, e) or steep downwards-directed C+ characteristic components (b, d, f) unblocked. NRM – natural remanent magnetization.

Figure 4. Summary of components and site means for various identified magnetic directions from the Pranitha–Godavari Basin. (a) Generally low-stability PDF components and calculated site means are near parallel to the present axial dipole field for India, while component D is a steep low-stability component identified in red shale samples of the Sat Nala shale. (b) Pink Chanda limestone samples reveal west- and downwards-directed components (i.e. component A) by c. 375°C. Component A site means display increased grouping upon tilt correction. (c) After the removal of PDF components, the brown limestone and red shale samples from the upper Chanda limestone and Sat Nala shale display relatively steep upwards- and north-directed (B–) components below c. 375°C, and steep downwards- and south-directed characteristic components (B+) that are stable above c. 600°C. (d) During high-temperature demagnetization steps, pink Chanda limestone samples reveal either steep downwards- (C+) or upwards-directed (C–) characteristic components, which resolve into two well-grouped antipodal north and south nodes upon tilt correction.
The majority of brown and pink limestone samples displayed WSW-directed, steeply downwards, components (referred to as ‘A’; Figs 3 and 4b) between 250°C and 375°C. In some cases, component A persisted up to 450°C.
Samples PCB 10 (see Fig. 3b) and PCA 1–20 (see Fig. 3f) do not record A components, but display linear demagnetization trajectories towards the origin between 250°C and 620°C (or 560°C in the cases of PCA 14–17). These characteristic components are labelled ‘C’. The high-temperature demagnetization trajectory of PCB 10 is oriented west and steeply downwards (Fig. 3b); those of PCA 1 and 2 are east and up (see Fig. 3e) and those of PCA 3–20 are directed southeast and downwards (see Fig. 3f). In the remainder of samples the removal of component A (demagnetization steps above 375°C or 450°C) is generally followed by linear demagnetization trajectories towards the origin (i.e. component C). These high-temperature components are all very steeply inclined and directed south and upwards (PCB 2, Fig. 3a), east and upwards (PCB 3–7, see Fig. 3c), west and downwards (PCB 9, PCC 2, PCC 3, see Fig. 3d), or SSW and downwards (PCC 1). The C components (Fig. 4d) therefore form two nodes that are either steeply upwards directed (C–) or steeply downwards directed (C+).
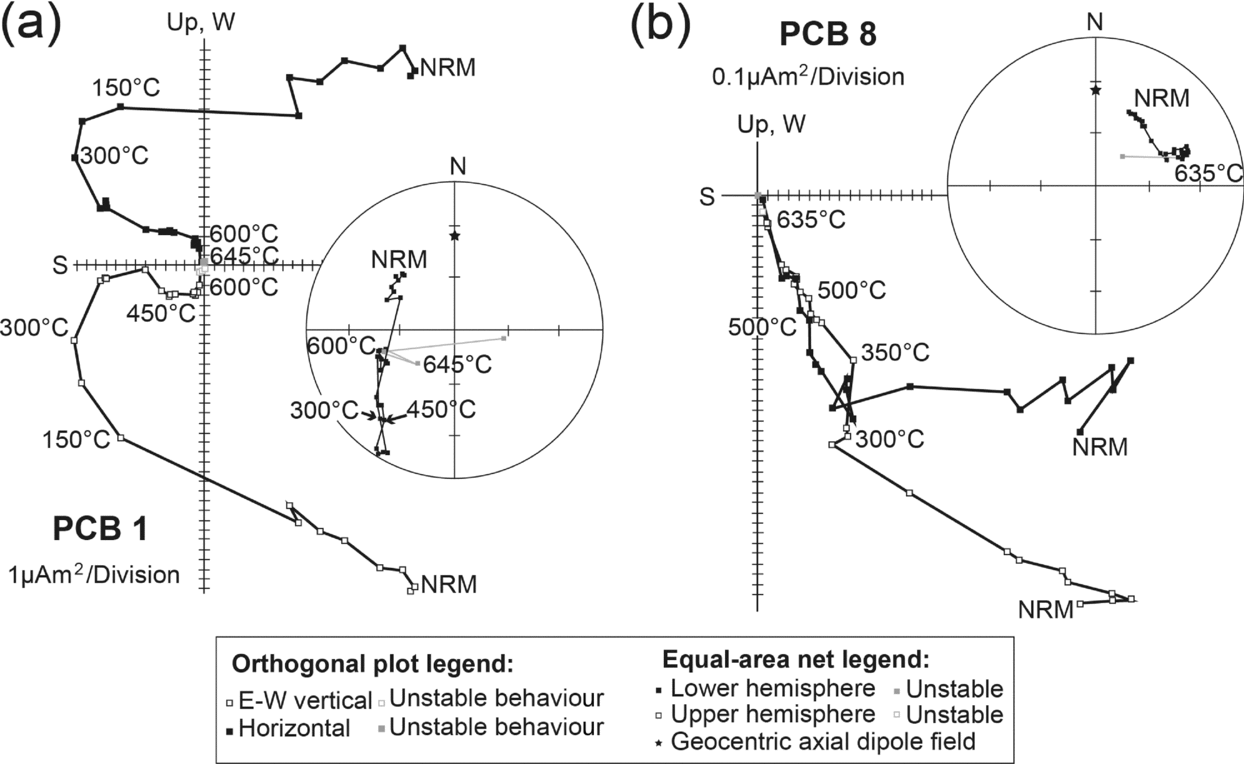
Notable deviations to the behaviour described above were observed samples PCB 1 and PCB 8 (Fig. 5). After the removal of components PDF and A in sample PCB 1, it displays a south and upwards directed component (C–) in the range of 375°C to 600°C that misses the origin (Fig. 5a). A stable-end point of demagnetization is reached at c. 600°C, which can be anchored to the origin to define a SW-directed and downwards component similar to component A. Component A in this sample therefore appears to be carried by two distinct magnetic phases. One is a stable magnetic carrier below 375°C (possibly iron sulphide or a titano-magnetite), while the other is still stable at 600°C (hematite). In sample PCB 8 a west- and downwards-directed characteristic magnetization unblocks following the removal of components PDF and A (Fig. 5b). This characteristic component is a clear visual outlier when compared to C directions identified in other samples from this locality (Fig. 4c and d). The presence of consistent PDF and A components in sample PCB 8 suggest that an orientation error can be excluded; nevertheless, we prefer to discard this characteristic component from all subsequent evaluations.

Figure 5. Spurious characteristic components revealed during demagnetization of two samples from Chanda limestone site PCB, represented as orthogonal projection onto the horizontal and E–W vertical planes as well as on equal-area diagrams (both in geographic coordinates). (a) Sample PCB 1 displays a west- and moderately downwards-directed characteristic magnetization after the removal of PDF, A and C– components. (b) In Sample PCB 8 a west- and downwards-directed characteristic magnetization unblocks following the removal of components PDF and A.
4.a.2. Conglomerates in the lower Chanda limestone
Limestone clasts of two separate debris-flow conglomerates were sampled to test the age of remanence acquisition in the lower Chanda limestone (Fig. 2b). The conglomerate test of palaeomagnetism assumes that if a remanence direction pre-dates conglomerate formation, that the direction would be randomly distributed in the various clasts of the conglomerate (e.g. Tauxe et al. Reference Tauxe, Butler, Banerjee and Van der Voo2009). A critical aspect of a conglomerate test is that the clasts should also display analogous demagnetization behaviour to their parent lithology.
The first debris-flow conglomerate is located in the lower part of the Chanda limestone within brown limestone (site PCD; Fig. 2b). During demagnetization of four clasts (Fig. 6) a PDF component was generally removed below 300°C. Between 325°C and 375°C, a poorly constrained west- and downwards-directed remanence was revealed in all four clasts. These are similar to the A directions seen in the lower Chanda limestone. Above 375°C up to 575°C, samples demagnetize as linear trajectories that are steep SW directed and upwards oriented in samples PCD 1, 3 and 4, but northerly and shallow upwards in sample PCD 2. Between 575°C to 635°C all samples reach stable end-points of demagnetization that can be quantified by anchoring them to the origin. This behaviour of clasts (i.e. recording four magnetic components) deviates from that of underlying brown limestone, which only recorded three magnetic components (compare Fig. 6 with Fig. 3a). Brown limestone clasts and underlying brown limestone share well-grouped PDF and A components (Fig. 4a and b), which clearly suggests these to be secondary magnetizations. The deviating behaviour seen at higher demagnetization levels in the parent lithology and clasts means that evaluating the conglomerate test for the C remanence is impossible at this site.
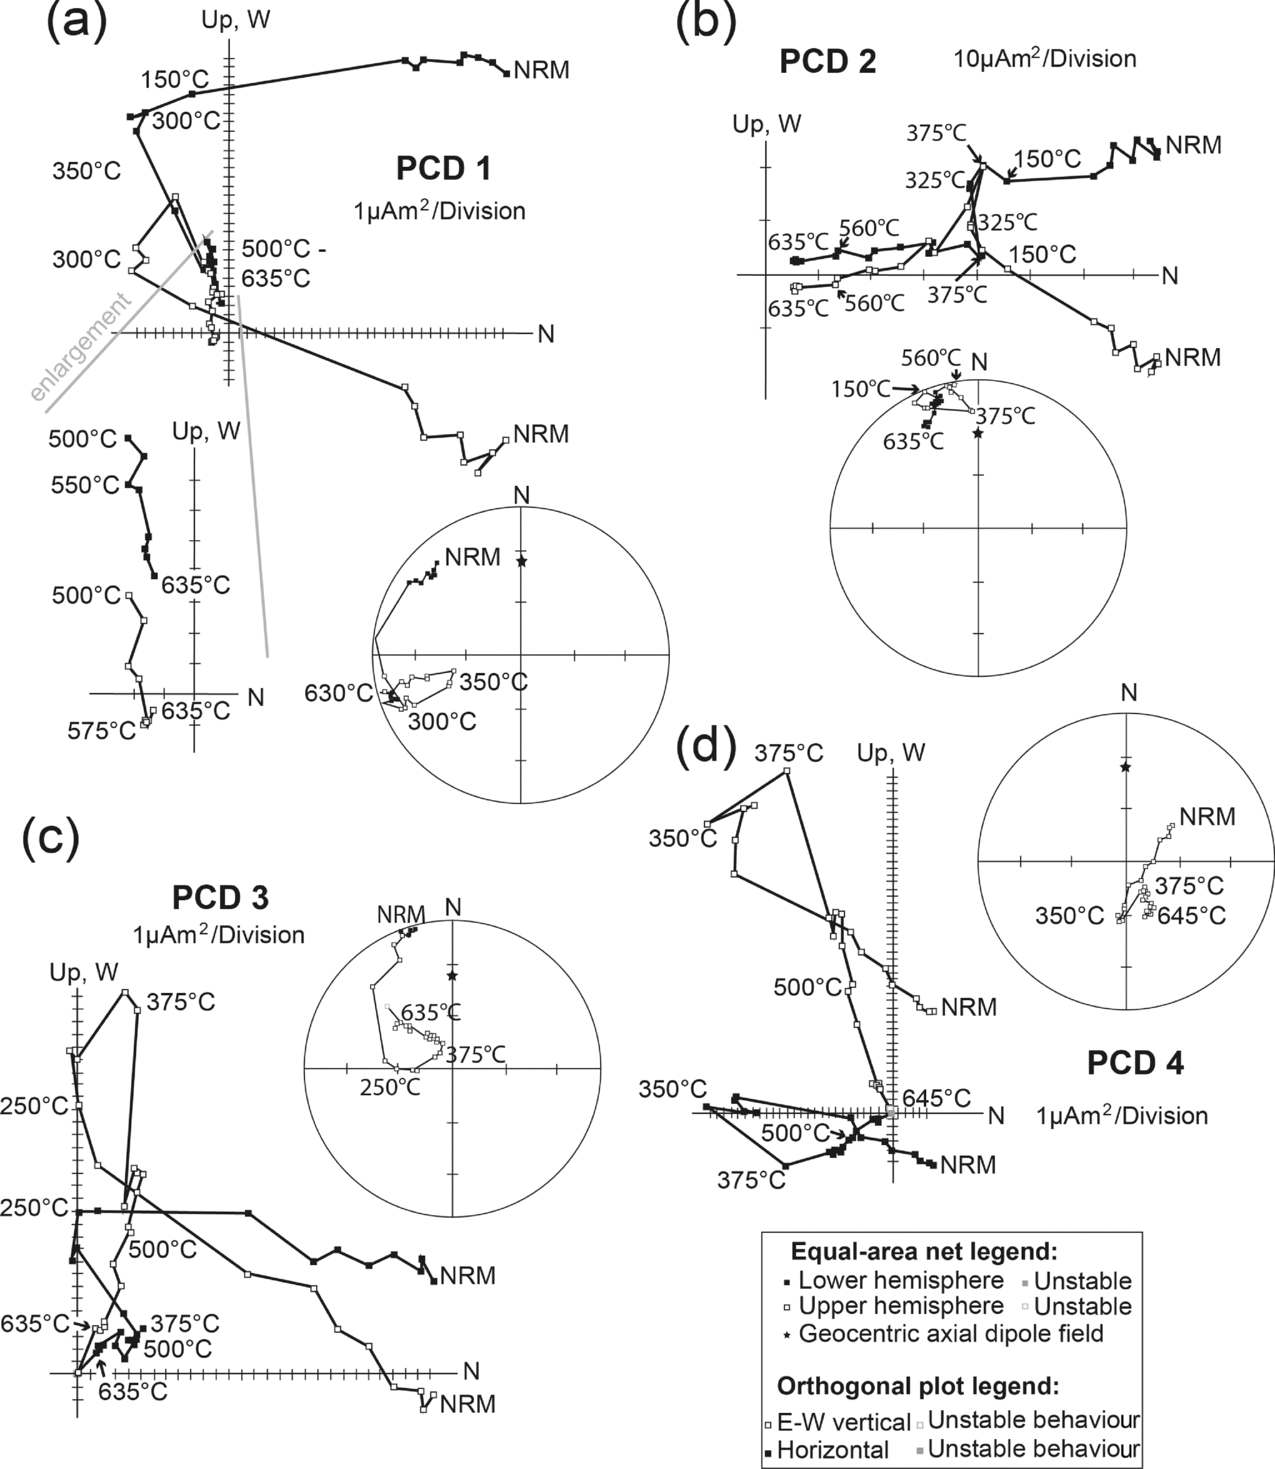
Figure 6. Demagnetization behaviour of four brown limestone clasts from site PCD as orthogonal projection onto the horizontal and E–W vertical planes, as well as on equal-area diagrams (both in geographic coordinates).
At a second site (PCC), 25 large tabular pink limestone clasts from a debris-flow conglomerate within the lower Chanda limestone were sampled (Fig. 2b). In all clasts, northerly downwards components that are near parallel to the Earth's present dipole field unblock when 250°C is reached (Figs 7 and 8b). With the exception of sample PCC 23, all samples display westerly downwards components (i.e. component A) between 250°C and c. 450°C. Above c. 450°C, clasts either display origin-seeking linear trajectories or reach stable end-points of demagnetization that can be quantified by anchoring them to the origin. These characteristic components are widely distributed. All pink limestone clasts therefore display three magnetic components (PDF, A, and a characteristic remanence; Fig. 8b), comparable to the demagnetization behaviour of the parent lithology (compare Fig. 7 with Fig. 3b and c). The PDF and A components are clearly secondary magnetic remanence components, as they form well-grouped clusters in the clasts (Fig. 8b). The characteristic remanence directions, however, are randomly distributed (Watson, Reference Watson1956; Shipunov, Muraviev & Bazhenov, Reference Shipunov, Muraviev and Bazhenov1998). Statistics for these tests are provided in the caption to Figure 8. Furthermore, we were able to measure internal bedding attitudes for 18 of the sampled clasts. When restored to the palaeohorizontal, the characteristic components of these clasts define a narrow small-circle arc of inclination that is statistically indistinguishable from that of component C+/– removed from limestone units immediately below the conglomerate (Fig. 8c). This constitutes a positive intraformational conglomerate test that confirms the primary nature of component C+/–.
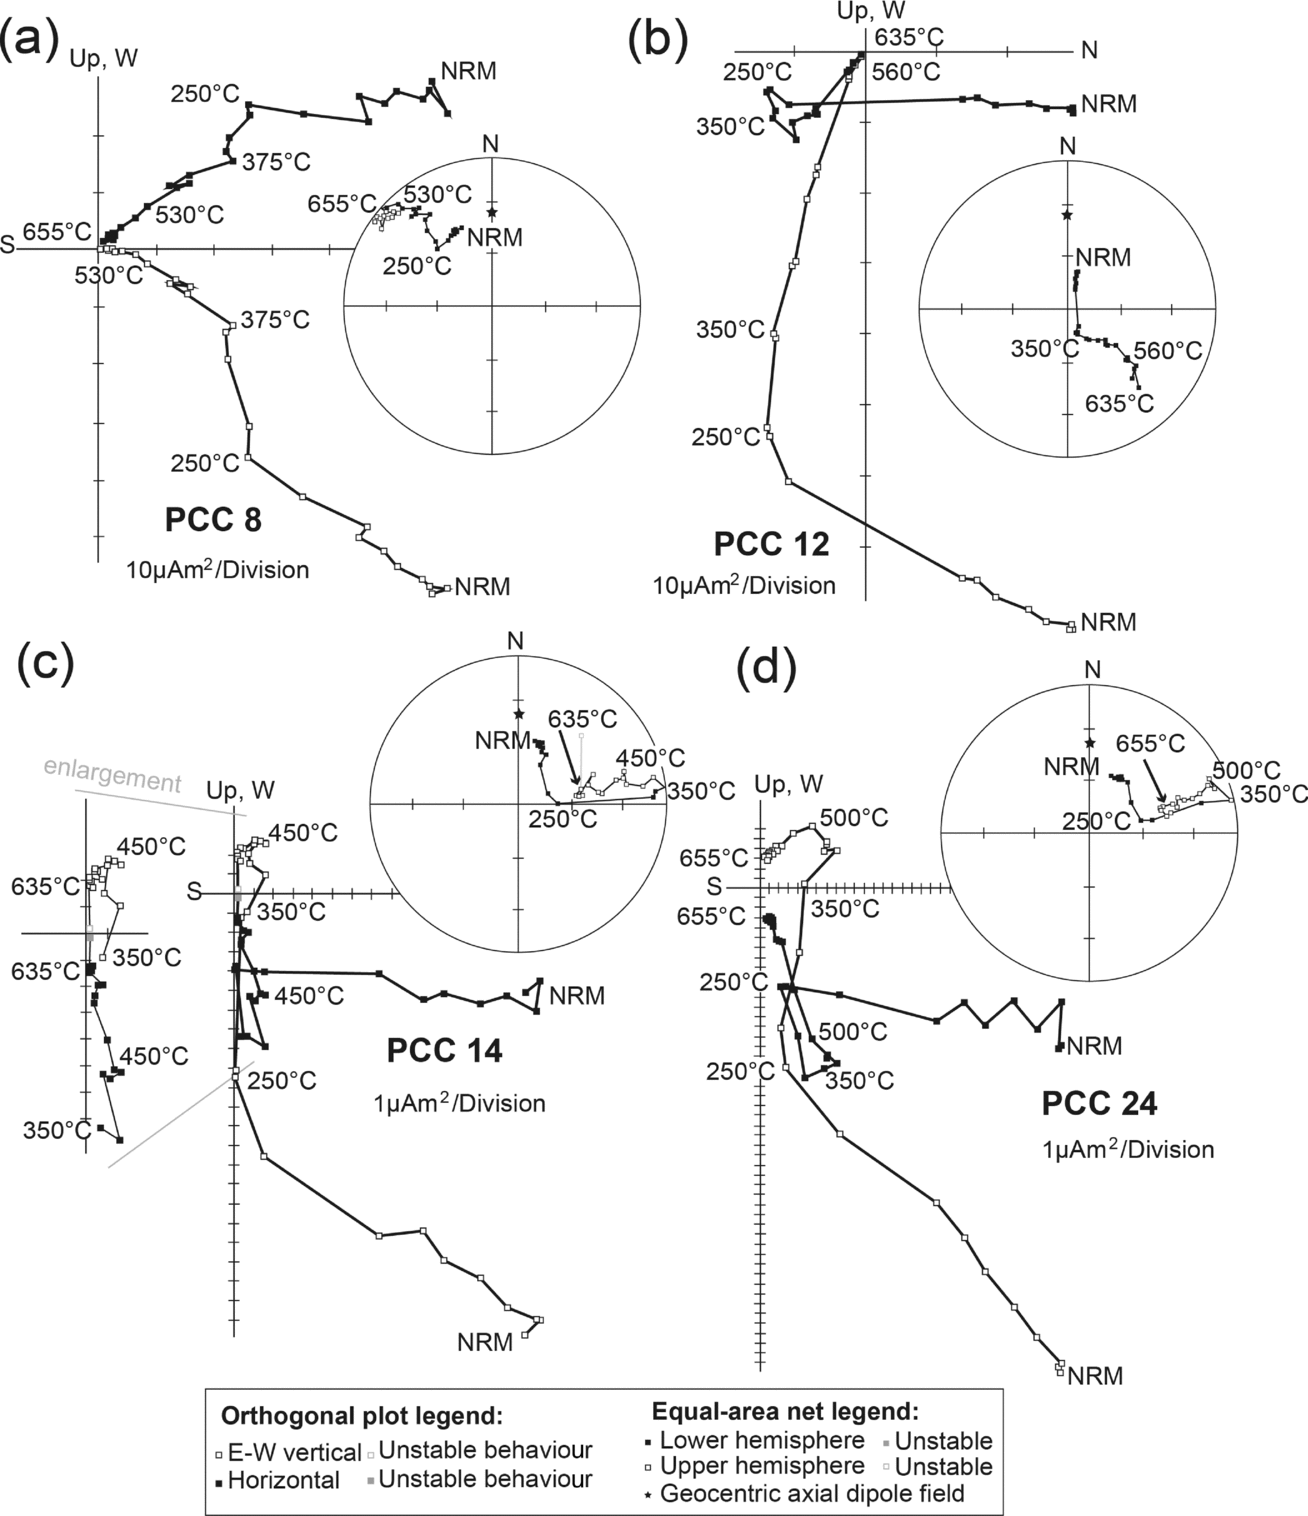
Figure 7. Representative demagnetization behaviour of four pink limestone clasts from site PCC as orthogonal projection onto the horizontal and E–W vertical planes, as well as on equal-area diagrams (both in geographic coordinates).
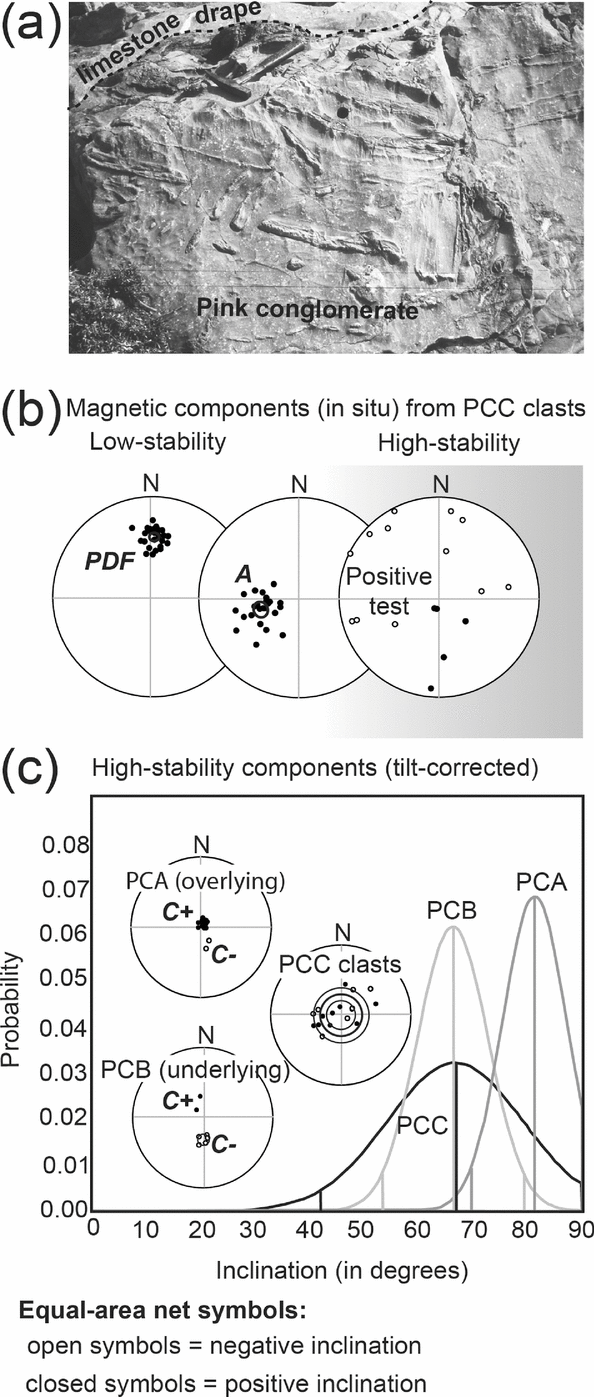
Figure 8. (a) Photograph of the pink limestone debris-flow conglomerate, which is draped by a thin pink limestone bed at site PCC. The geological hammer below the limestone drape serves as a scale (hammer length 35 cm). Three samples were collected from the limestone drape, and 17 samples originate from limestone clasts from the conglomerate. (b) Magnetic components identified in the limestone clasts were well-grouped during lower levels of demagnetization and clearly identifiable as the PDF and A magnetizations. At high-temperature demagnetization steps, randomly distributed characteristic remanence directions were identified from the clasts. The lower-stability PDF and A components clearly post-date conglomerate formation. High-stability components from clasts are random: R = 4.83 < R 0 = 8.07 (Watson, Reference Watson1956); ρ = 0.177 < ρ c = 0.190 (Shipunov et al. Reference Shipunov, Muraviev and Bazhenov1998) with A as the known secondary component. (c) Tilt-corrected high-stability remanance directions for those clasts from site PCC with bedding data fall along a narrow range of inclination values that are not dissimilar from the inclinations of C+/– components seen in the underlying and overlying sites. The probability plot shows that the distribution of inclination from tilt-corrected clasts are statistically indistinguishable from those of remanence directions in limestone underlying the conglomerate (site PCB) at the 95% confidence level, and very similar to those in limestone overlying the conglomerate (site PCA).
4.a.3. Upper Chanda limestone and Sat Nala shale
Brown limestone and reddish shale of the Upper Chanda limestone and the Sat Nala shale samples originate from site PCE, 9 km to the east of sites PCA–PCD, from exposures along the Tintala (site PCF) and Sat Nala (site PCG) rivers c. 2 km north of the town of Chanda (Fig. 2a). Samples from these sites displayed variable behaviour during demagnetization (Fig. 9).

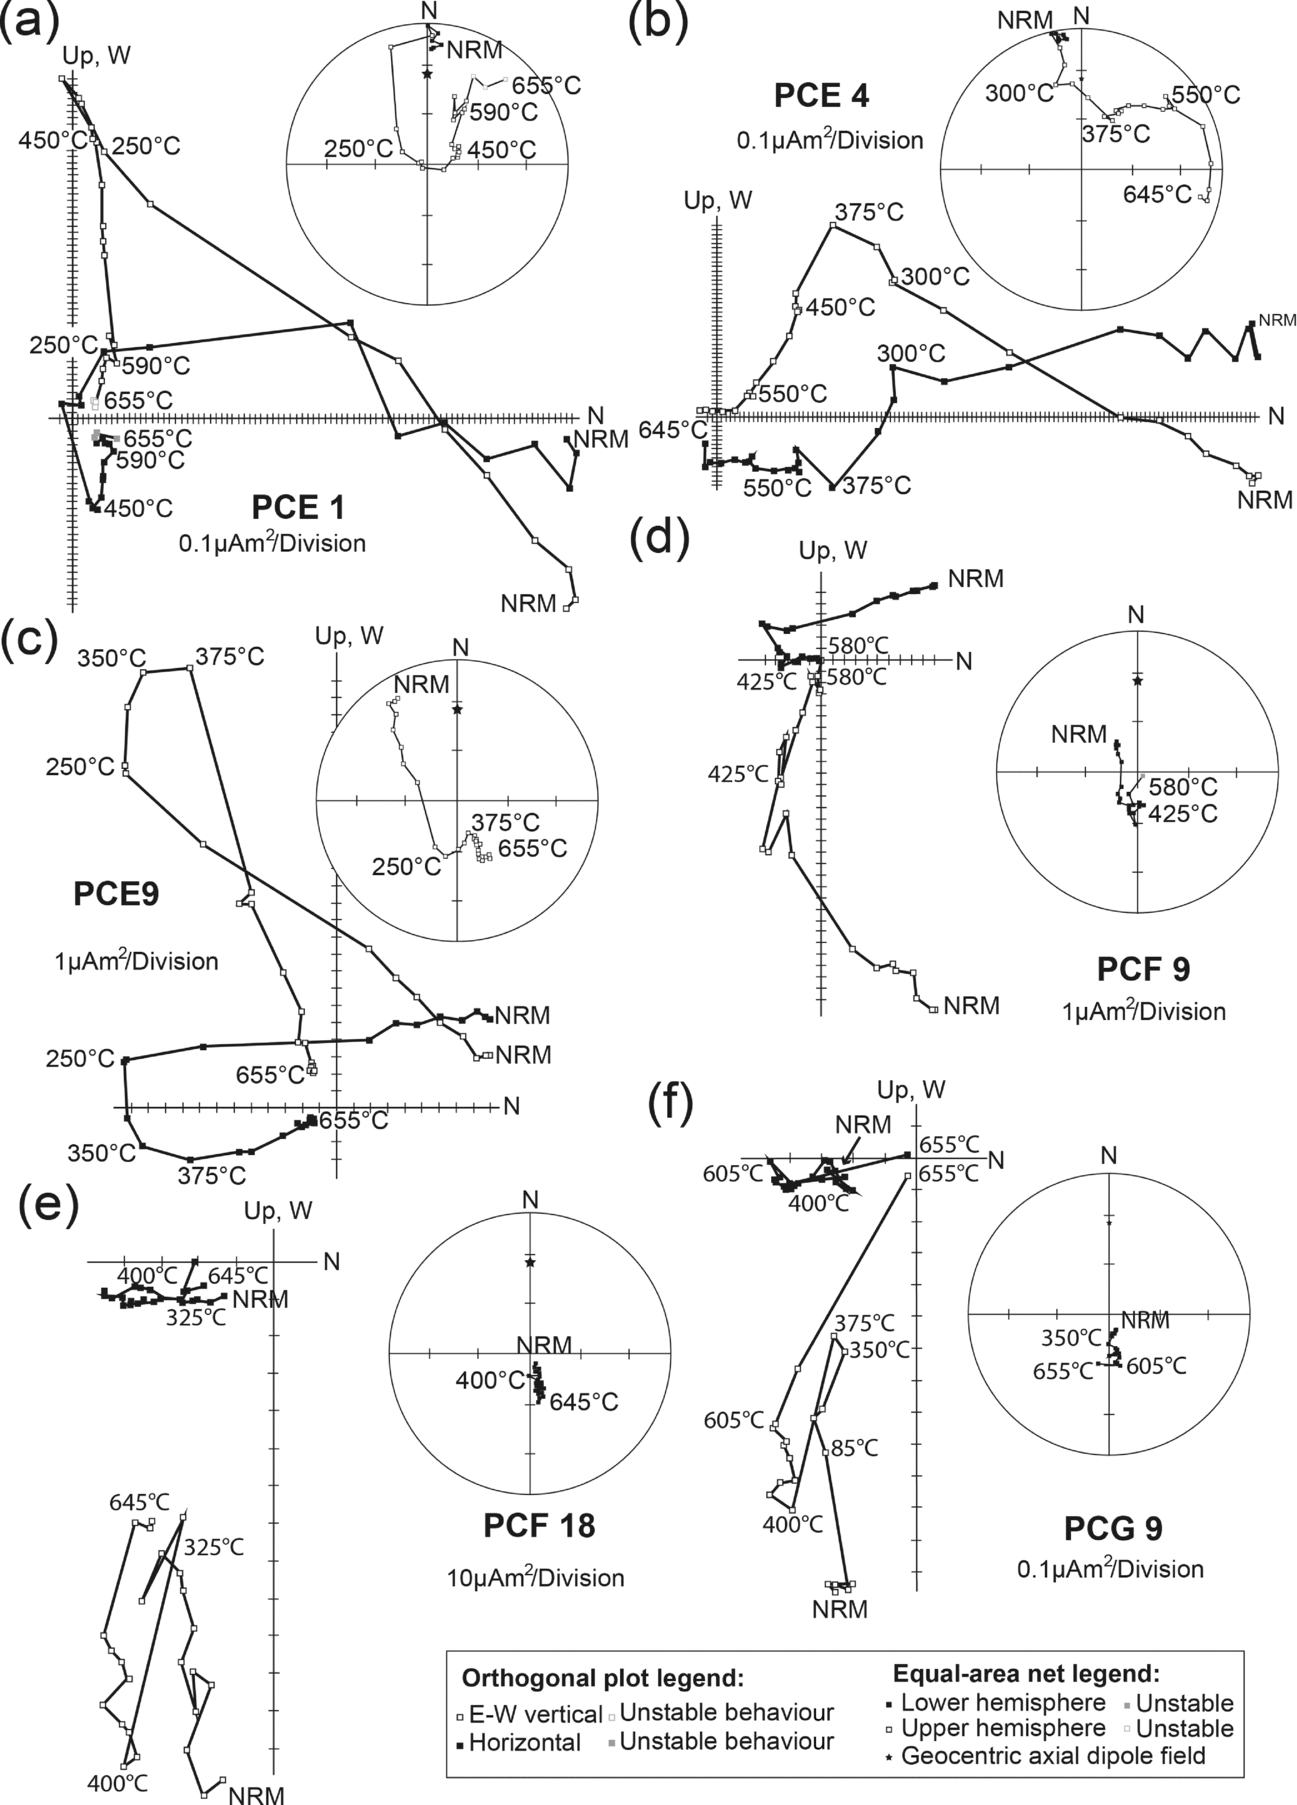
Figure 9. Representative demagnetization behaviour represented in geographic coordinates as orthogonal projection onto the horizontal and E–W vertical planes, as well as on equal-area diagrams of upper brown Chanda limestone samples from site PCE (a–c), upper brown Chanda limestone samples from site PCF (d, e), and reddish Sat Nala shale from site PCG (f).
Remanence in brown limestone samples from site PCE demagnetized along northerly downwards linear trajectories up to 250°C (Fig. 9a–c). These components were parallel to the present dipole field at the locality and to PDF components observed in the lower Chanda limestone (Fig. 4a). Most samples displayed westerly downwards components (similar to component A observed in Section 4.a.1) between 250°C and 375–450°C (Figs 4, 9a and c). Excluded from this is sample PCE 4 (Fig. 9b), where component A is very poorly developed. Above 375–450°C, samples displayed steep southerly and upwards demagnetization trajectories, which either missed the origin in samples PCE 1–7 (up to c. 600°C; Fig. 9a and b), or demagnetized towards the origin in samples PCE 8–11 (up to c. 650°C; Fig. 9c). These components are visually similar to the C– components revealed in the lower Chanda limestone (Fig. 4d). During high-temperature demagnetization steps (i.e. above 600°C), samples PCE 1–7 displayed one or two additional components (Fig. 9a and b). Sample PCE 3, 4, 6 and 7 demagnetized on equal area plots as great-circle arcs first away from C- components towards the present dipole field direction (above 450°C to 600°C), and then towards randomly oriented directions (Fig. 9b). In samples PCE 1, 2, and 5 demagnetization above 450°C followed great-circle arcs away from C– directions to reach stable end-points of demagnetization at randomly oriented directions (Fig. 9a).
PDF components (Fig. 4a) are generally removed below 300°C in brown limestone samples of the upper Chanda limestone from the Tintala River (site PCF), but in some cases had been removed during AF pre-treatment. After removal of the PDF components, 35% of samples display linear origin-seeking trajectories between 325°C and c. 645°C, and are steep southerly and downwards oriented (referred to as ‘B+’, Fig. 4c; e.g. PCF 9; Fig. 9d). The remaining 65% of samples display a poorly constrained northerly upwards directed remanence after the removal of PDF components up to c. 400°C (e.g. PCF3, 15 and 18; see Fig. 9e). These poorly constrained components are referred to as ‘B–’ (Fig. 4c). Above c. 375°C up to c. 645°C, these samples demagnetize as linear origin-seeking trajectories that are steep southerly and downwards oriented (i.e. B+; Fig. 4c).
Reddish shale of site PCG was sampled stratigraphically above site PCF along the Sat Nala River directly north of its confluence with the Tintala River. Samples of the Sat Nala shale all displayed similar behaviour during demagnetization (Fig. 9f). Steep northerly components were removed below c. 375°C, but in some cases these components had already been removed during AF pre-treatment. These components are consistently steeper than the PDF components observed elsewhere and are referred to as ‘D’ (Fig. 4a). Component D is visually similar to the C+ components of other sites but is clearly a lower stability magnetization than C+, and D is clearly carried by different magnetic phase. Between c. 375°C and 425°C, demagnetization of samples follow poorly constrained, upwards, and north-directed linear trajectories that are visually similar to the B– components seen in site PCF (Fig. 4c). Between c. 425°C and 585°C, short linear trajectories that are downwards- and north-directed are revealed. These are nearly parallel to the present dipole field at the locality. Above c. 585°C, samples demagnetize along linear trajectories towards the origin as south- and downwards-directed components that visually resemble the B+ components seen at site PCF (Fig. 4c).
4.a.4. P-G Basin tilt correction
A tilt correction to restore bedding from each site back to the palaeohorizontal was applied to the magnetic components identified in the P-G Basin (Fig. 4). These corrections varied between 36° and 3° about the strike of beds. For the lower Chanda limestone bedding, strike was WNW-directed and dips tended to be steeper (>10°), while bedding strike was more northerly for the upper Chanda limestone and Sat Nala shale. Bedding dip in the upper Chanda limestone and Sat Nala shale tended to be negligible. These varying dips allow the timing of the acquisition of the different magnetic components relative to the regional deformation to be constrained (i.e. a fold test). Regional deformation is believed to be c. 1.0 Ga in age (Deb, Reference Deb2003).
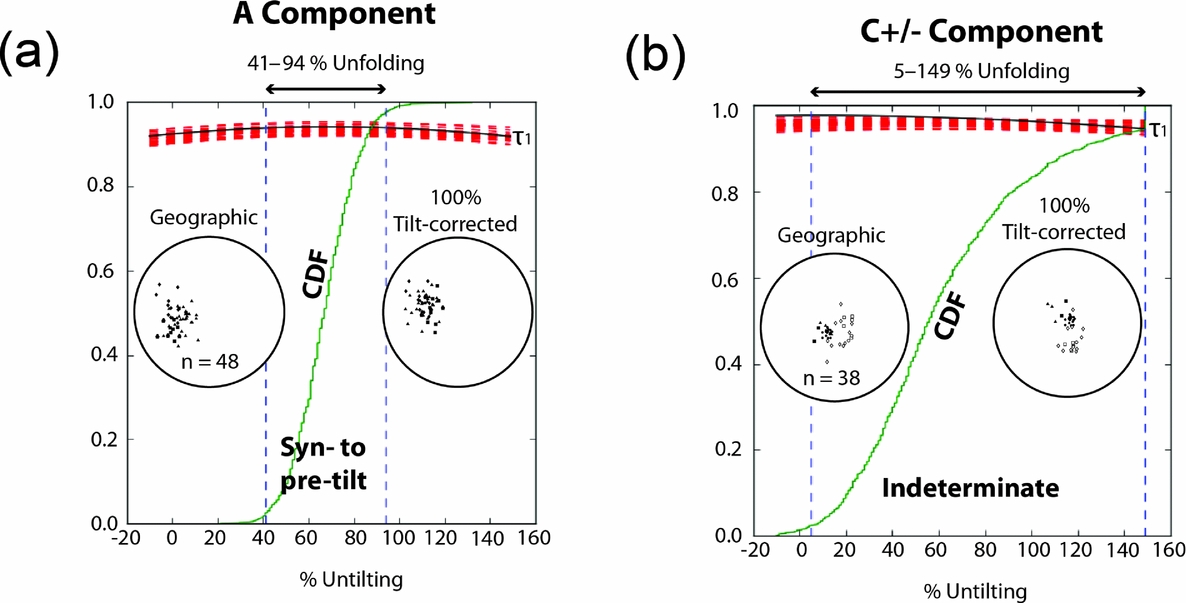
Components B+ and B– display no clear enhanced grouping with or without tilt correction (Fig. 4c), and it is unclear how the timing of their acquisition relate to regional deformation. Component PDF was clearly acquired after regional deformation, based on a better grouping of site means before application of the tilt correction (Fig. 4a). Components A and C+/– both display apparent better clustering after the tilt correction (Fig. 4b and d). However, when the fold test (Tauxe, Kylstra & Constable, Reference Tauxe, Kylstra and Constable1991) is formally evaluated for the C+/– direction, the increase in grouping is shown to be statistically insignificant (i.e. best grouping between 5% and 145% unfolding at the 95% confidence; see Fig. 10a). For the A component, the fold test is more clearly positive with best grouping at 95% confidence achieved between 41% and 94% unfolding (see Fig. 10b). Acquisition of the A component is therefore interpreted to be either associated with or to pre-date regional folding at c. 1.0 Ga. The higher stability nature of component C relative to that of component A, coupled with the increased precision parameter upon tilt correction, mean that we also prefer a pre-folding age for the C+/– components, despite not being able to demonstrate a positive fold test. The timing of C+/– remanence acquisition is again evaluated at a more regional scale in Section 4.d.

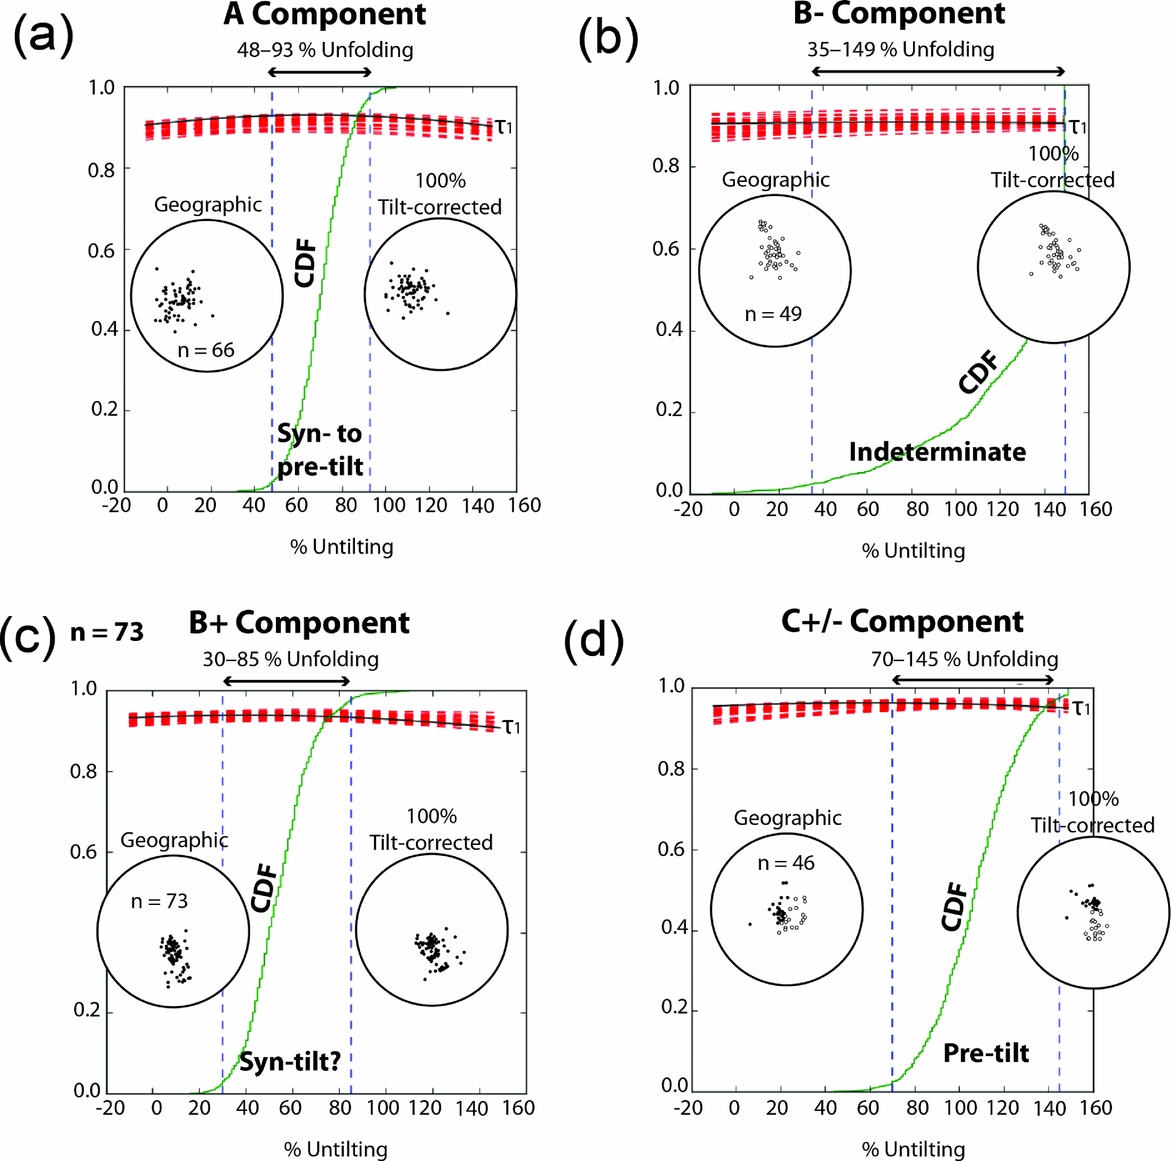
Figure 10. Application of the bootstrap fold test. Equal-area projection of (a) PDF components and (b) C+/– components from the Penganga Group in geographic coordinates and after 100% unfolding. Trends of the largest eigenvalues (τ1) of the orientation matrices from representative pseudo-samples drawn from the PDF and the C+/– components as they evolve during untilting (−20% to 160%) are shown as the components are adjusted for tilt. The largest value of (τ1) occurs between 48 and 93% in all of the pseudo-samples sets drawn from the PDF components, and between 35 and 145% in all of the pseudo-samples sets drawn from the C+/– components. The cumulative distribution (CDF) is of 1000 maxima of τ1 and the bounds that enclose 95% of them.
Taken together with the conglomerate test results, it becomes apparent that component A is a secondary magnetization that was recorded before regional deformation took place. Component C+/–, however, is a primary remanence recorded during or shortly after lithification, but before conglomerate formation. As stated in the previous paragraph it is also likely to pre-date regional deformation, but a clearly positive fold test remains to be demonstrated. Furthermore, the C+/– directions are near antipodal, and become more so upon tilt correction. A bootstrap reversal test (Tauxe, Kylstra & Constable, Reference Tauxe, Kylstra and Constable1991) shows that they are not strictly antipodal however, and we suspect that palaeosecular variation may not have been adequately averaged by one or both of the polarity modes. There can be little doubt that the combined dataset allows for the averaging of palaeosecular variation, however.
4.b. Raipur Group (Chattisgarth Basin)
4.b.1. Sarangarth limestone
Within samples of brown limestone (sites CSB and CSD) and grey limestone (sites CSF), PDF-like components were first to unblock (Figs 11a–c and 12a). They usually did so before 350°C, but at one of the sites (CSB) demagnetization of PDF-like components persisted to 480°C. After PDF removal, more stable components were revealed.
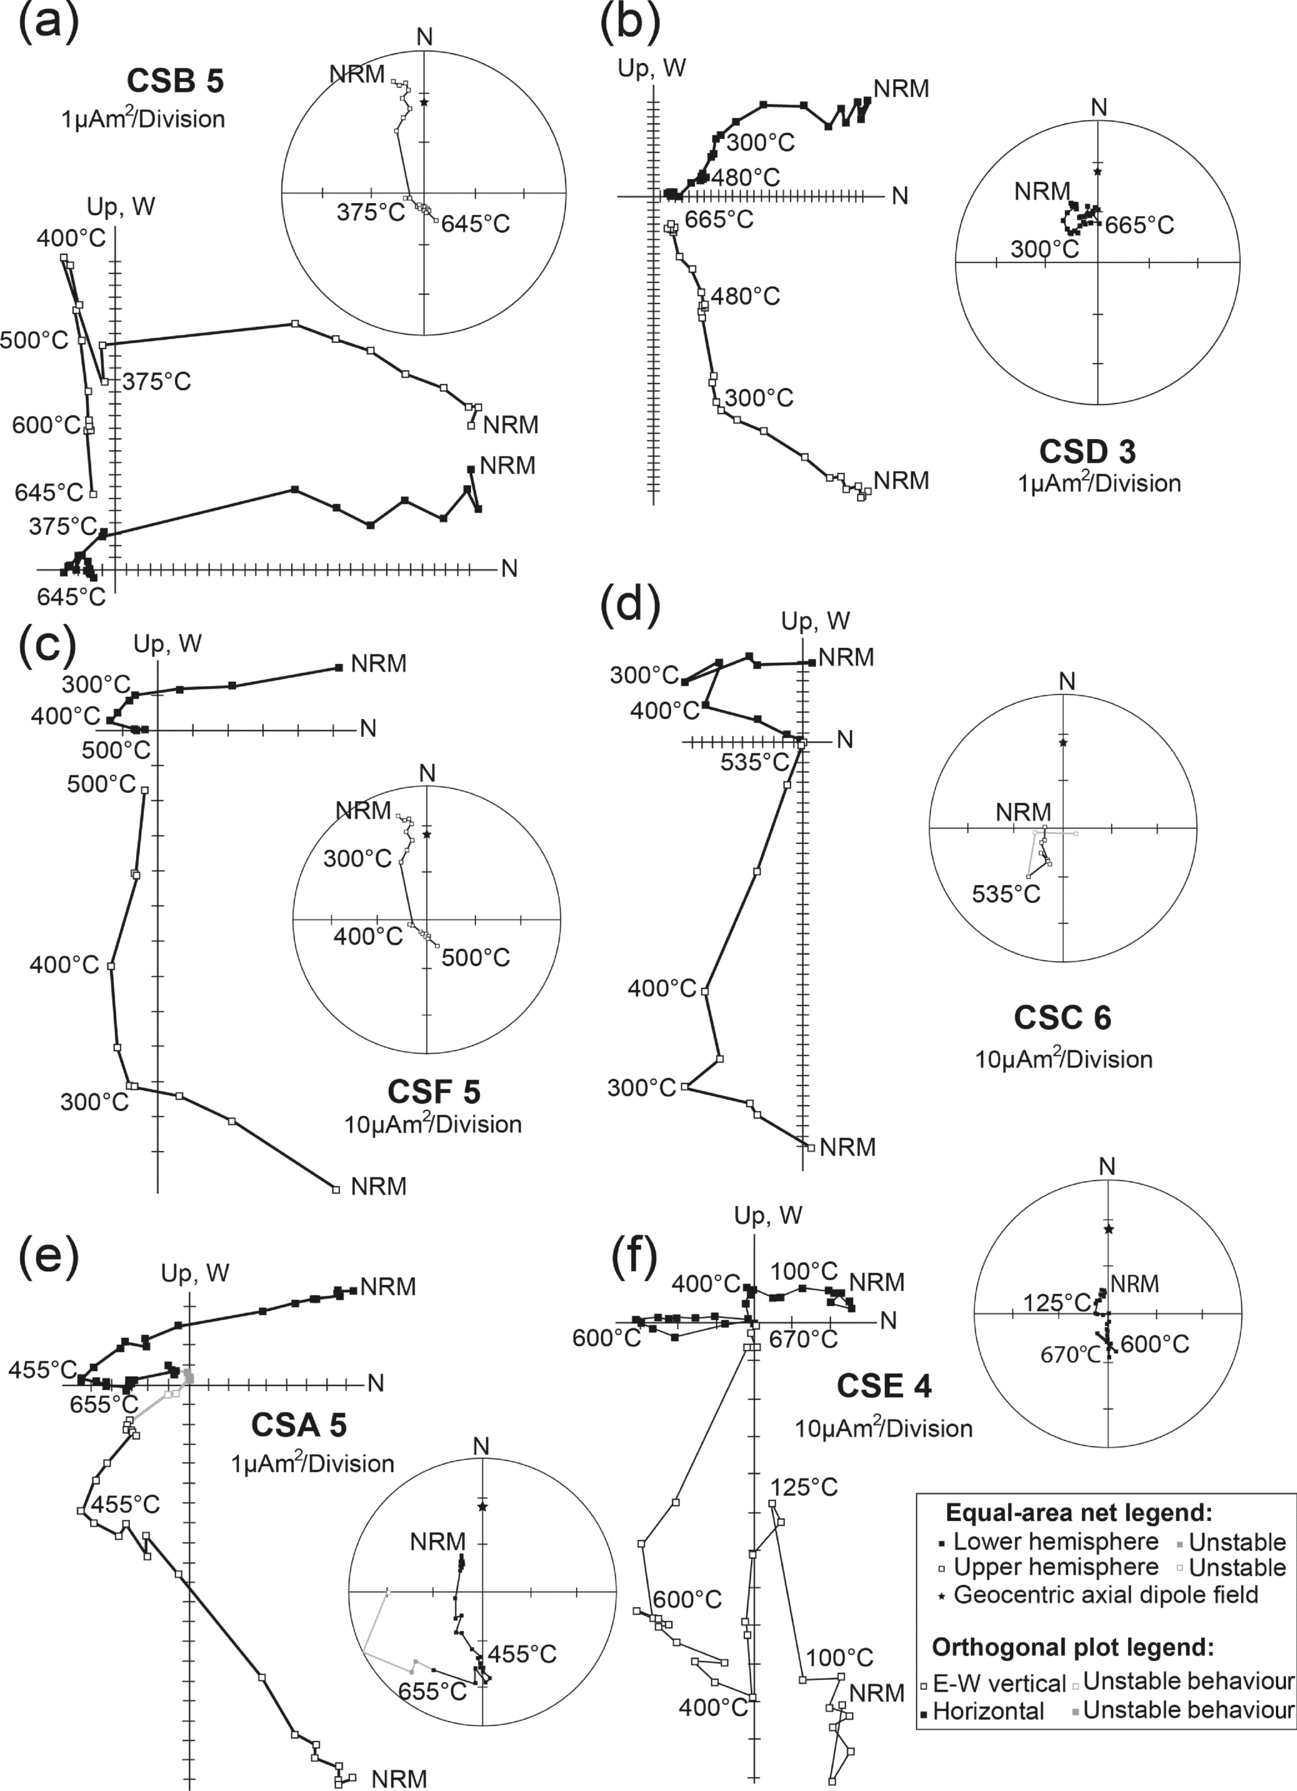
Figure 11. Representative demagnetization behaviour represented as orthogonal projection onto the horizontal and E–W vertical planes, as well as on equal-area diagrams (both in geographic coordinates) of the lower Sarangarth brown limestone from (a) site CSB and (b) site CSD; grey Sarangarth limestone from (c) site CSF and (d) site CSC; and brown limestone from near the base of the Gunderdehi shale at (e) site CSA and (f) site CSE.
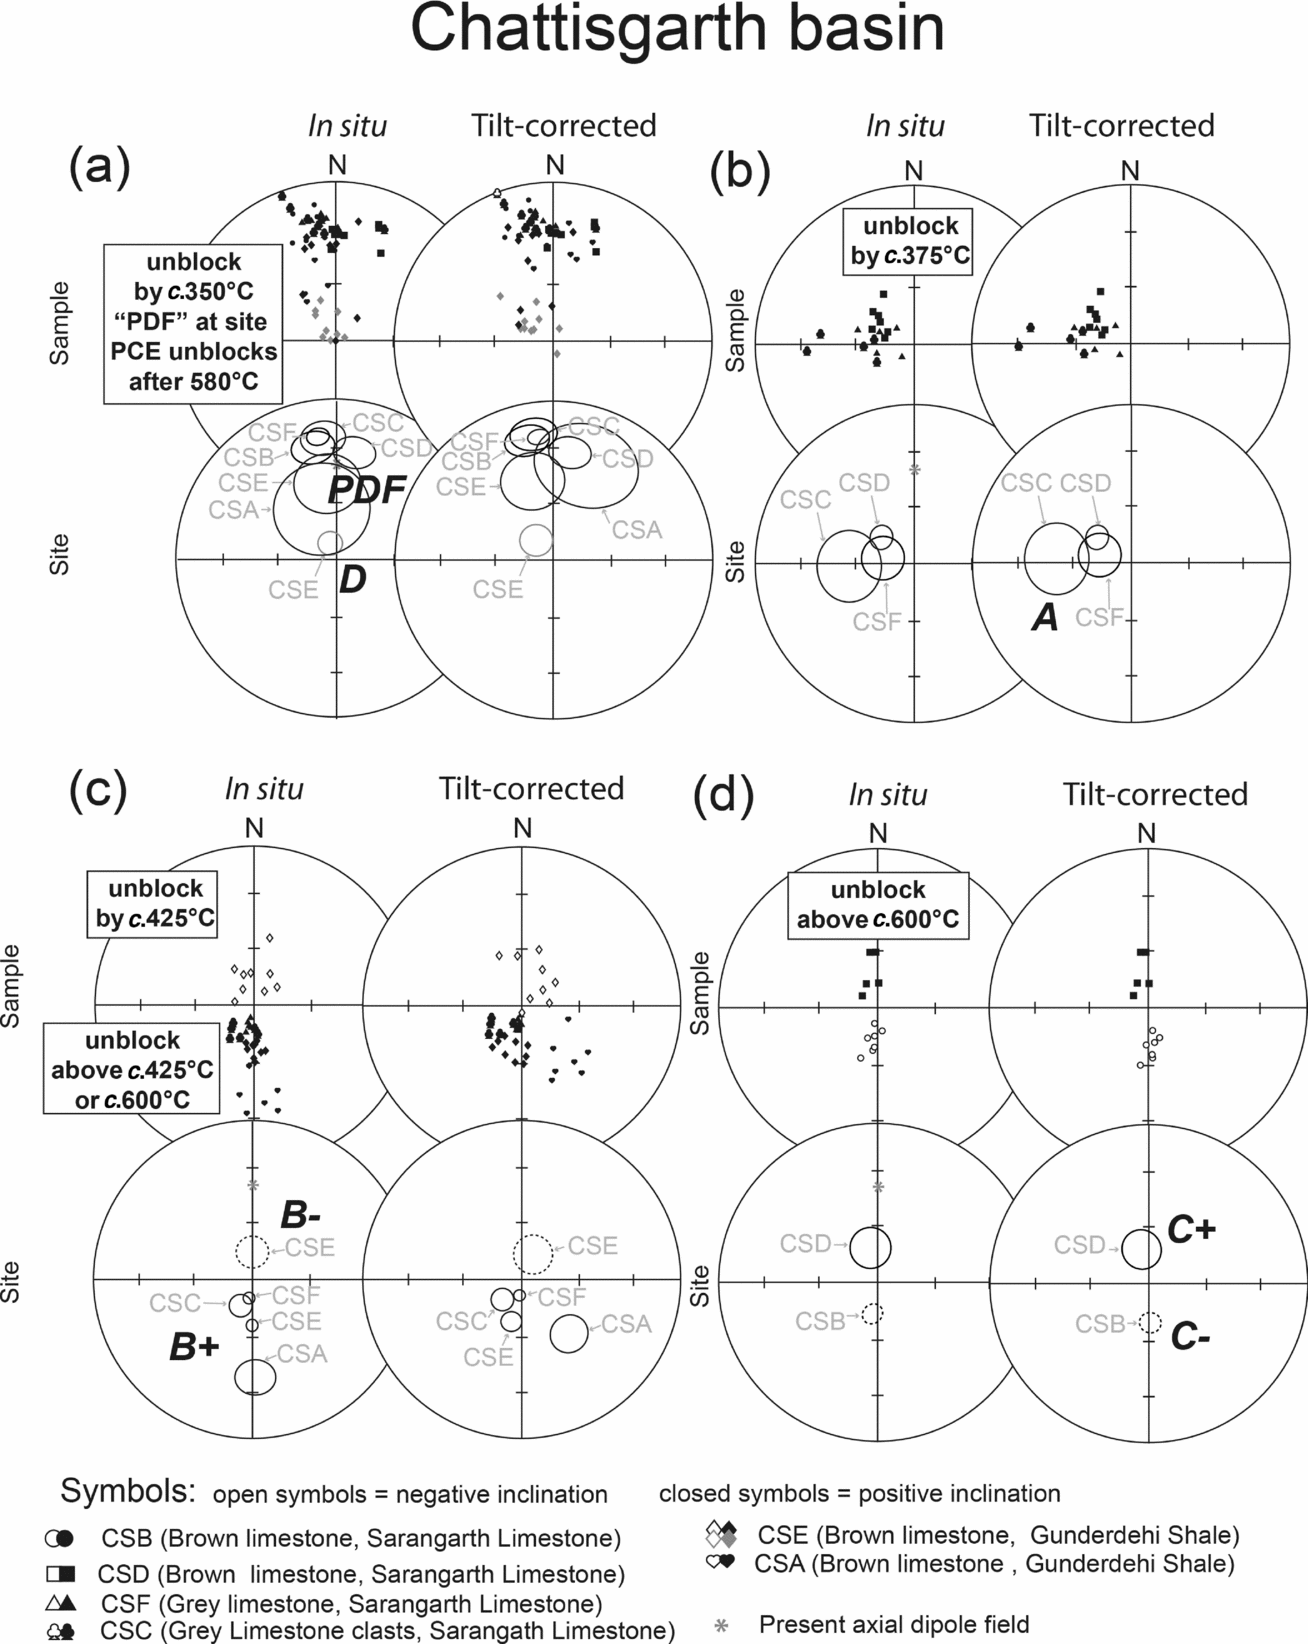
Figure 12. Summary of components and site means for various identified magnetic directions from the Chattisgarth basin. (a) Generally low-stability PDF components and calculated site means are near parallel to the present axial dipole field for India, while component D is a steep low-stability component identified in brown limestone samples of the Gunderdehi shale. (b) Sarangarth limestone samples reveal west- and downwards-directed components (i.e. component A) by c. 375°C. (c) After the removal of PDF components, the upper brown Sarangarth limestone and grey Sarangarth limestone samples display relatively steep upwards- and north-directed (B–) components below c. 375°C, and steep downwards- and south-directed characteristic components (B+) that are stable above c. 600°C. (d) During high-temperature demagnetization steps, lower brown Sarangarth limestone samples reveal either steep downwards- (C+) or upwards-directed (C–) characteristic components, which resolve into two well-grouped antipodal north and south nodes upon tilt correction.
Lower brown limestone samples collected nearer to the base of the Sarangarth limestone (site CSD, Fig. 11b) recorded west-directed components with intermediate to steep inclination after the removal of PDF components (i.e. in the temperature range 350°C to 435°C). The components were not dissimilar to component A identified from the P-G Basin (compare Figs 4b and 12b).
At higher-temperature demagnetization steps (i.e. in the range 480°C/425°C to 665°C), the lower brown limestone of the Sarangarth limestone is characterized by either C– (site CSB) or C+ (site CSD) components (Fig. 11a and b). The two polarity groups from these sites share a common precision, and they only pass the bootstrap reversals test (Tauxe, Kylstra & Constable, Reference Tauxe, Kylstra and Constable1991) after a tilt correction of 5º is applied to restore beds at site CSB to the palaeohorizontal (Fig. 12d). The classic reversals test of McFadden & McElhinny (Reference McFadden and McElhinny1990) also yield a positive class “C” reversals test for the tilt-corrected characteristic components from site CSB and CSD (i.e. two polarity groups share a common precision and y 0 = 3.54° < y c = 10.69°).
Grey limestone samples from site CSF all displayed steep southerly and downward directed components (i.e. B+) above 350°C following the removal of PDF components (Figs 11c and 12c).
4.b.2. Grey limestone clast conglomerate
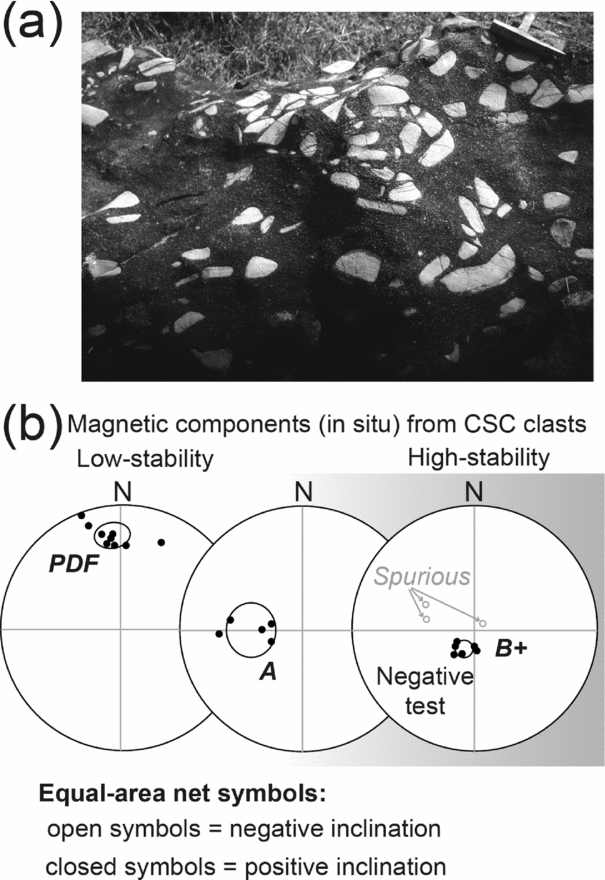
The top of the grey limestone is marked by a very coarse to granular sandstone and conglomerate with rounded to subrounded clasts of grey limestone and black chert (Fig. 13a). Some clasts are very large and up to 2 m in diameter. Nine grey limestone clasts were sampled for a conglomerate test (site CSC). All of the samples displayed well-grouped lower-stability PDF components (Figs 11d and 12a). Five clasts recorded westerly downwards components (A components) during intermediate thermal demagnetization steps (i.e. between c. 300°C and 400°C; see Fig. 13b). Six clasts displayed well-grouped high-stability components recognized as component B+ (Figs 11d, 12c and 13b). The remaining three clasts displayed negatively inclined and more scattered directions upon continued thermal demagnetization up to 570°C, and these are assumed to be spurious (Fig. 13b).

Figure 13. (a) Photograph of grey limestone clasts in a dark sandy matrix of the conglomerate sampled at site CSC. The geological hammer (length of head 15 cm) in the upper right corner serves as a scale. Nine clasts were sampled. (b) Magnetic components identified in the grey limestone clasts are representative of the PDF, A and B+ magnetizations also identified in the parent lithology. All three these magnetizations clearly post-date conglomerate formation.
The grey limestone clasts are therefore characterized by three well-grouped magnetic components (i.e. PDF, A and B+), similar to the grey limestone sampled at site CSF. The conglomerate test is therefore negative for all three of these components. The PDF, A and B+ directions are overprints developed after conglomerate formation.
4.b.3. Gunderdehi shale
Brown limestone samples from near the base of the Gunderdehi shale (Fig. 1b) displayed similar behaviour to the upper Chanda limestone and the Sat Nala shale of the P-G Basin. Brown limestone from site CSA mimic results from site PCF (as they display PDF components at lower levels of demagnetization), while B+ components unblock after 350°C (see Fig. 11e; compare with Fig. 9d). Brown limestone from site CSE mimics results from site PCG, where four components are identified. The first direction to unblock is steep north- and downwards-directed (referred to as D). This is similar to what was seen in the Sat Nala shale of the P-G Basin. Removal of the D components saw B– components unblock between c. 300°C and 400°C (Fig. 11f). A PDF-like component is revealed between c. 400°C and 600°C at higher levels of demagnetization, while a B+ characteristic magnetization is revealed during higher-temperature demagnetization steps (see Fig. 11f; compare with Fig. 9f).
4.c. Indravati Basin
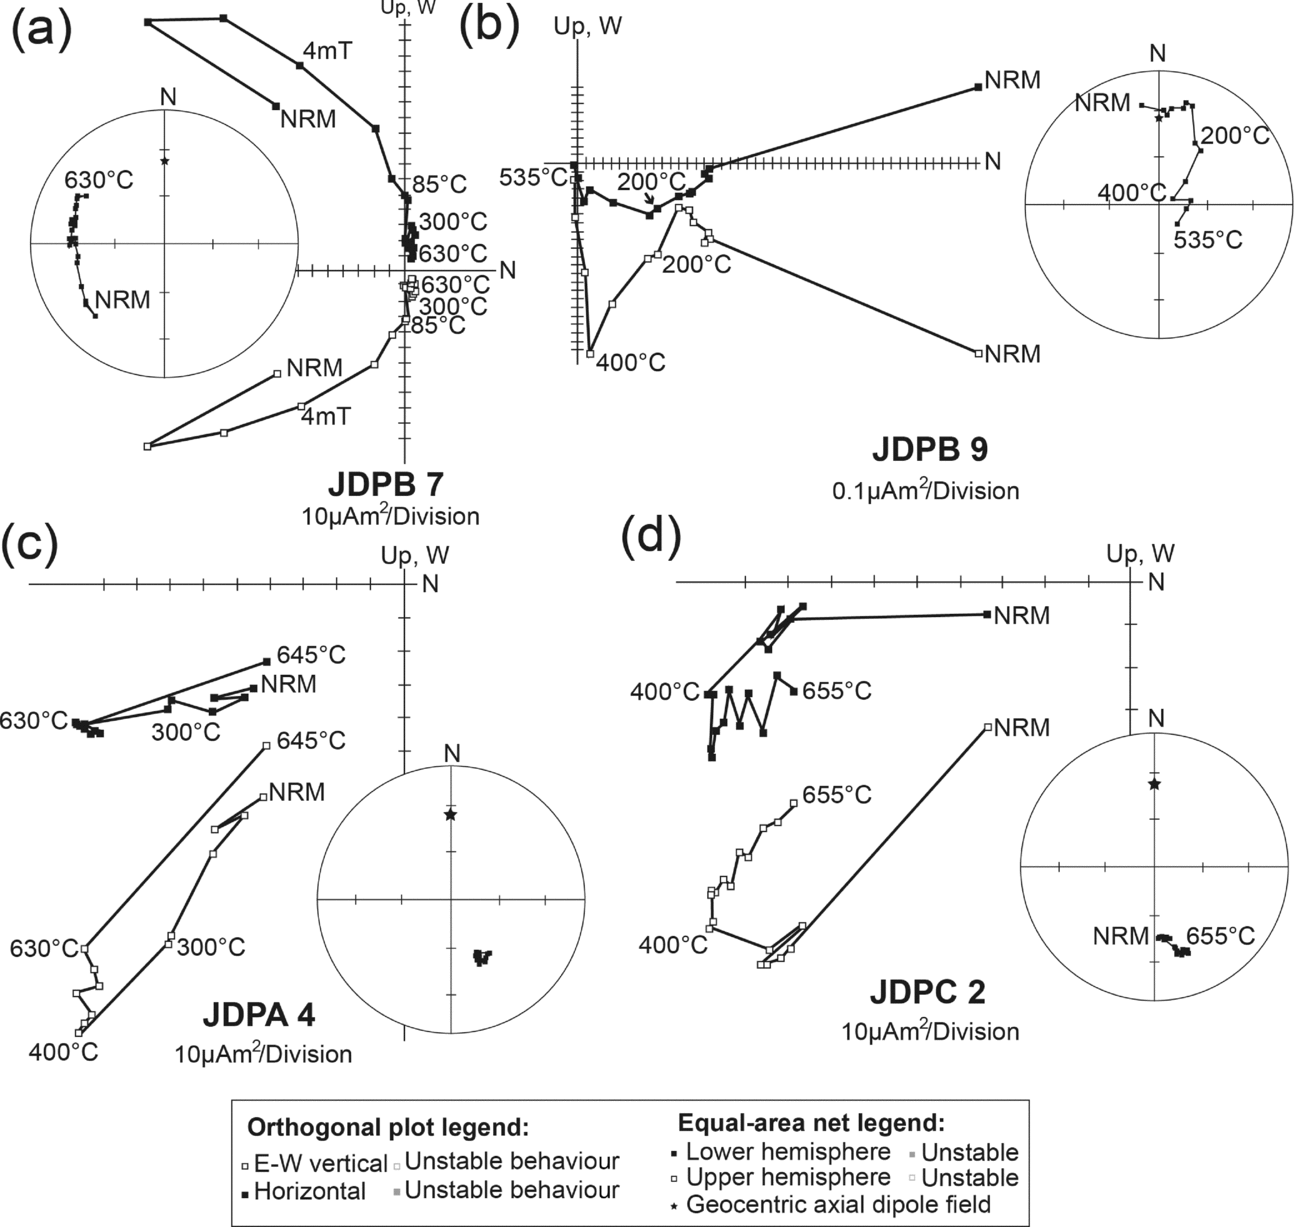
Samples of siliceous limestone of the Kanger Formation (site JDPB, Fig. 1b) did not display within-site consistency among samples during demagnetization, making it impossible to identify geologically significant magnetizations with confidence (Fig. 14a and b).

Figure 14. Representative demagnetization behaviour represented as orthogonal projection onto the horizontal and E–W vertical planes, as well as on equal-area diagrams of the siliceous Kanger limestone of site JDB (a, b), and shale samples from the base of the Jagdalpur Formation at (c) site JDPA and (d) site JDPC.
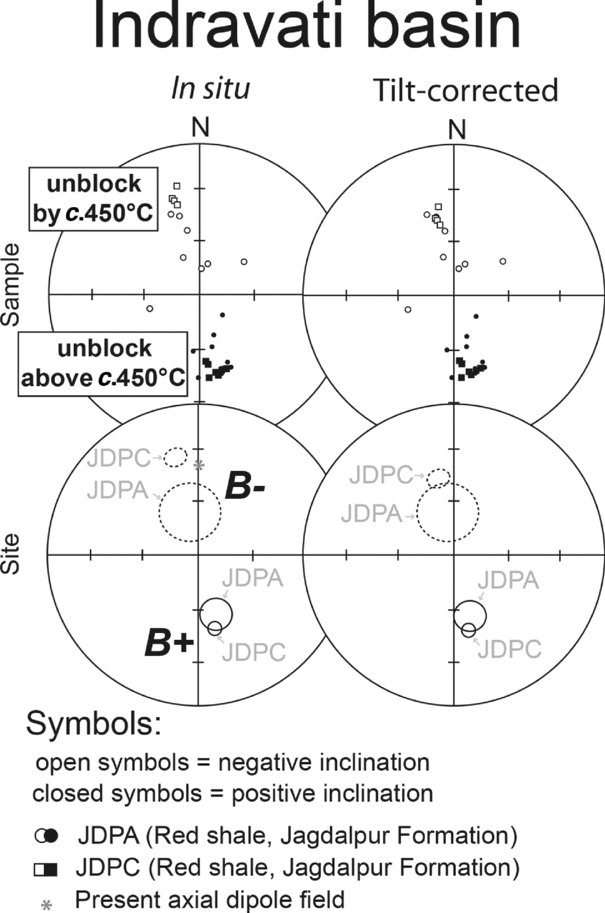
Shale samples from site JDPA and JDPC from near the base of the Jagdalpur Formation preserve two magnetic components (Figs 14c, d and 15). North- and upwards- directed (i.e. B–) components are removed below c. 445°C, while south- and downwards-directed (i.e. B+) characteristic components unblock above c. 445°C and remain stable in some cases up to 675°C.
4.d. Regional fold test
A tilt correction to restore bedding from each site back to the palaeohorizontal was applied to the magnetic components identified regionally in the three sampled basins. The A and C components were only recorded within the P-G and Chattisgarth basins. Application of the bootstrap fold tests of Tauxe, Kylstra & Constable (Reference Tauxe, Kylstra and Constable1991) to the A components from 66 samples originating from 7 sites yields the best grouping at 95% confidence between 46% and 94% unfolding (Fig. 16a). This confirms our earlier inference that acquisition of the A component is associated with or pre-dates regional folding at c. 1.0 Ga.

Figure 15. Summary of B– and B+ magnetic components and site means from the Indravati Basin.

Figure 16. Application of the bootstrap fold test to data from the P-G, Chattisgarth and Indravati basins. Equal-area projection of (a) PDF, (b) B–, (c) B+, and (d) C+/– components identified in this study in geographic coordinates and after 100% unfolding. Trends of the largest eigenvalues (τ1) of the orientation matrices from representative pseudo-samples drawn from these components as they evolve during un-tilting (−20% to 160%) are shown as the components are adjusted for tilt. The cumulative distribution (CDF) is of 1000 maxima of τ1 and the bounds that enclose 95% of them.
For component C (48 samples from 7 sites) the best grouping at 95% confidence is achieved within a small range of unfolding (i.e. 70% and 145%) using the bootstrap fold test (Tauxe, Kylstra & Constable, Reference Tauxe, Kylstra and Constable1991). This result clearly suggests a pre-folding age of remanence acquisition, which we failed to illustrate using only the data from the P-G Basin. As 47% of the C components display negative inclination and 53% of the components display positive inclination, we are able to evaluate the reversals test before and after unfolding (Fig. 16d).
The B– and B+ components were identified from all three basins at five and eight sites, respectively. The B– components were identified from 49 samples from beds that range in dip between the horizontal and 12°. Application of the bootstrap fold test is unsatisfactory with a very broad range for best grouping (35–149%), suggesting that the range in dip is too small to execute the fold test (Fig. 16b).
In contrast to this, the B+ components were identified in 79 samples from beds that range in dip from horizontal to 38°. The bootstrap fold test indicates a syn-folding origin for the B+ component, with the best grouping achieved between 30 and 85% unfolding (Fig. 16c). However, a visual inspection of data clearly shows that B+ components from site CSA (from beds dipping at 38°) result in increased scattering of components when tilt corrected. This, together with the broad range in unfolding resulting in enhanced grouping, leads us to assume a pre-fold age for the acquisition of the B+ remanence.
5. Summary and palaeopole calculation
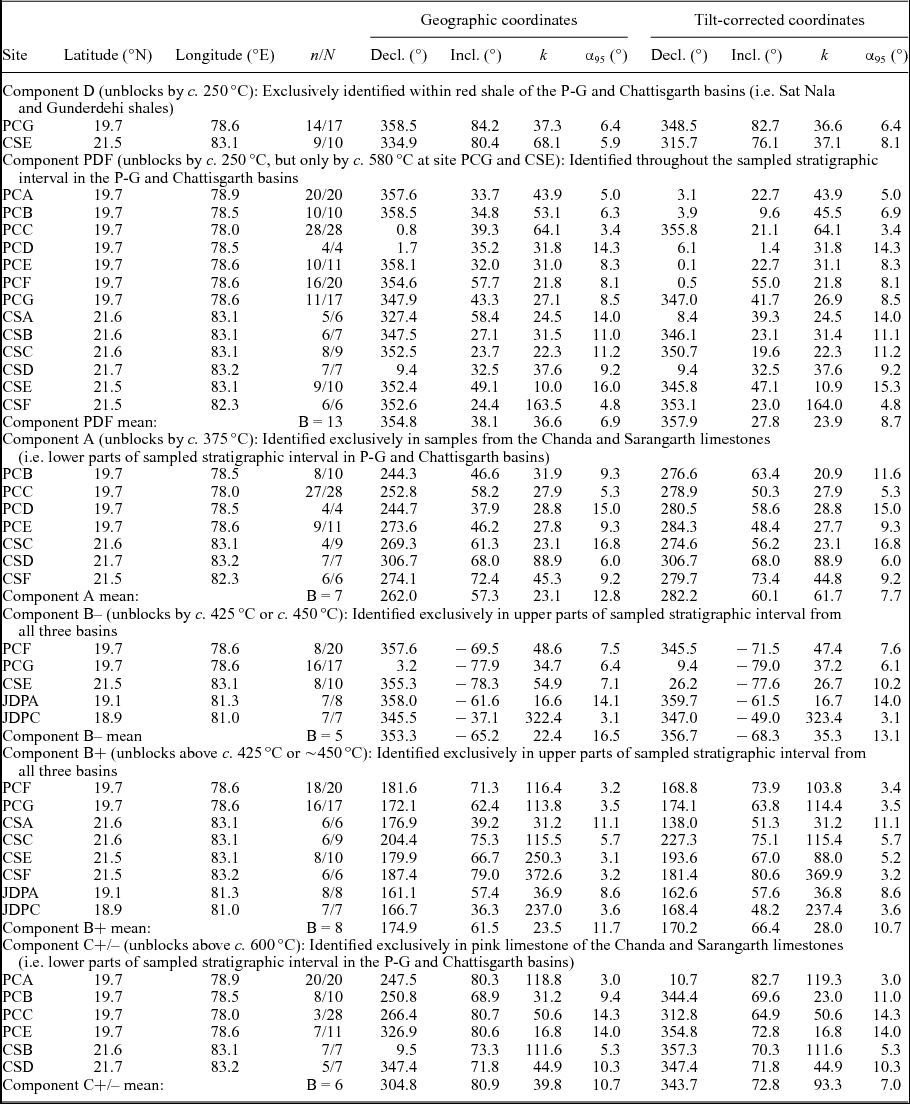
Five geologically significant magnetic directions, two of which are represented by dual polarities, were identified with varying degrees of certainty during this study. These are components PDF, A, B+/–, C+/– and D (see Table 1). Components B– and A are generally poorly resolved compared to components PDF, B+, C+/– and D. Although a maximum of four magnetic directions is present in some samples, the majority of samples only record three and many only record two magnetic directions. There is a general correspondence between the lithology (and, as a result, the stratigraphic level) of a sample and the set of remanence directions recorded. Samples from the predominantly pink limestone from the basal parts of the sampled successions record PDF, A and C+/– components. Samples originating from the brown limestone and reddish shale of the upper stratigraphic levels tend to record D, PDF and B+/– components, but there are of course exceptions to these broad generalizations.
Table 1. Summary of identified magnetic components; 47% of samples display negative inclination and 53% of samples display positive inclination.

n: number of samples included in site mean; N: number of samples collected from site; Decl: magnetic declination; Incl: magnetic inclination; k: precision parameter; α 95: radius of cone with 95% confidence around the mean; B: number of sites included in component mean.
Three of the five directions we identified in this study (i.e. PDF, A and B+) are clear magnetic overprints based upon either poorer groupings that result upon application of tilt corrections to restore bedding planes back to the palaeohorizontal (e.g. PDF) or on negative conglomerate tests (e.g. A and B+). The timing of component D and the less-well-resolved component B– could not be established directly with stability field tests. However, component B– is interpreted to be an overprint based upon its low stability during demagnetization and it being antipodal to the B+ direction. Component D was only observed in red shale, and always as a lower stability magnetization removed by c. 350°C. It does bear some similarity to the high-stability C+ directions but, given the clear difference in magnetic carriers, component D is discarded as a remanence of unknown geological significance.
The fifth component (i.e. component C+/–) is confidently interpreted to be a primary magnetization. This is based upon a positive intraformational conglomerate test from the PG basin and a positive regional fold test. The C+/– component was not identified within the Indravati Basin.
Supporting the primary nature of the C+/– magnetization is its dual polarity nature with stratigraphic constrained polarity groups (25:24 is the ratio of samples of one polarity versus the other). Our sampling spans at least three reversals of the Earth's magnetic field. We were able to illustrate a positive reversals test in the Chattisgarth Basin (Class C), although this proved difficult within the Penganga Group.
Palaeopoles were calculated for the widespread magnetic overprint directions A, B– and B+ (Table 2). The A directions are significantly better grouped among sites following a restoration of bedding back to the palaeohorizontal at the various sites (see Table 1). The corresponding palaeopole (A: latitude 22.8°N, longitude 28.1°E, precision parameter K = 32.0, radius of cone of 95% confidence A 95 = 10.8°) is therefore regarded to pre-date regional deformation. No such clear improvement in grouping is seen for either the B– or B+ directions, and they are both considered to post-date regional deformation. Palaeopoles were calculated for each of these components based on in situ data (B: latitude −19.5°N, longitude 84.3°E, K = 15.3, A 95 = 20.2°; B+: latitude −23.8°N, longitude 84.5°E, K = 16.8, A 95 = 13.9°).
Table 2. Calculated palaeopoles form this study and selected palaeopoles from India used for comparison and in the discussion.
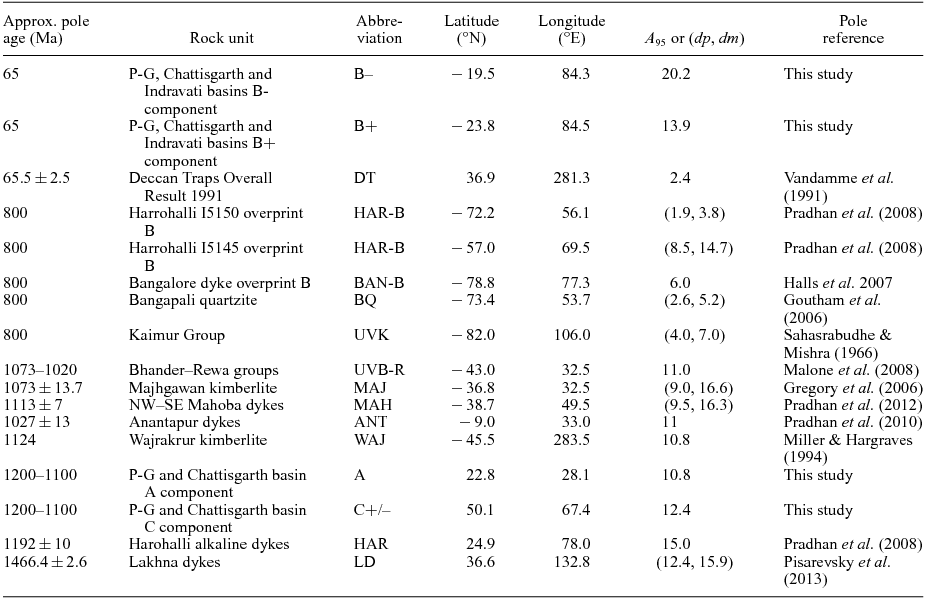
A 95: radius of 95% confidence circle around palaeopole; dp, dm: oval of 95% confidence around the mean pole.
A palaeopole was also calculated for the primary C+/– directions (Table 2). We excluded directional means from specific localities when the confidence (α 95) values were larger than 16.00° and when the precision (k) values were less than 10.00. There is a dramatic visual and statistical improvement in the grouping of C+/– directions among sites after bedding at the various sites are restored back to palaeohorizontal (k value increases from 39.8 to 93.3 upon tilt correction). As for overprint A, the C+/– palaeopole was calculated for the tilt-corrected data as the magnetization is interpreted to pre-date regional deformation (C+/–: latitude 50.1°N, longitude 67.4°E, K = 30.1, A 95 = 12.4°).
6. Discussion
6.a. Timing of magnetization
Deformation in the P-G Basin is related to the Grenvillian Orogeny as recorded in the Eastern Ghats mobile belt (Deb, Reference Deb2003). To investigate the timing of acquisition magnetizations that pre-date this regional deformation, we undertook a comparison with palaeopoles from cratonic India for the time interval from 1600 Ma to 850 Ma (i.e. spanning the Mesoproterozoic and early Neoproterozoic).
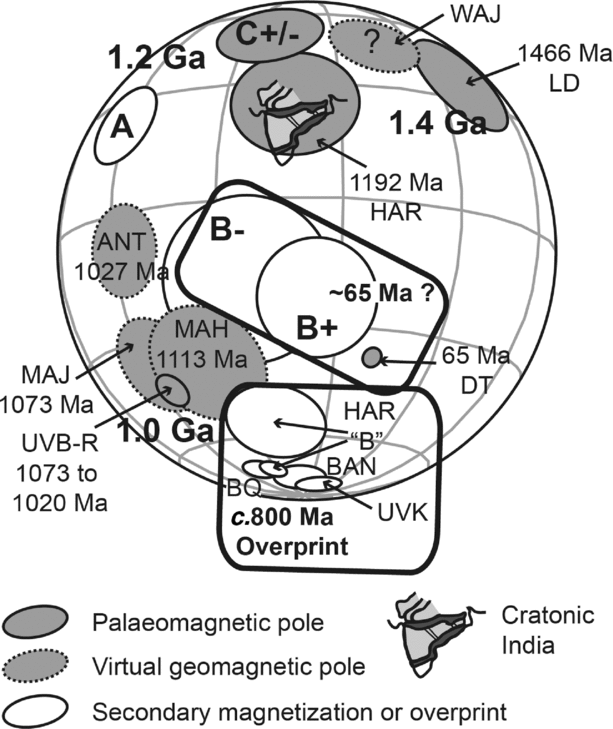
Between 1600 Ma and 850 Ma, Indian palaeogeography is constrained by a few poles that are reviewed here (Table 2 and Fig. 17). The earliest reliable pole in this time interval is the 1466.4±2.6 Ma Lakhna dykes pole from the Bastar craton (recently determined by Pisarevsky et al. Reference Pisarevsky, Biswal, Wang, Waele, Ernst, Söderlund, Tait, Ratre, Singh and Cleve2013). Although the age of this pole is unconstrained by stability field tests, it is considered to be primary by Pisarevsky et al. (Reference Pisarevsky, Biswal, Wang, Waele, Ernst, Söderlund, Tait, Ratre, Singh and Cleve2013) based on the dual polarity nature of the magnetization. Dual polarities are observed among dykes, but never from the same dyke (Pisarevsky et al. Reference Pisarevsky, Biswal, Wang, Waele, Ernst, Söderlund, Tait, Ratre, Singh and Cleve2013).

Figure 17. Palaeopoles from this study in relation to selected Indian palaeopoles (see Table 2 for abbreviations). The outlines of cratonic India and the Indian subcontinent are shown for reference.
At 1.2 Ga, India is considered to have occupied a high-latitude position (Fig. 15) based on the 1192±10 Ma age for the N–S-trending Harohalli alkaline dyke swarm pole (Pradhan, Pandit & Meert, Reference Pradhan, Pandit, Meert, Srivastava, Sivaji and Rao2008). This palaeomagnetic pole is based on ten dykes, and includes the previously published results of Dawson & Hargraves (Reference Dawson and Hargraves1994) and Radhakrishna & Mathew (Reference Radhakrishna and Mathew1996). Of the ten dykes, eight recorded positive inclination and two dykes recorded negative inclination (Pradhan, Pandit & Meert, Reference Pradhan, Pandit, Meert, Srivastava, Sivaji and Rao2008). The dual polarity of the magnetization observed among the sampled dykes supports the primary nature of the magnetization, but it should be kept in mind that the dated dyke did not yield consistent palaeomagnetic directions (Pradhan, Pandit & Meert, Reference Pradhan, Pandit, Meert, Srivastava, Sivaji and Rao2008) and the dykes that did yield good palaeomagnetic results were not dated.
The Wajrakrur kimberlite virtual geomagnetic pole (VGP) of Miller & Hargraves (Reference Miller and Hargraves1994), which is based on two sampling sites without any stability field tests, also defines a high-latitude position for India. The c. 1.1 Ga ages from this kimberlite field are based on U–Pb perovskite and Rb–Sr phlogopite ages (Kumar, Heaman & Manikyamba, Reference Kumar, Heaman and Manikyamba2007) and are considered robust, but the high-latitude position for India at c. 1.1 Ga is regarded as suspect (Fig. 17). The reason for this is that a VGP from the similarly aged (i.e. U–Pb zircon age of 1113±7 Ma) ENE–WSW-trending Mahoba dykes of the Bundelkhand craton yielded a much lower palaeolatitude (Pradhan et al. Reference Pradhan, Meert, Pandit, Kamenov and Mondal2012). This lower palaeolatitude position at 1.1 Ga is further supported by the 1073.5±13.7 Ma 39Ar/40Ar phlogopite age for the Majhgawan kimberlite VGP (Gregory et al. Reference Gregory, Meert, Pradhan, Pandit, Tamrat and Malone2006), which includes earlier results by Miller & Hargraves (Reference Miller and Hargraves1994) (Fig. 17). Furthermore, palaeomagnetic results from the NW–SE-trending Anantapur dykes, dated by U–Pb zircon to 1027.2±13 Ma (Pradhan et al. Reference Pradhan, Meert, Pandit, Kamenov, Gregory and Malone2010), were combined by Pradhan et al. (Reference Pradhan, Meert, Pandit, Kamenov, Gregory and Malone2010) to yield a VGP that is similar to that of the Majhgawan kimberlite (Fig. 17). A similar palaeomagnetic pole from the Bander and Rewa groups of the Upper Vindhyan (Fig. 17), combined with a youngest detrital zircon population age of c. 1020 Ma determined by Malone et al. (Reference Malone, Meert, Banerjee, Pandit, Tamrat, Kamenov, Pradhan and Sohl2008), allowed these authors to further support the proposal by Gregory et al. (Reference Gregory, Meert, Pradhan, Pandit, Tamrat and Malone2006) that basin closure in the Upper Vindhyan occurred at c. 1.0 Ga.
A relatively old study on the poorly dated Upper Vindhyan Kaimur Group (Sahasrabudhe & Mishra, Reference Sahasrabudhe and Mishra1966) may be representative of a <1000 Ma magnetic overprint. The age of the Kaimur Group is constrained between 1602 Ma and 1073 Ma, the age from the Semri Group (Lower Vindhyan) stratigraphically below (Rasmussen et al. Reference Rasmussen, Bose, Sarkar, Banerjee, Fletcher and McNaughton2002) and the age of the Majhgawan kimberlite that intrude the Kaimur Group (Kumar, Heaman & Manikyamba, Reference Kumar, Heaman and Manikyamba2007). The <1000 Ma age for the magnetization is based on the similarity between the Kaimur Group pole (Fig. 17) and the shallow north-directed overprint from the Harohalli dyke swarm (Pradhan, Pandit & Meert, Reference Pradhan, Pandit, Meert, Srivastava, Sivaji and Rao2008) and Bangalore dyke swarm (Halls et al. Reference Halls, Kumar, Srinivasan and Hamilton2007). This overprint pole is considered to be related to alteration at c. 800 Ma, but it may also represent alteration at c. 550 Ma or near-present-day conditions (Deb, Reference Deb2003; Halls et al. Reference Halls, Kumar, Srinivasan and Hamilton2007).
Finally, the <1124 Ma Bangapali quartzite (Kurnool Group) of the Cuddapah Basin (Goutham et al. Reference Goutham, Raghubabu, Prasad, Subba Rao and Damodara Reddy2006), as for the Upper Vindhyan Kaimur Group pole, also displays similarity to the <1000 Ma shallow north-directed overprint from the Harohalli dyke swarm (Pradhan, Pandit & Meert, Reference Pradhan, Pandit, Meert, Srivastava, Sivaji and Rao2008) and Bangalore dyke swarm (Halls et al. Reference Halls, Kumar, Srinivasan and Hamilton2007) (Fig. 17).
Our C+/– palaeopole overlaps with the 1.19 Ga pole from the Harohalli dykes of the Dharwar craton, while being significantly different from the 1.4 Ga Lakhna dykes pole and the various c. 1.0 Ga poles (Fig. 17). This suggests a c. 1.2 Ga age for the deposition of the stratigraphically lower parts of the Chanda and Sarangarth limestones in the P-G and Chattisgarth basins.
The pole calculated for the component A overprint direction of this study lies between the 1.2 Ga and 1.0 Ga Indian poles (Fig. 17). This position does not contradict the expectation for a secondary magnetization that pre-dates the c. 1.0 Ga deformation, and is supportive of an early diagenetic origin for the magnetization.
Our B+/– overprint directions display no conclusive enhanced or worsening of grouping during tilt correction (see Section 5), but these components appear to post-date the c. 1.0 Ga deformation as they plot disparate from the 1.4–0.8 Ga Indian poles (Fig. 17). They do share some similarity with the 65 Ma Deccan Traps palaeopole of Vandamme et al. (Reference Vandamme, Courtillot, Besse and Montigny1991), however; this is particularly true for the better-constrained B+ direction pole (Fig. 17). The B– and B+ directions are therefore cautiously regarded as secondary magnetizations, acquired preferentially by the brown limestone and red shale of the Purana basins during the extrusion of the voluminous Deccan Traps.
6.b. P-G and Chattisgarth basin age and correlation
The C+/– palaeopole obtained from the Penganga and Raipur groups (P-G and Chattisgarth basins) is clearly different from the c. 1.4 Ga and various c. 1.0 Ga palaeopoles of cratonic India, but it does overlaps with the less-well-constrained 1.19 Ga pole from the Harohalli dykes of the Dharwar craton. This palaeopole comparison reveals that the lower parts of the P-G and Chattisgarth basins were deposited largely in the Stenian period of the Mesoproterozoic era, confirming existing age constraints. In particular, the deposition of the Chanda limestone of the Penganga Group (P-G Basin) is probably close to c. 1200 Ma, as suggested by Conrad et al. (Reference Conrad, Hein, Chaudhuri, Patranabis-Deb, Mukhopadhyay, Deb and Beukes2011). Based on the similar palaeomagnetic signatures, deposition of the Sarangarth limestone of the Raipur Group (Chattisgarth Basin) occurred around the same time. This is significantly later than suggested by the 1405±9 Ma U–Pb detrital ziron age (Bickford et al. Reference Bickford, Basu, Patranabis-Deb, Dhang and Schieber2011) reported from below the Raipur Group and the 1565±6 Ma 39Ar/40Ar glauconite age (Conrad et al. Reference Conrad, Hein, Chaudhuri, Patranabis-Deb, Mukhopadhyay, Deb and Beukes2011) reported from below the Penganga Group.
The stratigraphically upper parts of the Penganga and Raipur groups are predominantly composed of brown limestone and red shale, which appear to have been preferentially remagnetized at some point after c. 1.0 Ga (possibly during Cretaceous time with the extrusion of the Deccan Traps).
The end of deposition of the Raipur Group is however constrained at c. 1.0 Ga based on ages determined near the top of the succession. Deposition of the Raipur Group therefore spanned most of the Stenian period (i.e. some 200 million years of the Mesoproterozoic era).
As no primary magnetization could be identified from the Indravati Basin, its age and correlation to the other Purana basins remain an enigma.
7. Conclusion
A new primary palaeomagnetic pole from the late Mesoproterozoic P-G and Chattisgarth basins of India are reported here together with a late Mesoproterozoic overprint and a possible Mesozoic overprint from these basins and the smaller Indravati Basin. Our primary pole from the lower stratigraphic intervals of the P-G and Chattisgarth basins is considered robust in that it is of dual polarity and supported by a positive intraformational conglomerate test and a regional fold test. The similarity of this palaeopole to a 1.19 Ga Indian pole and its dissimilarity to a 1.4 Ga and various 1.0 Ga palaeopoles from cratonic India suggest that deposition of the stratigraphically lower parts of Penganga and Raipur groups occurred during the Stenian period. This supports the c. 1180 Ma age assignment for the Penganga Group by Conrad et al. (Reference Conrad, Hein, Chaudhuri, Patranabis-Deb, Mukhopadhyay, Deb and Beukes2011). Furthermore, it suggests that the deposition of Raipur Group spanned the c. 200 Ma of the Stenian period (i.e. late Mesoproterozoic era). This is significantly shorter than a span based on the existing detrital zircon age constraints from immediately below the Raipur Group, which would also include the whole of the Ectasioan period (i.e. middle Mesoproterozoic era) and parts of the Calymmian period (i.e. earliest Mesoproterozoic era). The new early Stenian palaeopole for India provides additional constraints for cratonic India's latitudinal drift in the time after the break-up of supercontinent Columbia.
As no primary magnetization could be identified from the Indravati Basin, its age and correlation remain an enigma. The palaeomagnetic results are however very encouraging for potential future studies applied to other Purana basins, such as the isolated Bhima and Kaladgi basins further to the west.
Acknowledgements
The authors would like to express their gratitude to Asrukumar Chauduri (5 June 2013), retired professor of the Geological Studies Unit of the Indian Statistical Institute in Kolkata, without whom the completion of this work would have been impossible. The comments of two anonymous reviewers on the present version of the manuscript, and comments by two anonymous reviewers and those of V. Pradhan on an earlier version of this manuscript, are gratefully acknowledged.
Declaration of Interest
None.