


Introduction
Epiphytic lichens are sensitive to environmental conditions related to forest type and management in both temperate and tropical forests (Will-Wolf et al. Reference Will-Wolf, Essen, Neitlich, Nimis, Scheidegger and Wolseley2002; Stofer et al. Reference Stofer, Bergamini, Aragón, Carvalho, Coppins, Davey, Dietrich, Farkas, Kärkkäinen and Keller2006; Rivas Plata et al. Reference Rivas Plata, Lücking and Lumbsch2008; Marmor et al. Reference Marmor, Tõrra, Saag and Randlane2011). In old-growth forests with long ecological continuity and a high diversity of substrata, age and conditions, lichens with high niche specificity but poor dispersal ability can survive and flourish (Whittet & Ellis Reference Whittet and Ellis2013). Lichens with such restrictions are not found in disturbed woody vegetation and can serve as indicators of old-growth condition, and are of high conservation value (Wolseley et al. Reference Wolseley, Moncrieff and Aguirre-Hudson1994, Reference Wolseley, Ellis and Chimonides2007; Wolseley Reference Wolseley, Nimis, Scheidegger and Wolseley2002; Weerakoon Reference Weerakoon2010, Reference Weerakoon2013; Marmor et al. Reference Marmor, Tõrra, Saag and Randlane2011; Ellis Reference Ellis2012). Ecological indication by species is a relatively new area of research in the tropics; baseline data are critical to distinguish specialist indicator species associated with natural vegetation types and forest continuity from presumed generalists associated with wider climate ranges or those associated with disturbed and managed vegetation (Dettki & Esseen Reference Dettki and Esseen1998, Reference Dettki and Esseen2003; McCune Reference McCune2000; Norden & Appelqvist Reference Norden and Appelqvist2001; Selva Reference Selva, Nimis, Scheidegger and Wolseley2002; Rivas Plata et al. Reference Rivas Plata, Lücking and Lumbsch2008; Weerakoon Reference Weerakoon2013). Natural forest ecosystems with little anthropogenic impact are disappearing at an alarming rate in the tropics (Gradstein Reference Gradstein, Bates and Farmer1992; Rivas Plata et al. Reference Rivas Plata, Lücking and Lumbsch2008; Jayalal Reference Jayalal2010; Weerakoon Reference Weerakoon2013); baseline research must be conducted before it is too late.
Quantitative approaches have been used in a range of tropical forest vegetation types to assess sites of high conservation importance for lichens and distinguish them from disturbed forests (Wolseley et al. Reference Wolseley, Moncrieff and Aguirre-Hudson1994, Reference Wolseley, Ellis and Chimonides2007; Saipunkaew et al. Reference Saipunkaew, Wolseley, Chimonides and Boonpragob2005; Käffer et al. Reference Käffer, de Azevedo Martins, Alves, Pereira, Fachel and Vargas2011; Koch et al. Reference Koch, de Azevedo Martins, Lucheta and Müller2013). Whittet & Ellis (Reference Whittet and Ellis2013) and Dymytrova et al. (Reference Dymytrova, Brändli, Ginzler and Scheidegger2017) point out that the use of indicator species or groups of species often relies on expert opinion and varies both with vegetation type and geographical region. They argue that explicit statistical testing is needed to support the validity of indicator species used to help evaluate conservation priorities.
In Sri Lanka, deforestation since the mid-18th century has massively reduced the extent of primary, old-growth forest especially across mountainous areas (Balasubramanium Reference Balasubramanium1991; Bambaradeniya & Ekanayake Reference Bambaradeniya and Ekanayake2003; Gunatilleke et al. Reference Gunatilleke, Pethiyagoda and Gunatilleke2008; Alagan Reference Alagan2009a, Reference Alaganb; Lindström Reference Lindström2011; Medawatte et al. Reference Medawatte, Ekanayake, Tennakoon, Gunatilleke and Gunatilleke2011; Lindström et al. Reference Lindström, Mattsson and Nissanka2012; Weerakoon Reference Weerakoon2013). When montane areas were converted to tea and cardamom plantations, native forest trees were retained for shade, allowing some ecological continuity of lichen epiphytes. In other sites where logging and clearing occurred, lichen continuity was reduced or destroyed. Some cleared areas were replanted with mixtures of native and exotic tree species (Bambaradeniya & Ekanayake Reference Bambaradeniya and Ekanayake2003; Weerakoon Reference Weerakoon2010, Reference Weerakoon2013; Lindström Reference Lindström2011; Medawatte et al. Reference Medawatte, Ekanayake, Tennakoon, Gunatilleke and Gunatilleke2011). Other areas were converted to shifting cultivation with only a small number of large trees remaining.
In a field study of corticolous lichens from different woody vegetation types of the Knuckles Mountain Range in Sri Lanka (Fig. 1), Weerakoon (Reference Weerakoon2010, Reference Weerakoon2013) showed that distinct lichen assemblages are found in vegetation types linked to different suites of climate conditions (temperature and moisture status: Fernando Reference Fernando2010) and disturbance status. Similar studies carried out in other tropical forests in Thailand (Wolseley Reference Wolseley, Nimis, Scheidegger and Wolseley2002; Wolseley et al. Reference Wolseley, Ellis and Chimonides2007) found distinct lichen communities in deciduous dipterocarp forests versus semi-evergreen forests modified by fire. In Costa Rica, Rivas Plata et al. (Reference Rivas Plata, Lücking and Lumbsch2008) distinguished lichen families that had a significant preference for undisturbed primary tropical forests and very old secondary forests from families that were associated with more recently disturbed habitats.
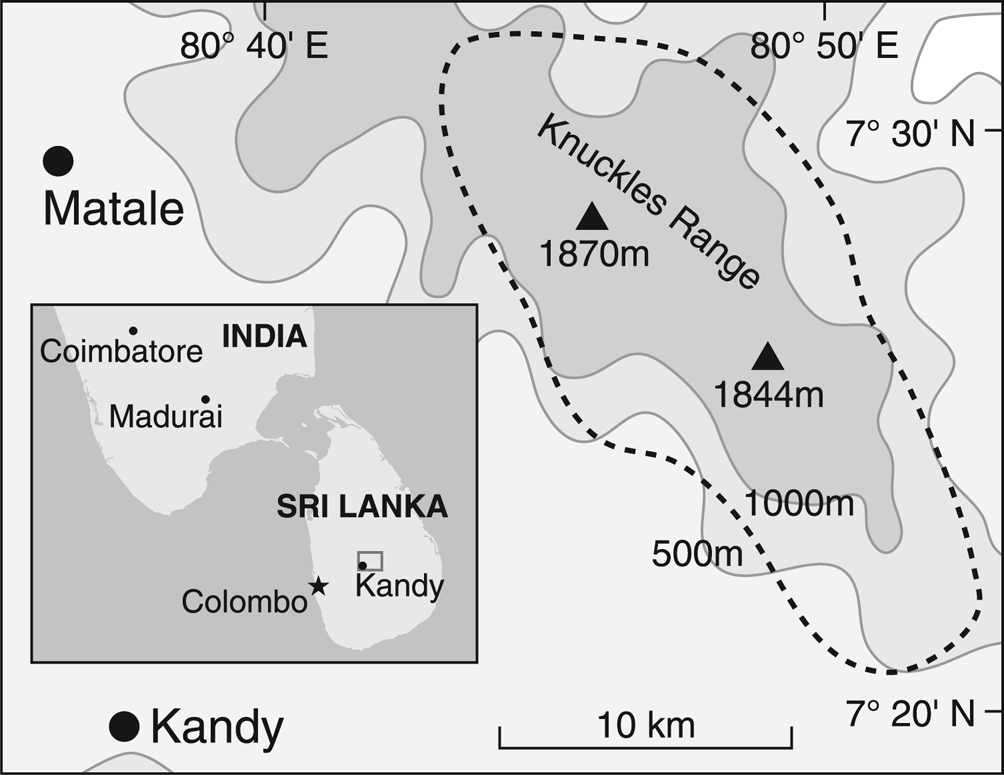
Fig. 1. Map of the Knuckles Mountain Range region surveyed in this study; altitude marked by isoclines with the two highest peaks indicated by triangles. Sites were contained in the area outlined by the dotted line. Inset shows location of the large map within Sri Lanka, and location with respect to India.
This study had two goals. The first was to quantitatively evaluate in a balanced analysis the factors influencing distribution of corticolous lichens in the tropical landscape of Sri Lanka (Knuckles Mountain Range). Plots were selected in different vegetation types to represent major gradients in environment and disturbance (Weerakoon et al. Reference Weerakoon, McCune, Wolseley and Wijeyaratne2012a, Reference Weerakoon, Wolseley, Will-Wolf and Wijeyaratne2014b; Weerakoon Reference Weerakoon2013). The second goal was to identify quantitatively-supported indicator species for vegetation type, disturbance status and climate, to facilitate forest conservation and management.
Materials and Methods
Study sites
A field project was conducted by Weerakoon (Reference Weerakoon2013) in the Knuckles Mountain region (c. 180 km2) of the Central Highlands of Sri Lanka between 2008 and 2011. Lichens were surveyed in measured plots within suitable sites (suitable site = area with a continuous expanse of homogeneous vegetation of the selected type, at least 3 times larger than plot size) in 16 natural and disturbed vegetation types defined by Bambaradeniya & Ekanayake (Reference Bambaradeniya and Ekanayake2003). A subset of 42 plots in seven vegetation types (one plot per site) was selected for this study (summarized in Table 1; details in Supplementary Material Section S1, available online). Climate data were not available for each site; in Table 1 each vegetation type has been linked to a suite of climate conditions defined by measured temperature, rainfall and seasonality (Greller & Balasubramanium Reference Greller and Balasubramanium1990; Fernando Reference Fernando2010).
Table 1. Study site organization: vegetation type (numbered 1–7) within climate zone (1–3) and disturbance group (1–4) (see ‘Study sites’ for types, zones and groups described in literature; see Table 2 for altitude and other environmental variables). Climate zones, disturbance groups and vegetation types are grouping factors for Indicator Species Analysis (ISA). The number of sites from which to choose six for the study (the site pool) was large unless noted.
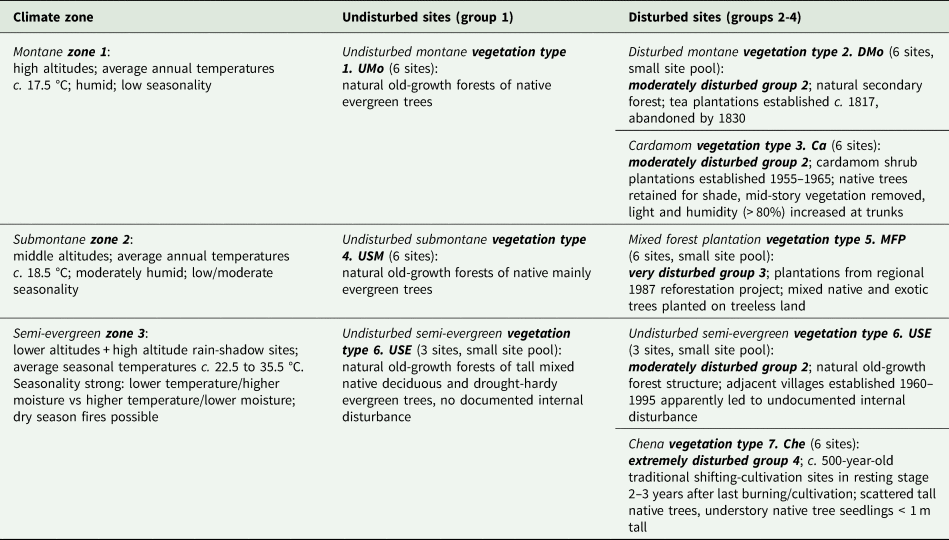
Natural and disturbed vegetation types were matched within climate zones (Table 1): the number of available suitable sites differed among vegetation types and continuity differed among disturbance types. For montane climate zone 1, undisturbed montane forest (UMo) was matched with disturbed montane forests (DMo) that were abandoned tea plantations and with Cardamom plantations (Ca). Native trees retained at DMo and Ca plots as shade trees allowed some potential continuity of lichen habitat. For submontane climate zone 2, undisturbed submontane forest (USM) was matched with disturbed mixed forest plantations of native and introduced tree species (MFP) without continuity of extant trees or lichen habitat. For semi-evergreen climate zone 3, undisturbed semi-evergreen forest (USE) was matched with disturbed Chena cultivation (Che) sites (Table 1). At Che sites some trees remained but repeated burning precluded continuity of lichen habitat. Most of this zone was converted to agriculture more than 200 years ago (G. Weerakoon personal communication, from villagers and monks); remaining undisturbed USE forest examples are widely scattered. USE sites had no historical records or visible evidence of disturbance (Bambaradeniya & Ekanayake Reference Bambaradeniya and Ekanayake2003; Fernando Reference Fernando2010). Three were adjacent to recent villages and two were at higher altitudes (Tables 1 & 2; Supplementary Material Section S1, Table S1.1); only one was both at a typical low altitude and away from a village. Che sites matched as far as was possible the altitudes, topography and exposure of USE sites.
Table 2. Quantitative or categorical environmental and vegetation variables; for quantitative variables, the average (in italics) and the range of values for plots by vegetation type are given. See text and Table 1 for names and descriptions of climate zones, disturbance groups and vegetation types. See Supplementary Material Section S1, Table S1.1 (available online), for values by plot of quantitative variables. DBH = diameter at breast height; no. = number.
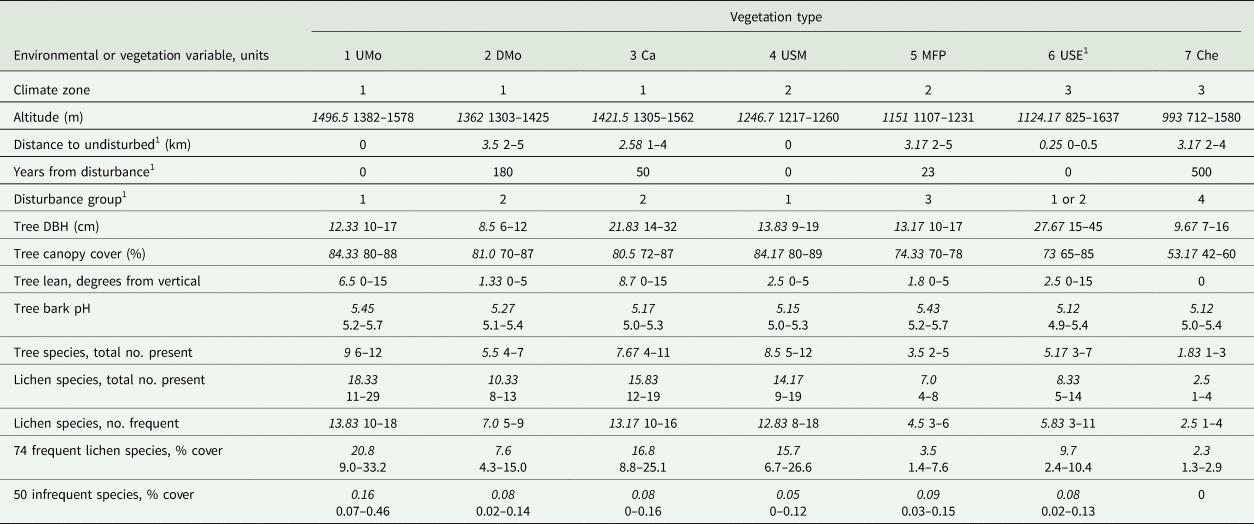
1 Three USE plots adjacent to villages were assigned to disturbance group 2 and had a distance to undisturbed forest of 0.5 km (see Table 1; Supplementary Material Section S1). They had no documented internal disturbance, so years from disturbance = 0.
Data collection
During 2008–2011, field-sampled 100 × 100 m plots were established (Weerakoon Reference Weerakoon2013) (details in Supplementary Material Section S1). For each of 10 randomly selected trees per plot, with diameter at breast height (DBH) > 5 cm, five gridded 10 × 25 cm quadrats were randomly placed on the trunk between 0.5 and 1.5 m above the ground. Lichen species cover was recorded as the number of 1 cm2 grid squares occupied. Lichens not identified in the field were numbered, collected and identified in the laboratory. Most crustose species required laboratory identification by an expert, as did many other species. Literature, keys (including Awasthi Reference Awasthi1991, Reference Awasthi2007; Staiger Reference Staiger2002) and other experts were consulted for lichen identification.
Environmental and plot vegetation data compiled or collected at either plot-level or tree-level for the original study were used here. Fifteen environmental or vegetation variables (details in Supplementary Material Section S1) were measured per plot: three were categorical and the rest quantitative (Table 2). Vegetation types 1–7 and climate zones 1–3 are summarized in Table 1. A climate zone in this study is the closest proxy to measured climate variables. After preliminary data exploration (Supplementary Material Sections S1 & S2), within-site disturbance was represented by four disturbance groups (Table 1) mostly following the vegetation type descriptions in Bambaradeniya & Ekanayake (Reference Bambaradeniya and Ekanayake2003). Dates of first disturbance were derived by Bambaradeniya & Ekanayake (Reference Bambaradeniya and Ekanayake2003) from historical records and local knowledge. Altitude and distance to undisturbed forest were recorded from maps and confirmed in the field; within-plot environmental variables and four meso-habitat variables (Cáceres et al. Reference Cáceres, Lücking and Rambold2007) for sampled trees were measured by Weerakoon (Reference Weerakoon2013). The number of tree species represents all trees on the plot with DBH > 5cm. Meso-habitat variables plus the number and cover of lichen species recorded for each sampled tree were summarized across each whole plot (Table 2).
Data analysis
Weerakoon (Reference Weerakoon2013) originally found 124 corticolous lichen species in the 42 plots. Of these, 74 species in 17 families formed the primary data set for this study. These were recorded in at least three plots with > 20 cm2 total cover/plot (designated ‘frequent’ hereafter; for names, authorities and codes, see Supplementary Material Section S1, Table S1.2). Species richness and abundance, the basic components for standard diversity measures, were analyzed separately. Each was calculated for the frequent species as well as for the total sample, including the 50 ‘infrequent’ species (Table 2; Supplementary Material Section S1, Table S1.1). Species richness or abundance are the ‘lichen diversity variables’ in this study.
Pearson and Spearman correlations in SPSS v.25 (IBM Corp. 2017) followed by partial correlations explored relationships of lichen diversity variables with environmental variables and identified those of the latter that were strongly correlated with each other (details in Supplementary Material Section S1). GLM (IBM Corp. 2017: Levene's test for homogeneity of variances, post-hoc LSD and Tukey HSD tests for subgroups) was used to evaluate response to categorical environmental factors. To help account for experiment-wide error only results with P ≤ 0.01 were considered strongly significant. Variables were logarithm base 10-transformed (log10) for partial correlations and GLM as needed to compensate for violations of parametric assumptions (see Supplementary Material Section S1).
Nonmetric multidimensional scaling (NMS) identified major patterns of lichen community composition and their relationships with environmental factors (details in Supplementary Material Section S1). NMS of the 74 frequent lichen species in the 42 plots was conducted in PC-ORD v.6 (McCune & Mefford Reference McCune and Mefford2011) using the Sørensen (Bray-Curtis) distance measure (McCune & Grace Reference McCune and Grace2002) on unrelativized abundance data. Ecological interpretations were supported with secondary correlations between external environmental variables and the ordination axes.
Indicator lichen species and selected genus-level taxa were identified with ISA (Dufrêne & Legendre Reference Dufrêne and Legendre1997) in PC-ORD v.6 (McCune & Mefford Reference McCune and Mefford2011). For the analysis of genus-level taxa, all species in the same genus were included (details in Supplementary Material Section S1). Indicator value (IV) is calculated from the frequency and abundance of a given taxon occurring within plots within designated groups; a value for one taxon is independent of data for other taxa in the data set, but varies with numbers of both groups and plots in groups. Indicator values were calculated for three different sets of groups: 1) seven vegetation types, 2) three climate zones, and 3) four disturbance groups (Table 2). Disturbance group 3 and vegetation group 5 MFP include the same plots, as do disturbance group 4 and vegetation group 7 Che. A potential strong indicator taxon was designated if it showed higher than expected ‘fidelity’ to the particular group it indicates: IV ≥ 50%, with statistical support at P ≤ 0.05 for group indication. Indicator value and probability were reported for each potential strong indicator taxon. Indicator species were also evaluated with respect to morphological (fruticose, foliose, crustose) or photobiont (trentepohlioid algae, chloroccoid algae, cyanobacteria) traits.
Results
General patterns
Our results showed wide variation in lichen composition (details in Supplementary Material Section S2, available online) across the 42 study plots. Of the 74 frequent species, 72% were found in only one vegetation type, 15% in two types, two in five types, and none in all. The average number and cover of lichen species were highest in UMo plots and lowest in Che (Table 2). Infrequent lichen species were 10–35% of the total number for all vegetation types except Che, though cover of infrequent species was < 0.03% of any total. No one lichen diversity variable was the strongest response in all analyses. The number of lichen or tree species recorded in plots varied 2-fold within vegetation type and 5-fold between them (Table 2). Disturbance variables were more strongly correlated with lichen response when the three USE sites adjacent to recent (1960–1995) villages were coded as slightly disturbed, and 0.5 km from undisturbed forest. USE plots with an adjacent village had fewer lichen species and a lower coverage than other USE plots (all species: average 6.3 species/plot vs 10.3/plot, 3.6% cover/plot vs 15.9% cover/plot; Supplementary Material Section S1, Table S1.1).
Lichen diversity patterns
Lichen species number and cover per plot were very strongly correlated with each other (r/rho 0.910–1.000, Supplementary Material Section S2, Table S2.1; 83–100.0% of variation, from r 2 or rho 2), with number of tree species (86–92% of variation), and also with average canopy cover (70–80%). Canopy cover was strongly correlated with both number of tree species (85%, Table S2.1) and years from disturbance (55%, Table S2.2), thus representing environmental variation at two scales (also confirmed by partial correlation, 75%, Table S2.3). Number of tree species was confirmed by partial correlation (83%, Table S2.3) as the strongest within-plot variable affecting lichen diversity. Correlations were weaker (24% to < 50% of variation, Table S2.1) between lichen diversity variables and altitude (stronger when semi-evergreen climate zone 3 sites excluded), distance to undisturbed forest, or years from disturbance, and much weaker (< 24%) for within-plot average lean, size and bark pH of sampled trees.
Univariate GLMs (42 plots) were strong for lichen diversity variables explained by categorical variables. GLM for number of frequent lichen species by vegetation type and within-plot disturbance group (Supplementary Material Section S2, Table S2.4: model adjusted r 2 = 0.805, P < 0.0005) found differences among both vegetation types (more important: P < 0.0005) and disturbance groups (less important: P = 0.017). The seven vegetation types formed three distinct (P < 0.001) homogeneous subsets (post-hoc tests): 1 UMo + 3 Ca + 4 USM with the most species; 2 DMo + 5 MFP + 6 USE with intermediate numbers of species; 7 Che with the fewest species. Disturbance groups were each distinct subsets with more lichen species than the next disturbed group (group 1 undisturbed with the most species; group 4 Che with the fewest). The GLM for total number of lichen species by disturbance group and climate zone (Table S2.5: model adjusted r 2 = 0.758, P < 0.0005) found differences among disturbance groups (more important: P < 0.0005) and climate zones (less important: P = 0.004). From post-hoc tests, disturbance groups formed three homogeneous subsets (P < 0.001); undisturbed group 1 and moderately disturbed group 2 were combined. Each climate zone was distinct (P < 0.008). More species occurred in the least disturbed groups and the montane climate zone.
Lichen community structure
Variation in lichen species composition by plot, displayed on axes 1 and 2 of the NMS ordination (Fig. 2), had strong secondary correlations with large-scale disturbance factors and canopy cover, and weaker correlations with other variables. This best NMS solution (3-dimensions, low final stress, non-random, axes orthogonal) represented 56% of the total variation (Supplementary Material Section S2 and Table S2.6). Species composition differed strongly between undisturbed versus disturbed plots (axis 1, Fig. 2). Species composition of plots in Chena cultivation (Che), the most disturbed vegetation type (longest disturbance, lowest canopy cover: Table 2), clearly differed from that of all other plots on axis 2 (the second strongest signal). Cardamom plantation (Ca) plots with high lichen species diversity (Table 2) were clearly grouped on axis 1 with other disturbed vegetation plots, based on species composition. Communities in plots were mostly similar within a vegetation type and distinct between types; only USE plots were scattered and overlapped with others. Plot clustering by vegetation type did not entirely overlap with disturbance status; plots in the two most disturbed vegetation types, Che and MFP, were plotted at opposite ends of axis 2 with moderately disturbed sites in between. Climate was weakly reflected on the ordination, for instance by the proximity of disturbed types Ca and DMo in the montane zone. Sites were not clearly ordered by climate zone as a continuum along either axis. Within-plot habitat factors other than canopy were only weakly reflected on the ordination, as were lichen diversity variables (Supplementary Material Section S2, Table S2.8). The strongest are shown in Fig. 2. Much of the remaining variation in lichen community composition (17.6%, axis 3 not displayed) was correlated only with sampled tree size (Supplementary Material Section S2, Table S2.8).
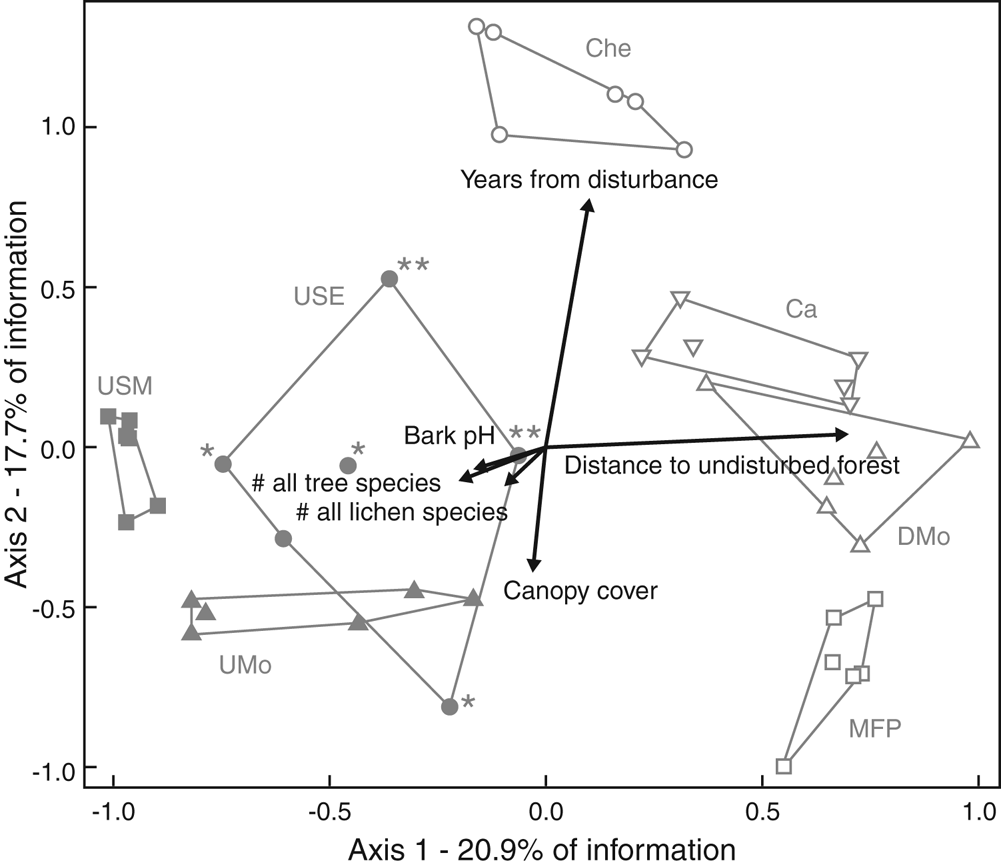
Fig. 2. NMS ordination of 42 sampled plots from seven vegetation types (outlined), based on 74 frequent lichen species distributed among sites. Arrows on the plot illustrate correlations of external environmental, habitat, vegetation and lichen diversity variables, with ordination axes 1 and 2 displaying plots based only on variation in lichen species composition. Arrow direction to the right or up indicates positive correlation with an axis (or vice versa); length corresponds to strength of correlation. Details in Supplementary Material Section S2, Tables S2.7 & S2.8, available online. UMo = undisturbed montane vegetation type; DMo = disturbed montane vegetation; Ca = Cardamom vegetation; USM = undisturbed submontane vegetation; MFP = mixed forest plantation; USE = undisturbed semi-evergreen vegetation; Che = Chena vegetation; * = USE plots with adjacent villages; ** = USE plots at higher altitudes; # = number. In colour online.
Weak correlations of lichen diversity, and most within-plot habitat variables, with ordination axes (Supplementary Material Section S2, Table S2.8), contrasted with strong statistical results for the same variables when tested by GLM. Climate zone, also not strongly reflected in the ordination pattern, was a significant driver in a GLM (Table S2.5). Canopy cover was an exception; clearly different in Che to all other vegetation types (Table 1, Fig. 2) and with moderately strong patterns in both types of analysis. Both ordination and GLM separated Che from all other vegetation types or disturbance groups. Both also separated the other six vegetation types into two distinct groups with different compositions. Lichen species composition in plots varied mostly with large-scale environmental factors linked to disturbance status, while lichen species number or cover strongly reflected the impact of within-plot factors and the large-scale factor climate (also a driver for vegetation type), as well as disturbance status.
Indicator species analysis
ISA of the 74 frequent lichen species in plots grouped by vegetation type, climate zone or disturbance group identified 60 species as strong indicators. Preliminary analyses (see Supplementary Material Section S1) showed that species present at only one or two of the 42 plots were never significant indicators. Most (57) were indicators for a vegetation type; average indicator species strength (Table 3) by vegetation type did not vary with disturbance status. There were 29 indicators (one a genus indicator, Table 4) for undisturbed vegetation types and only seven for more disturbed vegetation types 5 MFP (= disturbance group 3) and 7 Che (= disturbance group 4): six species indicators (Table 4) for a single type and one genus indicator for disturbance groups 3 & 4 combined (Table 5). Vegetation types with the most tree species sampled (Table 3) had similarly large numbers of frequent lichen species and the most indicator species, consistent with strong correlations between numbers of lichen and tree species. Each of the four disturbance groups was represented by at least one indicator species (Table 5). Only a small number of species (and one genus group) strongly indicated a climate zone (Table 5); only one species, Cratiria obscurior, was a strong indicator for all three grouping factors.
Table 3. Summary of tree and lichen species numbers and number of strong lichen indicator species for each vegetation type (total and by the listed categories) across all plots combined within type. See Table 1 for full names of vegetation types. IV = Indicator value.

Table 4. Strong lichen indicator species (and one genus) (indicator value IV ≥ 50; probability P ≤ 0.015) for each of the seven vegetation types; see Table 1 for full names of vegetation types and text for explanations. Species (and genus) are ordered alphabetically within family and within vegetation type; see Supplementary Material Section S1, Table S1.2 (available online) for authorities. Dotted lines separate vegetation types. Records in bold have P ≤ 0.01. Those with P values in italics were recorded at only three plots, all in that vegetation type. Abbreviations: Growth habit, Fr = fruticose, Fo = foliose, Cr = crustose; Photobiont type, Ch = Chlorococcoid algae, Tr = Trentepohlioid algae, Cy = Cyanobacteria.
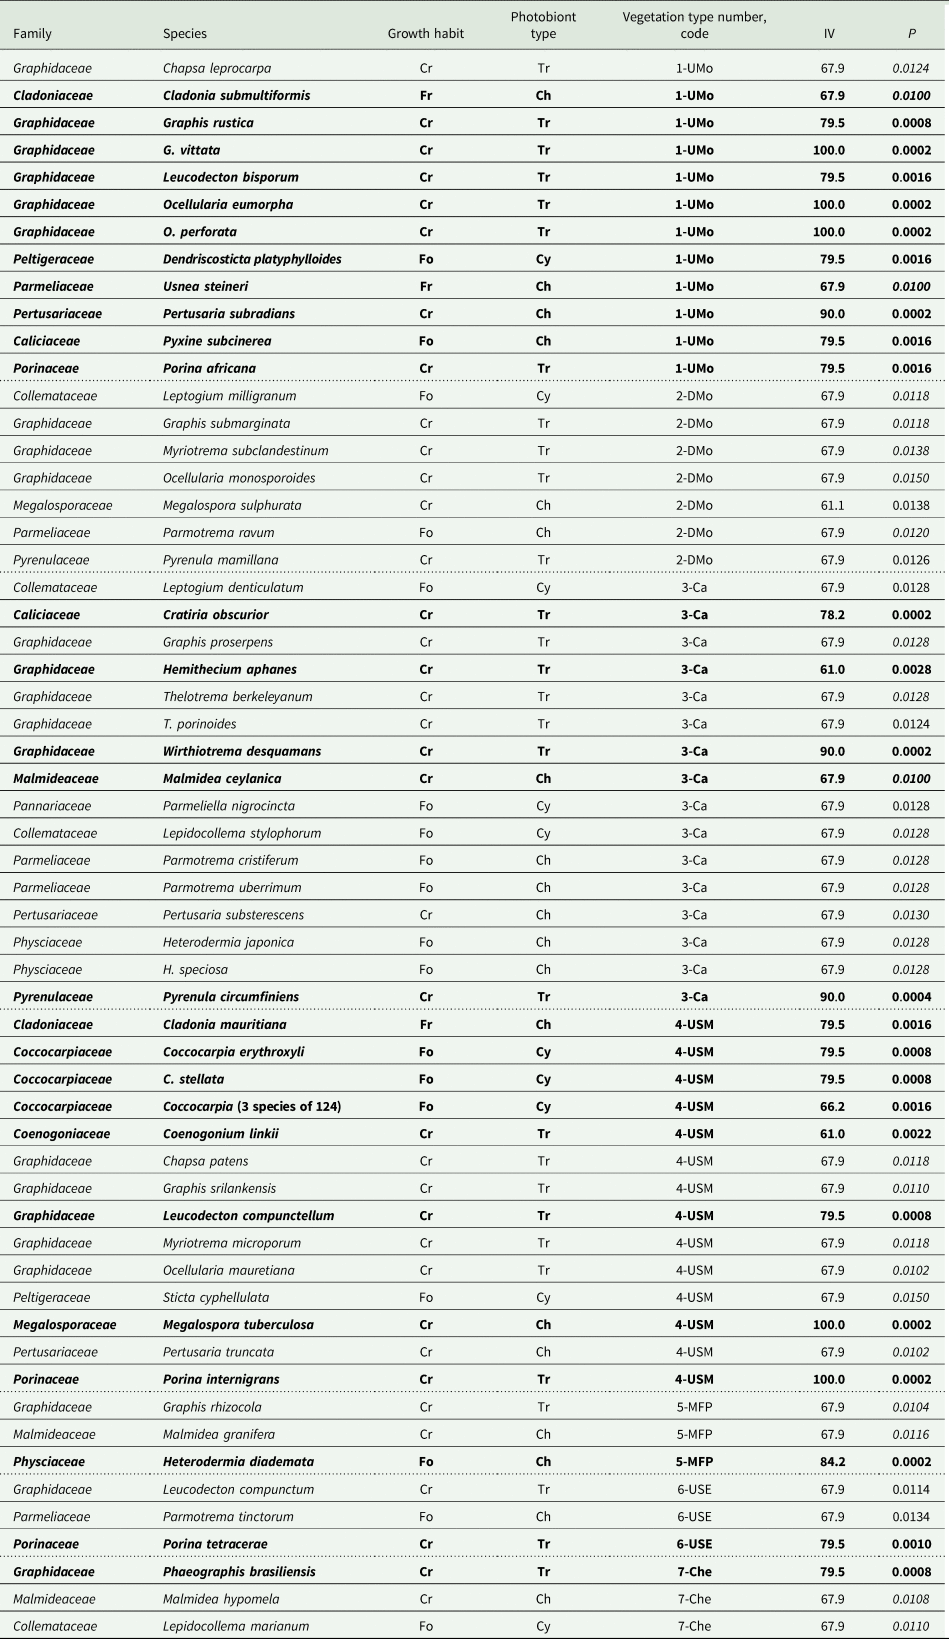
Table 5. Strong lichen indicator (indicator value, IV ≥ 50.0%, P < 0.006 with one exception) species, genera, or multi-genus groups for disturbance group (1 = least to 4 = most disturbed) or climate zone (1 = coolest; no indicator for semi-evergreen climate zone 3); see Table 1 for explanation of group and zone codes. Species are alphabetical within family (authorities in Supplementary Material Section S1, Table S1.2, available online), followed by genus-level indicators. See Table 4 for explanation of abbreviations.
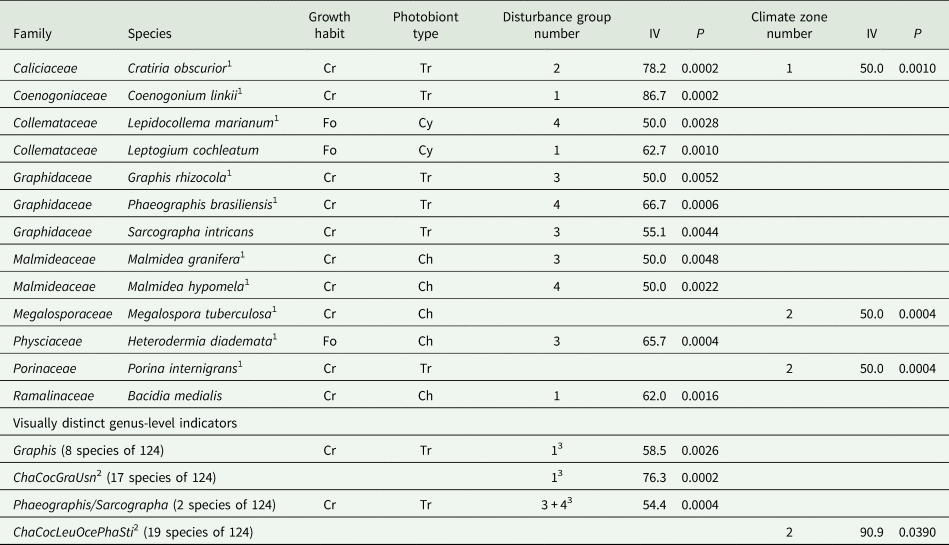
1 Also a strong indicator for one of the seven vegetation types, see Table 4
2 Cha = Chapsa; Coc = Coccocarpia; Gra = Graphis; Oce = Ocellularia; Pha = Phaeographis/Sarcographa; Usn = Usnea/Eumitria; Sti = Sticta/Dendriscosticta. The last three genus pairs were recently segregated.
3 Disturbance groups 3 and 4 combined for these analyses
The ISA results demonstrate the dominance of crustose indicators in all vegetation types, most of these with a trentepohlioid photobiont and in Graphidaceae (the most prevalent family; Table 3). Morphology and photobiont grouping factors overlap further; all cyanolichen indicators were foliose. Trentepohlioid subgroups were somewhat restricted to a small subset of vegetation types, disturbance groups or climate zones; for instance Thelotrema (Graphidaceae) and Porina (Porinaceae) species (Tables 4 & 5). Macrolichen indicators, including cyanolichens, occurred across all vegetation types (Tables 3 & 4) but tended to be concentrated in species-rich types such as Ca. Indicators with chlorococcoid photobionts included all three morphological groups and were distributed in all vegetation types, though Malmidea species indicated only disturbed vegetation types or disturbance groups while Usnea species indicated only undisturbed vegetation (Tables 4 & 5).
Some indicators for a vegetation type, climate zone, or disturbance group are visually distinct enough to be distinguished by trained parataxonomists in the field (G. Weerakoon, personal communication; Supplementary Material Section S2, ‘ISA results’). Coenogonium linkii and Megalospora tuberculosa, the only visually distinct indicator species in the study, indicated the USM vegetation type (Table 4) as well as broader groups (Table 5). Coccocarpia, the only genus-level indicator for a vegetation type (Table 4), is also included in multi-genus indicators for broader groups (Table 5). For ISA of genus groups, disturbance groups 3 and 4 (plots with no continuous lichen occupancy) were combined (Table 5). The two Phaeographis/Sarcographa species (together a genus group), each a strong indicator for a different disturbed vegetation type (Table 5), are not individually useful to parataxonomists; they are distinguishable only by experts. This visually distinct genus group, the visually distinct genus Graphis, and one multi-genus group were each indicators for a disturbance group (Table 5). The multi-genus climate indicator (less reliable: P higher) is included as a second visually distinctive indicator for that factor, the other being Megalospora tuberculosa (Table 5).
ISA results overlapped somewhat with ordination results. Of the 20 lichen species strongly correlated with NMS ordination axes (r 2 ≥ 0.20; Supplementary Material Section S2, Table S2.9), 18 were also strong indicators from ISA (Tables 4 & 5). However, most species indicating a vegetation type were not strong contributors to major patterns of lichen community composition.
Discussion
Our results illustrate the tremendous impact anthropogenic disturbance has had on corticolous lichens in the Knuckles Range region of Sri Lanka. The strongest compositional pattern is that undisturbed vegetation types support lichen communities very different from those of disturbed vegetation types. Relationships of lichen species richness and community composition with environmental variables each reflect this major impact, while differences in patterns between the two provide important insights into factors driving the lichen response. Most of the frequently occurring lichen species are strong indicators for one of the seven vegetation types that reflect a disturbed versus undisturbed status within a climate zone.
Patterns of lichen response to environmental factors
While lichen species richness and cover were higher in undisturbed forests and lower with increasing disturbance, their strongest correlations were with tree species diversity. In this study correlations between all other within-plot habitat variables suggest that number of tree species represents the accumulated impact of all those factors on lichen species diversity. Undisturbed tropical forests support a high diversity of tree species that between them present diverse combinations of forest structure and tree microhabitats supporting high lichen richness and cover (Benítez et al. Reference Benítez, Prieto, González and Aragón2012; Frisch et al. Reference Frisch, Rudolphi, Sheil, Caruso, Thor and Gustafsson2015). Benítez et al. (Reference Benítez, Prieto, González and Aragón2012, Reference Benítez, Aragón, González and Prieto2018) have also shown that lichen species composition is strongly linked to the natural vegetation type and to vegetation types resulting from disturbance. Multiple statistical analyses demonstrate that lichen species richness and cover are affected by both within-plot and large-scale environmental variation. A further conclusion from our analyses is that in disturbed plots where forest trees support lichen continuity (represented by disturbance group 2 and plots in disturbed vegetation types Ca and DMo) lichen species richness and cover is high in comparison to plots where lichen continuity has been curtailed (disturbance groups 3 and 4, MFP and Che plots). The high lichen diversity of Ca plots in this study is a pattern found in other tropical areas where native forest trees retained for shade have provided substratum continuity in disturbed forests (Andersson & Gradstein Reference Andersson and Gradstein2005). The decrease in lichen species diversity from montane to submontane to semi-evergreen climate zones is seen clearly when comparing undisturbed vegetation types. Although the impacts of disturbance and climate were statistically distinguished with GLM, there were confounding effects in that moderate disturbance with a degree of continuity was represented mostly in the montane climate zone (DMo and Ca vegetation types), while disturbance without continuity was represented only in submontane (MFP) and semi-evergreen (Che) climate zones. Previously undetected impacts on apparently undisturbed USE sites were clearly reflected in the ordination; an uncharacteristically wide scattering of plots in that vegetation type suggested that most were either mildly disturbed by adjacent villages or at an uncharacteristic high altitude (Fig. 2).
In contrast to lichen diversity variables, lichen species composition was linked most strongly with disturbance, based on the ordination results. Two aspects of disturbance status independently affected lichen communities: 1) distance from an undisturbed forest and 2) time from first disturbance that was correlated with canopy cover and qualitatively linked to within-site disturbance severity. Both suggest dispersal limitations (not directly evaluated) might help explain the lower diversity as well as different types of species at disturbed plots in this study. Isolation and fragmentation have been inferred as negatively affecting forest lichen species richness (Öckinger & Nilsson Reference Öckinger and Nilsson2010; Wolseley et al. Reference Wolseley, Sanderson, Thüs, Carpenter and Eggleton2016), composition (Will-Wolf et al. Reference Will-Wolf, Nelsen and Trest2010), and distribution of even common species (Will-Wolf et al. Reference Will-Wolf, Jovan and Amacher2017). In the United Kingdom (temperate climate), Wolseley et al. (Reference Wolseley, Sanderson, Thüs, Carpenter and Eggleton2016) found managed sites adjacent to primary forest acquired primary forest lichens over time but isolated plantations, even when 200 years old, did not. In our study, it was difficult to clearly distinguish effects of internal disturbance versus isolation; the distinction is often not made at all in other tropical studies. For example, Benítez et al. (Reference Benítez, Prieto, González and Aragón2012) found in Ecuador that total lichen diversity decreased when the range of undifferentiated disturbance increased.
Contrasting patterns from the different kinds of analyses illustrate that in this study lichen species composition primarily reflected large-scale effects linked to anthropogenic modification, while lichen species diversity was linked as much to natural factors as to disturbance factors, both within-plot and at a large scale. The impact of a relatively variable climate on species composition was masked by disturbance impact, while climate had a slightly stronger impact than disturbance on lichen diversity. Holz & Gradstein (Reference Holz and Gradstein2005) also found differences between patterns of Costa Rican forest lichen richness and composition: lichen richness increased with forest age but after 40 years of succession one third of primary forest species had still not re-established. The loss of shade-adapted primary forest lichen species and increase in species tolerant of disturbed conditions has been documented in tropical montane (Wolseley Reference Wolseley, Nimis, Scheidegger and Wolseley2002; Benítez et al. Reference Benítez, Prieto, González and Aragón2012) and temperate forests (Ódor et al. Reference Ódor, Király, Tinya, Bortignon and Nascimbene2014). That similar shifts have been severe in the Knuckles region is shown by the dominant role that disturbance status plays in explaining major gradients in lichen species composition and in the distribution of indicator species.
In the present study, averaging values for a plot, to focus on the plot-level and large-scale response of lichens, has masked small-scale impacts of within-plot and tree-level variables that have often been found to be important by other studies. Variation due to within-plot factors was also overshadowed by the wide range of climates and disturbance status represented by selected vegetation types. In temperate zone studies, lichen species diversity often increases with tree size, a surrogate for tree age (Ellis & Coppins Reference Ellis and Coppins2007, Reference Ellis and Coppins2010). In some tropical conditions termites may limit tree age and lichen diversity is often higher on younger trees (Wolseley Reference Wolseley1997). Such causal relationships with lichens vary in different tropical forests with both high tree species diversity and high variation in composition (Wolseley Reference Wolseley1997). Tree age and species composition have affected lichen community composition at smaller geographical scales, with narrower ranges of environmental variation observed for a tropical forest (Frisch et al. Reference Frisch, Rudolphi, Sheil, Caruso, Thor and Gustafsson2015) or temperate forests (Will-Wolf et al. Reference Will-Wolf, Geiser, Neitlich and Reis2006). Direct relationships between bark pH and lichen diversity are well documented in other studies (Kuusinen Reference Kuusinen1996; Herk Reference Herk2001; Holz Reference Holz2003; Cáceres et al. Reference Cáceres, Lücking and Rambold2007; Li et al. Reference Li, Liu, Wang, Ma and Song2011; Koch et al. Reference Koch, de Azevedo Martins, Lucheta and Müller2013) that do not focus on disturbance impacts. Our tree-level variables might be more strongly correlated with lichen species response when analyzed for individual tree species over a narrower range of environmental conditions.
Altitude, representing local gradients in temperature, rainfall and humidity, has in many studies worldwide been considered a reliable proxy for climate influencing lichen distribution (e.g. Frisch et al. Reference Frisch, Rudolphi, Sheil, Caruso, Thor and Gustafsson2015; Nascimbene & Marini Reference Nascimbene and Marini2015). However, in tropical conditions in Sri Lanka there is considerable variation in temperature and rainfall with topography interacting with altitude (De Rosyro Reference De Rosyro1958; Balasubramamium Reference Balasubramanium1991; Fernando Reference Fernando2010). This is demonstrated in the semi-evergreen climate zone, where plots with the same vegetation type occur across a wide altitudinal range. Even within the montane and submontane climate zones, altitude was not strongly correlated with lichen response.
The detectable but small impact of recent villages on lichens in three USE sites with no visible or documented internal disturbance to forests underscores the value of lichens as sensitive indicators of forest condition with respect to conservation. This novel outcome of our study also further emphasizes the conservation risks to remaining examples of this already heavily impacted natural vegetation type.
Indicator species and traits
Epiphytic lichens have often been used as indicators of long ecological continuity in both temperate and tropical forests (Index of Ecological Continuity: Rose Reference Rose, Brown, Hawksworth and Bailey1976; Rose & Coppins Reference Rose, Coppins, Nimis, Scheidegger and Wolseley2002). However, identification of lichens as specialist indicator species has often depended on expert knowledge rather than statistical analysis (Whittet & Ellis Reference Whittet and Ellis2013; Dymytrova et al. Reference Dymytrova, Brändli, Ginzler and Scheidegger2017). In the tropics, much of the dominant crustose lichen material is undescribed, so identification and description of taxonomic units is an essential prerequisite for identifying indicators associated with environmental conditions. Concurrent taxonomic work on Graphidaceae (now including Thelotremataceae) and other groups in Sri Lanka has made analysis at species level possible in this study (Weerakoon et al. Reference Weerakoon, Rivas Plata, Lumbsch and Lücking2012b, Reference Weerakoon, Wijeyaratne, Wolseley, Rivas Plata, Lücking and Lumbschc, Reference Weerakoon, Lücking and Lumbsch2014a, Reference Weerakoon, Jayalal, Wijesundara, Karunaratne and Lücking2015; Weerakoon Reference Weerakoon2013, Reference Weerakoon2015). Indicator species associated with undisturbed vegetation types in the Knuckles range can be used at local and regional levels to identify sites of high conservation importance. In a wider application to tropical forests, our results support the known value of Graphidaceae diversity as strong indicators of both natural and disturbed tropical forests (Wolseley et al. Reference Wolseley, Ellis and Chimonides2007; Rivas Plata et al. Reference Rivas Plata, Lücking and Lumbsch2008). In the present study, most species indicating vegetation types (Table 4) are difficult to identify, requiring field surveys by experts.
Patterns in our study relating to lichen morphology and photobionts are only partly evident, such as the dominance of trentepohlioid crustose lichens. The association with undisturbed forest of lichens with trentepohlioid photobionts has been observed in both tropical and temperate forests (Benítez et al. Reference Benítez, Prieto and Aragon2014, Reference Benítez, Aragón, González and Prieto2018; Wolseley et al. Reference Wolseley, Sanderson, Thüs, Carpenter and Eggleton2016). In Costa Rica, Rivas Plata et al. (Reference Rivas Plata, Lücking and Lumbsch2008) showed a strong correlation between lichen families and their environmental conditions; Thelotremataceae (now in Graphidaceae) was used to predict tropical forest types and disturbance levels. Species in Graphidaceae included strong indicators for every vegetation type in our study, and as many were indicators for moderately disturbed Cardamom plantations (Ca) as for undisturbed vegetation types. Lichens with chlorococcoid green-algal photobionts require high light conditions and are often associated with disturbance in both temperate and tropical conditions (Wolseley et al. Reference Wolseley, Moncrieff and Aguirre-Hudson1994, Reference Wolseley, Sanderson, Thüs, Carpenter and Eggleton2016; Wolseley Reference Wolseley1997; Nimis et al. Reference Nimis, Martellos, Spitale and Nascimbene2018) but this pattern is found only in the Ca plots, where the majority of these species are foliose. Cyanolichens are mostly dependent on high moisture availability, either as rainfall or as atmospheric humidity, and are widely used as indicators of ecological continuity in both temperate and tropical conditions (Marini et al. Reference Marini, Nascimbene and Nimis2011; Belinchón et al. Reference Belinchón, Coppins, Yahr and Ellis2016; Benítez et al. Reference Benítez, Aragón, González and Prieto2018). In the tropics cyanolichens are usually abundant at high altitudes where humidity and rainfall are often high, as in our montane and submontane zones. Many cyanolichens are niche specialists; their low cover values for entire plots in this study may have led to few species being identified as indicators. Although cyanolichen indicators in our study occurred in the montane and submontane climate zones, one species was counter to the typical pattern; the cyanolichen Lepidocollema marianum was an indicator in highly disturbed low-canopy Chena plots, which have almost no fog and a pronounced dry season. Foliose species are often associated with disturbed sites in tropical forests (Gradstein Reference Gradstein, Bates and Farmer1992; Dettki & Essen Reference Dettki and Esseen2003; Holz & Gradstein Reference Holz and Gradstein2005; Wolseley et al. Reference Wolseley, Ellis and Chimonides2007; Li et al. Reference Li, Liu, Wang, Ma and Song2011; Benítez et al. Reference Benítez, Aragón, González and Prieto2018). However, in this study a dominance of crustose species on trunks was apparent. Foliose indicator species were sparse in all vegetation types except moderately disturbed Ca, where forest trees were retained as shade trees. Fruticose species were also uncommon and indicated only undisturbed vegetation types in montane and submontane climate zones where rainfall is high. This might be partly due to sampling only quadrats on trunks; species of fruticose Usnea and Eumitria are often more abundant on branches.
Our prediction that indicators for undisturbed forests would primarily be specialists was supported; 84% of species indicating an undisturbed vegetation type had no indication value for broader groups of sites and most indicators were for undisturbed types only. Many of the crustose species in Graphidaceae are recently described and their distributions are currently unknown. Further work is needed to establish them as indicators of undisturbed forest in other tropical areas. In contrast, indicators of the most disturbed vegetation types are widespread across tropical regions of Asia and further afield (McCarthy Reference McCarthy2001; McCarthy & Mallett Reference McCarthy and Mallett2004; Singh & Sinha Reference Singh and Sinha2010). Even after 180 years of vegetation recovery, disturbed DMo had only seven indicators (12 for UMo) and several of these (e.g. Megalospora sulphurata, Parmotrema ravum, Pyrenula mamillana) are widespread in a range of tropical habitats. Disturbed Ca had the most indicators but these also include widespread species (e.g. species of Parmotrema). Although genus-level indicators should be used with caution, many species of Phaeographis and Sarcographa are associated with recently colonized vegetation across the tropics (Wolseley et al. Reference Wolseley, Ellis and Chimonides2007).
Although the use of indicators has been widely applied in temperate forests to identify undisturbed forests of conservation importance, this process in the tropics has been hampered by difficulties in the identification of species, especially crustose species which are often dominant in tropical conditions. In this study we have shown that we can use indicators at the species, genus or group level to indicate vegetation status with respect to disturbance in the Knuckles range. Our expectation is that, after suitable training, parataxonomists can record presence and estimate abundance at a site for at least two distinctive indicator species (Table 4), three genera (Tables 4 & 5) and two multi-genus groups (Table 5), making these useful for indication and an important contribution to conservation assessment. Following further testing, these may be more widely applicable. Relative abundance of the contrasting groups can generally indicate response of lichen communities to forest condition, and suggest where forest management should be improved (De Zoysa et al. Reference De Zoysa and Inoue2008). Protocols for field application should be tested before being widely applied in the Knuckles region (De Zoysa et al. Reference De Zoysa, Saubhagya and Inoue2014) and should not be applied outside that region without additional studies. Impacts of subtle disturbances such as those identified for undisturbed semi-evergreen forest (USE) adjacent to recent villages might not be detectable from such limited surveys by parataxonomists. Such cost-effective preliminary evaluations of forests can instead suggest where more thorough surveys by experts are most needed to support conservation and management decisions.
Conclusions
This study has shown that corticolous lichen diversity and community composition of tropical forests in Sri Lanka are strongly linked to vegetation type and tree species richness, as well as to disturbance history. Lichen species richness and abundance were higher in undisturbed vegetation types and in montane and submontane climate zones. Our study has identified two independent disturbance gradients; one linked to years from first disturbance and the other to distance from undisturbed forest, suggesting the importance of isolation and fragmentation in restricting lichen colonization. The subtle effects on lichen species in apparently undisturbed forests with recently established adjacent villages helped identify semi-evergreen forest as probably the most at-risk vegetation type studied.
The use of lichen bioindicators in the tropics has been hampered by the number of undescribed crustose species in tropical families, as well as by the lack of experts to identify the known species. Combining different analyses at several taxonomic levels, as well as trait-based characters, we have shown that the crustose corticolous lichens of tropical rainforests in Sri Lanka can be used as indicators of both vegetation type and anthropogenic disturbance. We have identified indicators at both species level and generic level, and as groups within the dominant family Graphidaceae, in addition to using photobiont and morphology traits.
The results of this study reinforce the importance of lichens as bioindicators of vegetation type in the tropics, anthropogenic disturbance in general, and to a lesser extent climate. Vegetation type was the most important factor generating indicator species, and disturbance was the strongest driver of larger scale patterns. Most strong lichen indicator species are associated with undisturbed sites which have long ecological continuity and a high diversity of both tree and lichen species. Forest management that maintained native canopy tree diversity, and continuity of lichen occupation, maintained many lichen species but was also associated with an absence of indicators for undisturbed forests. We identified species and genera that can be used by parataxonomists as indicators of disturbance type across the wide altitudinal gradient studied in the region, to facilitate rapid assessment and support improved management.
Acknowledgements
The research work was carried out with the assistance of funds from the University of Sri Jayewardenepura-SL (grant no.: ASP/06/2008/11). GW is grateful to the Department of Botany at Sri Jayewardenepura-SL, the Departments of Forest and Wildlife of Sri Lanka, the Field Museum of Chicago, USA, the British Lichen Society and the Natural History Museum, London. Extensive advice and assistance for lichen species identification were received from Thorsten Lumbsch, Andre Aptroot and Robert Lücking. Two anonymous reviewers are thanked for their constructive critiques that helped improve the paper. Sarah Friedrich prepared figures for publication.
Supplementary Material
Supplementary Material is found in two files. Supplementary Material Section S1, Details for Methods, includes Tables S1.1, S1.2 and S1.3. Supplementary Material Section S2, Details for Results, includes Tables S2.1, S2.2, S2.3, S2.4, S2.5, S2.6, S2.7, S2.8 and S2.9. To view Supplementary Material for this article, please visit https://doi.org/10.1017/S0024282920000109


