1. INTRODUCTION
A new scheme was proposed that high-energy electron beam as a probe used for time-resolved imaging measurement of high-energy density materials, especially for high-energy density matter and inertial confinement fusion (ICF) (Gai et al., Reference Gai, Qiu and Jing2014; Zhao et al., Reference Zhao, Cao, Cheng, Shen, Zhang, Zhao, Gai and Du2014a ,Reference Zhao, Zhang, Xu, Zhan, Gai, Qiu, Cao and Tang b ). High-Energy Density Physics aims to study the properties of matters under extreme temperature and pressure state, which is also called warm dense matter (WDM). The WDM produced in laboratory by laser or high-energy heavy ions beam (Sharkov et al., Reference Sharkov, Hoffmann, Goluber and Zhao2016) requires the energy density exceeds 1 Mbar and the transiently time scales on the 10 ns–1 µs. Therefore, the diagnostics system for WDM experiment should have a large dynamic range and high spatial resolution.
Especially for ICF, the compression of the target material by laser or heavy ions comes from many directions. It is essential to measure the compressed target moving boundary and check the symmetric compression in time. Therefore the time dependent and the three orthogonal directions or fully three-dimensional (3D) imaging systems are desirable (Zhao et al., Reference Zhao, Cao, Liu, Shen, Wang, Zong, Zhang, Jing, Cheng, Zhao, Zhang, Du and Gai2016a ,Reference Zhao, Zhang, Gai, Du, Cao, Qiu, Zhao, Cheng, Zhou, Ren, Huang, Tang, Xu and Zhan b ). Comparing with proton and some other X-ray diagnostics system, high-energy electron radiography system based on photocathode injector linear electron accelerator (LINAC) is expected to gain high spatial and temporal resolution with less expense (Merrill, Reference Merrill2015). The high-energy electron radiography (eRad) is first developed and tested by Los Alamos National Laboratory (Merrill, et al., Reference Merrill, Harmon, Hunt, Mariam, Morley, Morris, Saunders and Schwartz2007) for material study with 30 MeV electron beam and the spatial resolution was achieved about 100 µm. In order to develop higher energy eRad for WDM and ICF diagnostics, R/D of the eRad had been commenced by Institute of Modern Physics (IMP), Chinese Academy of Sciences (CAS), and Tsinghua University (THU) based on THU LINAC beam with about 40–50 MeV energy and picoseconds pulse-width bunch since the year 2014 (Zhao et al., Reference Zhao, Cao, Cheng, Shen, Zhang, Zhao, Gai and Du2014a ,Reference Zhao, Zhang, Xu, Zhan, Gai, Qiu, Cao and Tang b , Reference Zhao, Cao, Liu, Shen, Wang, Zong, Zhang, Jing, Cheng, Zhao, Zhang, Du and Gai2016a ,Reference Zhao, Zhang, Gai, Du, Cao, Qiu, Zhao, Cheng, Zhou, Ren, Huang, Tang, Xu and Zhan b ; Zhou et al., Reference Zhou, Du, Cao, Zhang, Huang, Chen, Cheng, Chi, Liu, Su, Tang, Tian, Wang, Wang, Xiao, Yan, Zhao, Zhu, Zhou, Zong and Gai2017). Two experiments with ~40 MeV electron beam were performed and the spatial resolution reached ~6 µm. They were the principle test and certified that this kind of LINAC with ultra-short pulse electron bunch (several picoseconds pulse width) can be used for eRad very well.
Several ultra-fast electron projection radiography experiments for plasma diagnostics have been performed by several laboratories, such as radiography of magnetic fields in high-intensity laser–solid interactions (Schumaker et al., Reference Schumaker, Nakanii, Mcguffey, Zulick, Chyvkov, Dollar, Habara, Kalintchenko, Maksimchuk, Tanaka, Thmos, Yanovsky and Krushelnick2013) and radiography of optical-field ionized plasmas (Centurion et al., Reference Centurion, Reckenthaeler, Trushin, Krausz and Fill2008). Compared with electron projection radiography, the imaging lens of the eRad system will greatly improve the spatial resolution. Therefore, we can get more and clearer target information from the eRad and it is feasible and useful for plasma diagnostics. Furthermore, the eRad in three orthogonal directions is also able to provide more target information and more powerful for other diagnostics application, such as experimental researches on mesoscal (~mm) materials and ultra-fast phenomena of chemistry and physics processes.
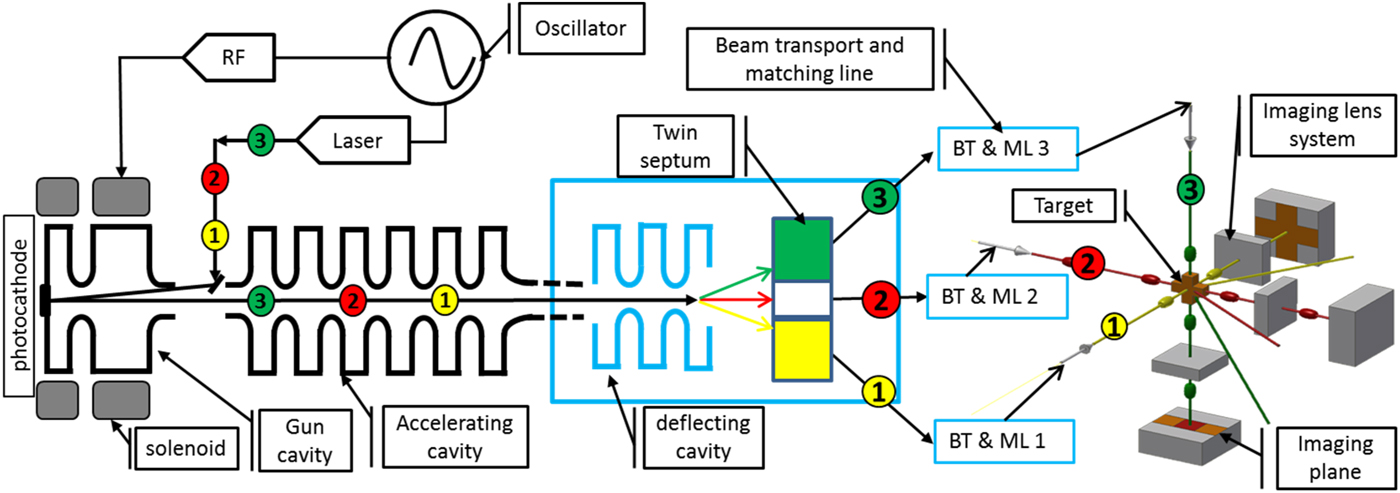
The conceptual design of three orthogonal directions eRad system is shown in Figure 1. It consists of LINAC based on photocathode injector, beam bunches split system [including transverse deflecting cavity (TDC) and twin septum magnet (TSM)], beam transport lines, and matching lines (BT&ML 1-3), the imaging lens system in three orthogonal directions, the target on the object planes and photons detector and charge-coupled device (CCD) cameras on the three imaging planes. The required parameters of the radiography system depend on the various applications. The principle of the eRad system is as following. The ultra-short pulse-width electron bunches are generated by the short pulses laser beam illuminated on the photocathode and then accelerated by the gun cavity and accelerating cavity to high energy. The time period of the electron bunches depends on the time sequence of the laser pulses and the frequency of the radio frequency (RF) cavity. For example, the bunches 1, 2, and 3 in one bunch train with time delay t are spread to three vertical positions (according to this design) with beam bunches split system for further three orthogonal directions beam transport shown in Figure 1. The bunch 1 is transported in the x-direction to the target and interacted with target, afterwards the scattered and forward passed through electrons are transported and imaged by imaging lens at the screen or detector at imaging plane position, and then the images are recorded by CCD camera in the x-direction. The bunches 2 and 3 are the same principle with bunch 1 to get images on z- and y-directions. So, the three orthogonal directions radiography are realized. Furthermore, the dynamic radiography can be achieved with some time delay or at the same time in three directions radiography by adjusting the beam transport time to the target, which makes the radiograph system very flexible in time sequence.

Fig. 1. Conceptual design of the three orthogonal directions high-energy electron radiography systems.
Here the ultra-fast beam bunches split system with TDC and TSM is studied, shown in Figure 1 in the blue square. Due to weak vertical kick by the limited deflecting voltage from TDC, it usually needs a long drift length to get enough spread distance among bunches. A TSM is added to shorten the drift distance and make the system more compact and effective. The detailed design and simulation study of the beam split is shown here.
2. KEY ELEMENTS OF THE ULTRA-FAST BEAM BUNCHES SPLIT SYSTEM
Usually the beam bunches are bent or separated by electromagnetic kicker. Because of the slowly rising time (~100 ns) of the electromagnetic kicker field, bunches separated cannot be achieved in shorter time interval (<100 ns) by these devices. The frequency of the RF cavity is normally 1–10 GHz, so the time interval of the two bunches can be as short as from nanoseconds to picoseconds. The TDC is chosen because it also works as a RF cavity and the fields change very fast. For compact three orthogonal directions eRad system, TDC and TSM are required for ultra-fast beam bunches split. Before showing the beam bunches split system design and simulation study, some basic knowledge of TDC and TSM is introduced.
2.1. Transverse deflecting cavitiy
The difference between a TDC and an accelerating cavity is that the TDC gives the beam transverse force to change the transverse trajectory and have no contribution to the beam acceleration. The TDC are required in accelerators for a variety of applications (Brut, Reference Brut2012), which need a time-dependent transverse deflection of charged particles, such as RF separators, RF-cavity-based bunch length and longitudinal phase space measurements, transverse and longitudinal emittance exchange, etc.
To provide transverse force to the charged particles, the transverse electric field and transverse magnetic field or both should be given by the Lorentz force equation
 $ {\bf F} = q \cdot ({\bf E} + {\bf v} \times {\bf B})$
, where q is the particles charge and
v
is the particles velocity. For vertical force, a vertical electric field and/or a horizontal magnetic field are required. Most dipole modes in cavities have both the transverse electric and transverse magnetic field at the center. However, these two kinds of field can either add constructively or cancel each other. In order to find the transverse kicker, the Panofsky–Wenzel theorem is used to define the transverse voltage V
y
to the transverse variation of the longitudinal field, shown in Eq. (1).
$ {\bf F} = q \cdot ({\bf E} + {\bf v} \times {\bf B})$
, where q is the particles charge and
v
is the particles velocity. For vertical force, a vertical electric field and/or a horizontal magnetic field are required. Most dipole modes in cavities have both the transverse electric and transverse magnetic field at the center. However, these two kinds of field can either add constructively or cancel each other. In order to find the transverse kicker, the Panofsky–Wenzel theorem is used to define the transverse voltage V
y
to the transverse variation of the longitudinal field, shown in Eq. (1).
 $$V_y = \int F_y /q \cdot dz = \int (E_y + c \times B_x ) \cdot dz = - \displaystyle{{ic} \over w} \int (\nabla _t E_z ) \cdot dz.$$
As the transverse voltage is proportional to the gradient of E z , it is clear that TE modes, which do not have longitudinal electric fields, cannot be used to provide a transverse deflection. For a pillbox cavity the TM dipole mode is used. The 6 × 6 beam transport matrix (Cornacchia and Emmma Reference Cornacchia and Emmma2002) is shown in Eq. (2) for a vertical deflecting cavity, from which the beam parameters rough evolution after TDC can be easily understood. Beam in the x-direction is not effected by TDC, like a drift; in the y-direction the position y and divergence y′ are changed by TDC with respect to beam position z. The momentum spread is determined by beam vertical coordinate y, vertical divergence y′, and longitudinal position z.
 $$\left[ {\matrix{ x \cr {\matrix{ {x^{\prime}} \cr {\matrix{ y \cr {\matrix{ {y^{\prime}} \cr z \cr {\rm \delta} {p} \cr}} \cr}} \cr}} \cr}} \right] = \left[ {\matrix{ {\matrix{ 1 & {l_s} & 0 \cr 0 & 1 & 0 \cr 0 & 0 & 1 \cr}} & {\matrix{ 0 & {\; \; \; \; \; \; \; \; \; 0} & {\; \; \; \; \; \; \; \; \; 0} \cr 0 & {\; \; \; \; \; \; \; \; \; 0} & {\; \; \; \; \; \; \; \; \; 0} \cr {l_s} & {Kl_s /2} & {\; \; \; \; \; \; \; \; \; 0} \cr}} \cr {\matrix{ 0 & 0 & 0 \cr 0 & 0 & 0 \cr 0 & 0 & K \cr}} & {\matrix{ 1 & K & \;\;\;\; 0 \cr 0 & 1 & \;\;\;\;0 \cr {Kl_s /2} & {K^2 l_s /6} & \;\;\;\; 1 \cr}} \cr}} \right]\; \left[ {\matrix{ x \cr {\matrix{ {x^{\prime}} \cr {\matrix{ y \cr {\matrix{ {y^{\prime}} \cr z \cr {\rm \delta} {p} \cr}} \cr}} \cr}} \cr}} \right]_0 $$
l s is the TDC structure length and K = eV 0 k/p 0 c, V 0 is the total defecting voltage, shown in Eq. (1), k is the wave number k = 2πf/c.
The principle of TDC for beam bunches split is shown in Figure 2. When an electron bunch propagates through the traveling wave structure, the electrons always see a constant phase of the deflecting force (assuming the bunch length can be neglected compared with TDC wavelength). So if one bunch starts to propagate through the structure at some TDC RF phase, when all the RF fields are zero, this bunch will not be deflected. But if one bunch comes to the structures at some other TDC RF phase, this bunch will always see the RF fields at this phase and will be deflected by a nearly constant force along the structure.
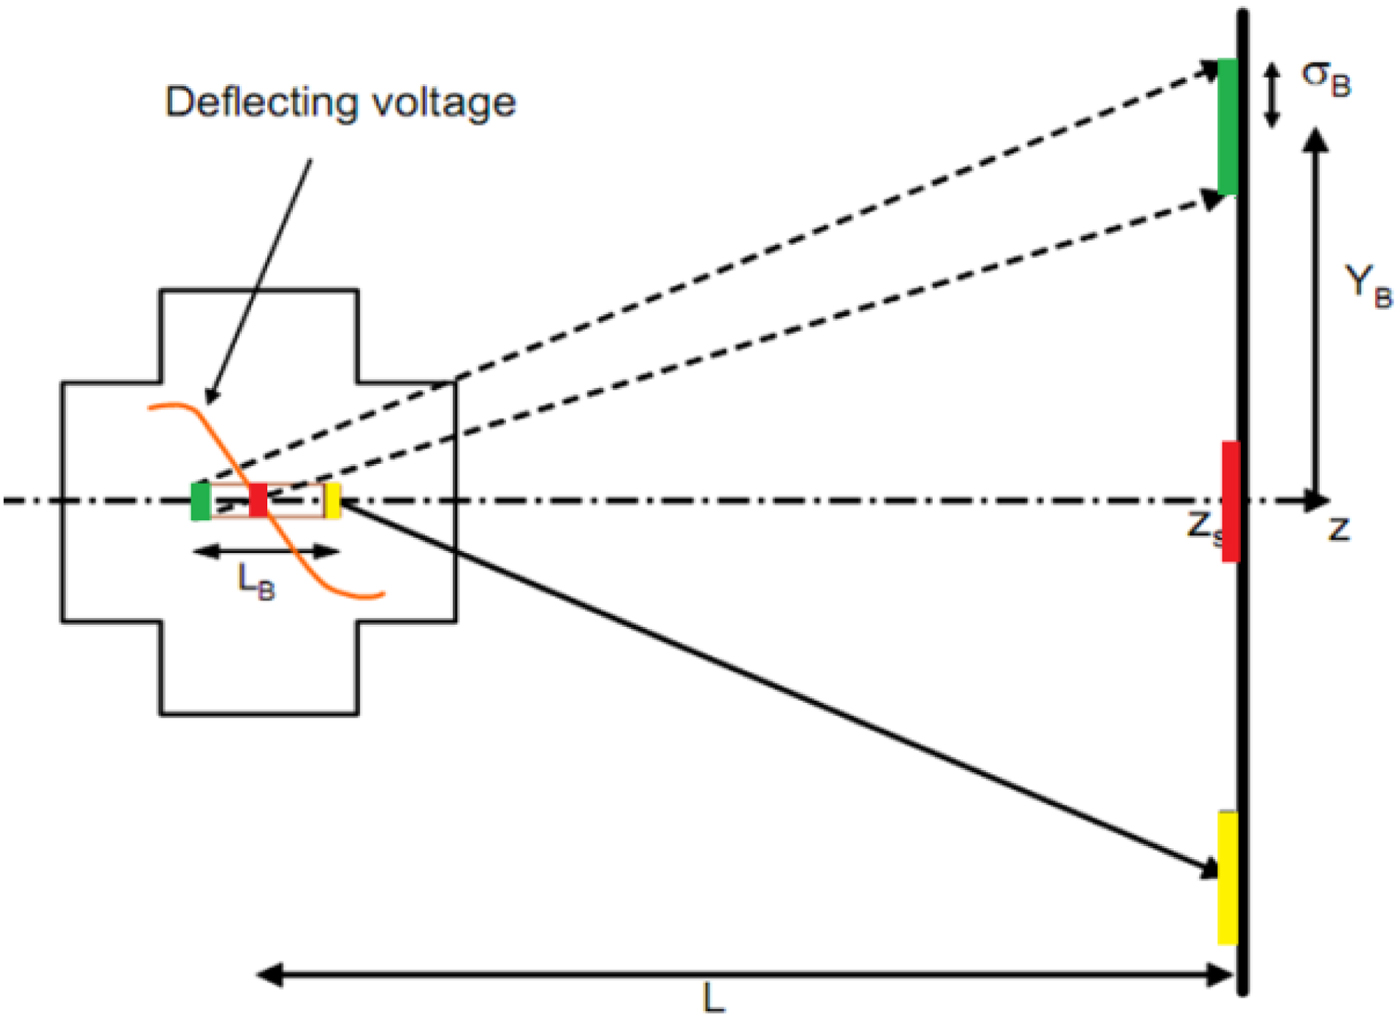
Fig. 2. The principle of TDC used for beam bunches split.
Figure 2 shows how a vertical deflector separates three bunches with short bunch interval L B/2 to three directions. The beam bunches vertical mean position Y B after TDC and drift distance L is defined with Eq. (3), the second bunch is on the zero-cross phase of TDC and the first and third bunches (from right to left) is on the zero-cross phase plus and minus 90° degree phase. So the second bunch is non-deflected, the first and third bunches have maximum vertical deflection in the negative and positive directions.
 $$Y_{\rm B} = \displaystyle{{e{\rm \;} V_{y\;} {\rm \pi} \; f_{{\rm RF\;}} L_{\rm B}} \over {{\rm \beta} ^3 \; E\; \; c\;}} \; L\;, $$
where V y the transverse deflecting voltage, depends on TDC dipole mode fields, f RF TDC frequency, L is the distance from TDC center to the observation position and E is the beam energy.
2.2. Twin septum magnet
The deflection force is weak in a TDC cavity because of the limited maximum RF power. Due to this small vertical kick, it needs a long drift distance for enough vertical separated distance among the three bunches. This will make the split system very long and also degrade the beam quality. In principle, a vertical dipole magnet can be added to the beam line at certain position after the TDC and it will give additional vertical kick to get enough vertical separated distance with short drift distance for one direction split bunch. Because the beam bunches after the TDC will propagate in three ways and they are still limited by small separated distance among each other, the TSM is chosen instead of the dipole. The TSM was proposed for early multi-axis advanced radiography (Wang et al., Reference Wang, Lund, Caporao, Chen and Poole1999) and beam spreader for multi-beam lines X-ray free-electron laser (Placidi et al., Reference Placidi, Jung, Ratti and Sun2014). There are also some designs and test of the TSM, which prove this method is feasible in technology. In Figure 3, the transverse cross-sectional view of two kinds design of vertical TSM (Wang et al., Reference Wang, Lund, Caporao, Chen and Poole1999; Placidi et al., Reference Placidi, Jung, Ratti and Sun2014) are shown, upper and down parts are the opposite vertical deflection areas and the center is field-free area.
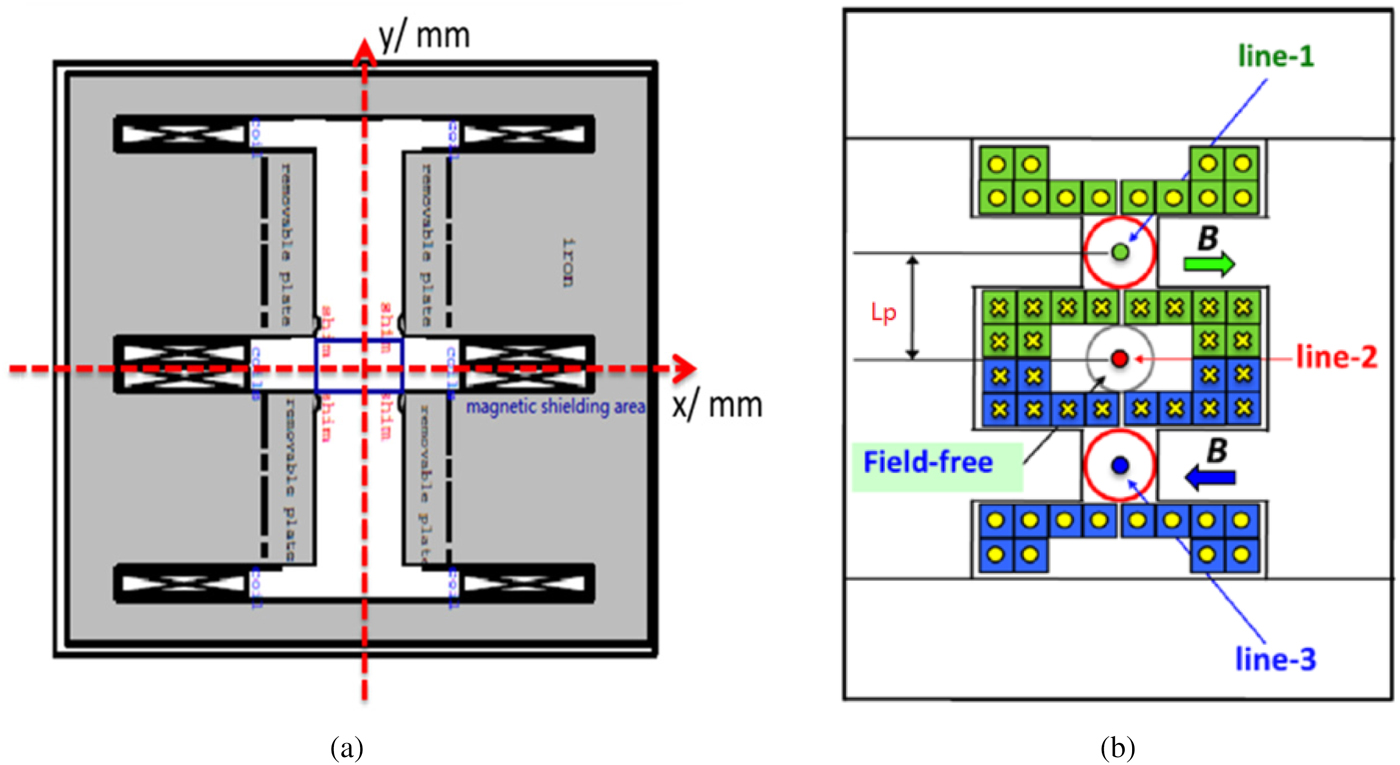
Fig. 3. Two kinds of vertical TSM design and transverse cross-sectional view, the beam transport direction is toward into the paper.
Figure 4 shows the simplified sketch map of the transverse x- direction magnetic fields distribution along the y-direction in TSM. The upper and down beam pipes with uniform magnetic fields in the transverse x-direction but opposite polarity for increasing the vertical beam deflection and the center beam pipe is field-free for non-deflected beam transport.
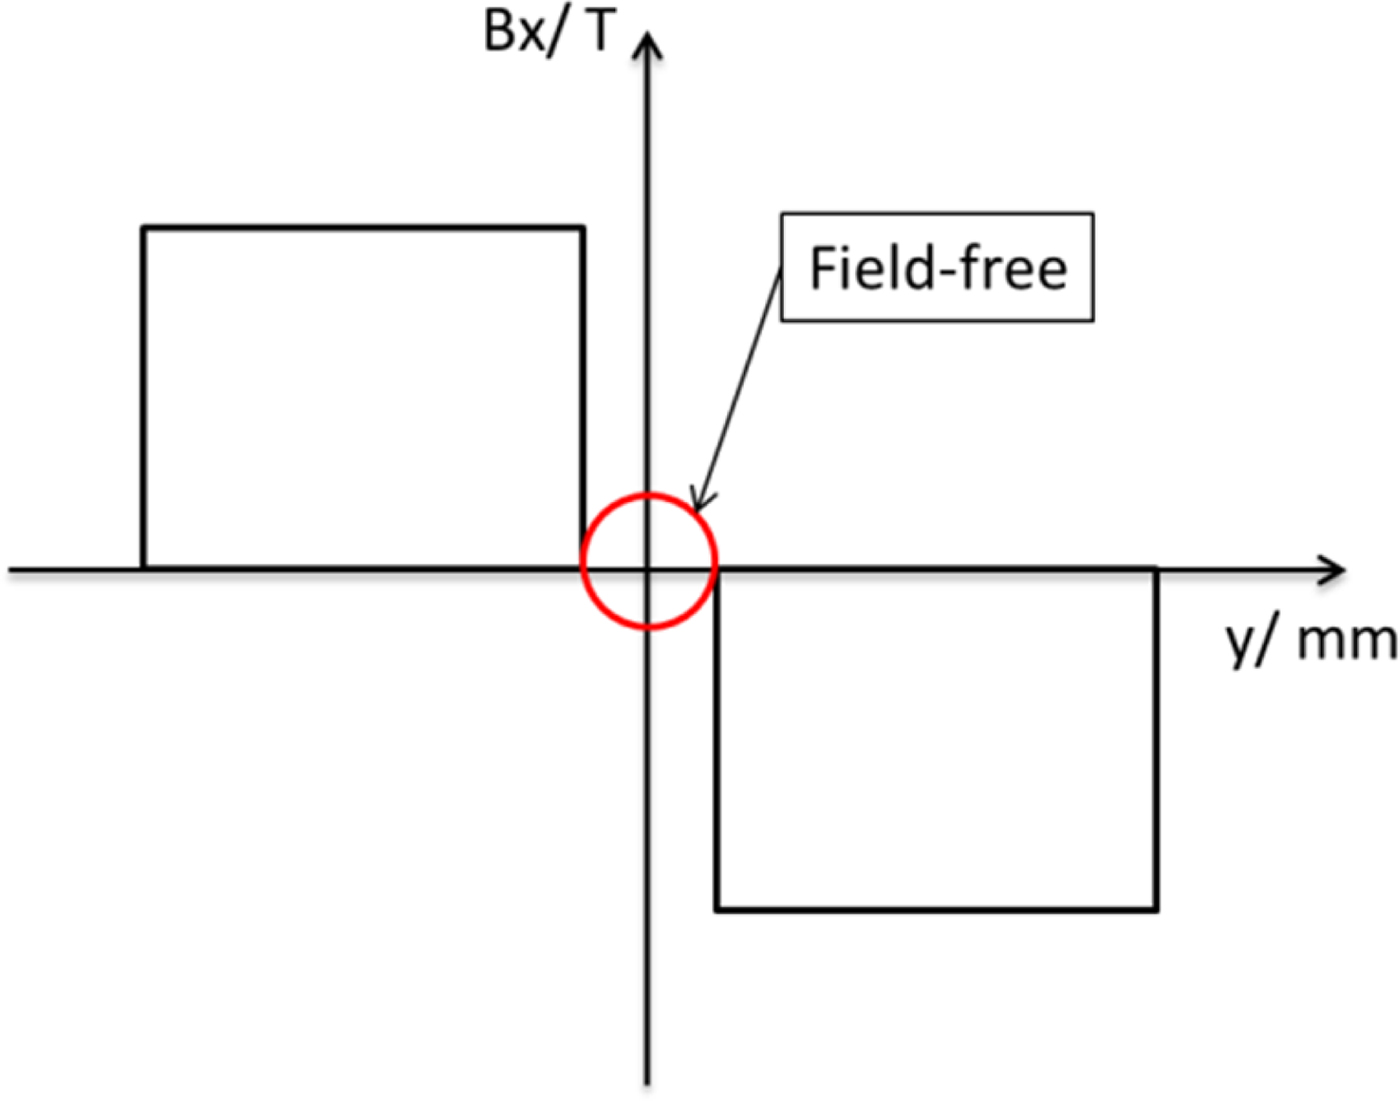
Fig. 4. The simplified sketch map of the magnetic field B x distribution along the y-direction in TSM.
3. BEAM BUNCHES ULTRA-FAST SPLIT SYSTEM DESIN AND SIMULATION
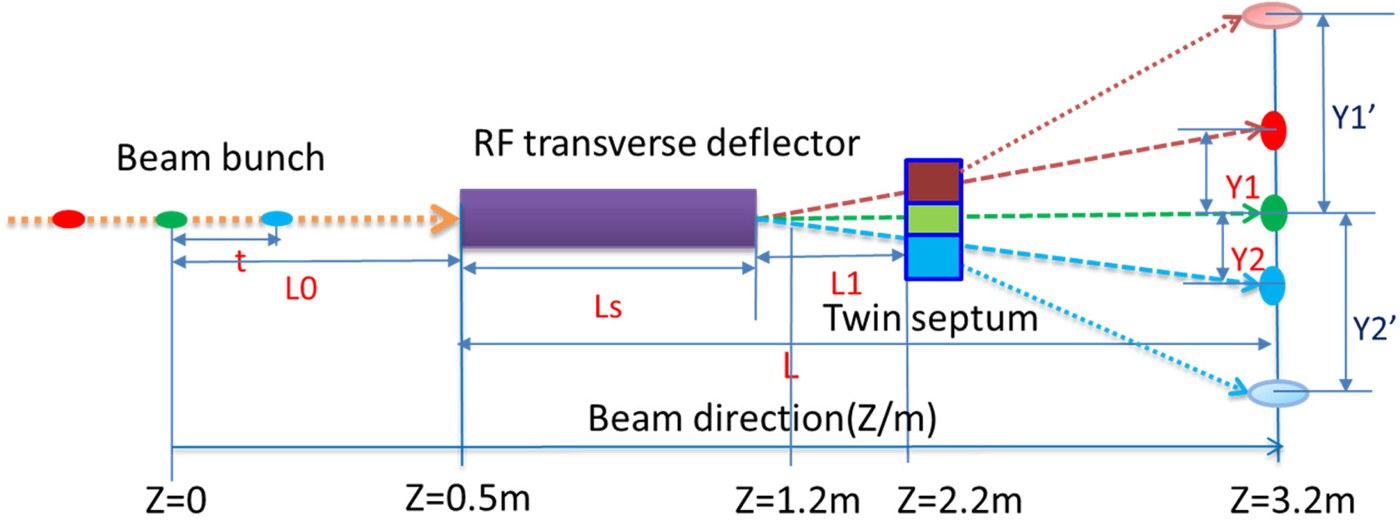
The design and layout of the beam bunches split for simulation study are shown in Figure 5. Three bunches in a bunch train with time interval t among each other are in front of the TDC and the distance from the center bunch (s) to the TDC is 0.5 m. The TDC is 0.53 m long. After TDC if without the TSM the beam bunches will be on the Y1, zero, and Y2 positions, which are the bunches mean vertical positions at z = 3.2 m, but with TSM the beam bunches will be on the Y1′, zero and Y2′ positions. The simulation study was done by ASTRA (Floettmann Reference Floettmann2016) with a 3D TDC field map. Initial beam parameters used for simulation study are as following: the electron beam energy is 40 MeV with Gaussian distribution in both transverse and longitudinal. Beam bunch charge is 1 nC, rms beam size is 0.75 mm, energy spread is 50 keV, normalized transverse emittance is 1.0 mm mrad, and the rms bunch length is 0.88 mm, by which the beam parameters evolution with the beam split system can be studied.

Fig. 5. The design and layout of the beam bunch split for simulation study.
3.1. Beam bunches split with TDC
For beam bunches split simulation study, the 3D fields map of the TDC same as PITZ (Photo Injector Test facility, Zeuthen, DESY) TDC was used. The TDC is a traveling wave 3 GHz RF copper structure with two stabilizing holes to have the RF field mode with vertical deflecting electric field. It operates at 2π/3 modes. More details of the structure parameters and fields distribution can be found in references (Malyutin Reference Malyutin2014; Huck et al., Reference Huck, Asova, Bakr, Boonpornprasert, Donat, Good, Gross, Hernandez-Garcia, Isaev, Jachmann, Kalantaryan, Khoyoyan, Koehler, Kourkafas, Krasilnikov, Malyutin, Melkuyan, Oppelt, Otevrel, Pohl, Renier, Rublack, Schultze, Stephan, Trowitzsch, Vashchenko, Wenndorff, Zhao, Churannov, Kravchuk, Paramonov, Rybakov, Zavadtsev, Zavadtsev, Lalayan, Smirnov, Sobenin, Gerth, Hoffmann, Hunig, Lishilin and Pathak2015). The deflecting voltage is set to 2.55 MV, corresponding to 5 MW in the cavity for the simulation.
A 2.7 m long beam bunches split system is designed for 40 MeV energy beam transport. Firstly, the beam bunches split only with TDC are simulated to get the bunches separated vertically. The distance parameters shown in Figure 5 are as following: L 0 is 0.5 m, L s is 0.53 m, L 1 is 1.17 m, and L is 2.7 m. The first and most important step is to define the zero-cross phase of the TDC, which means at that TDC RF phase, the beam mean vertical position after TDC is zero, which is used for synchronization for other two bunches. The beam mean vertical position as a function of the TDC phase by ASTRA simulation is shown in Figure 6 as a linear fit, by which the zero-cross phase can be calculated. In the simulation set up, the zero-cross phase for the second bunch is at 58.13°. This method is also useful in the experiment to define the zero-cross phase in line.
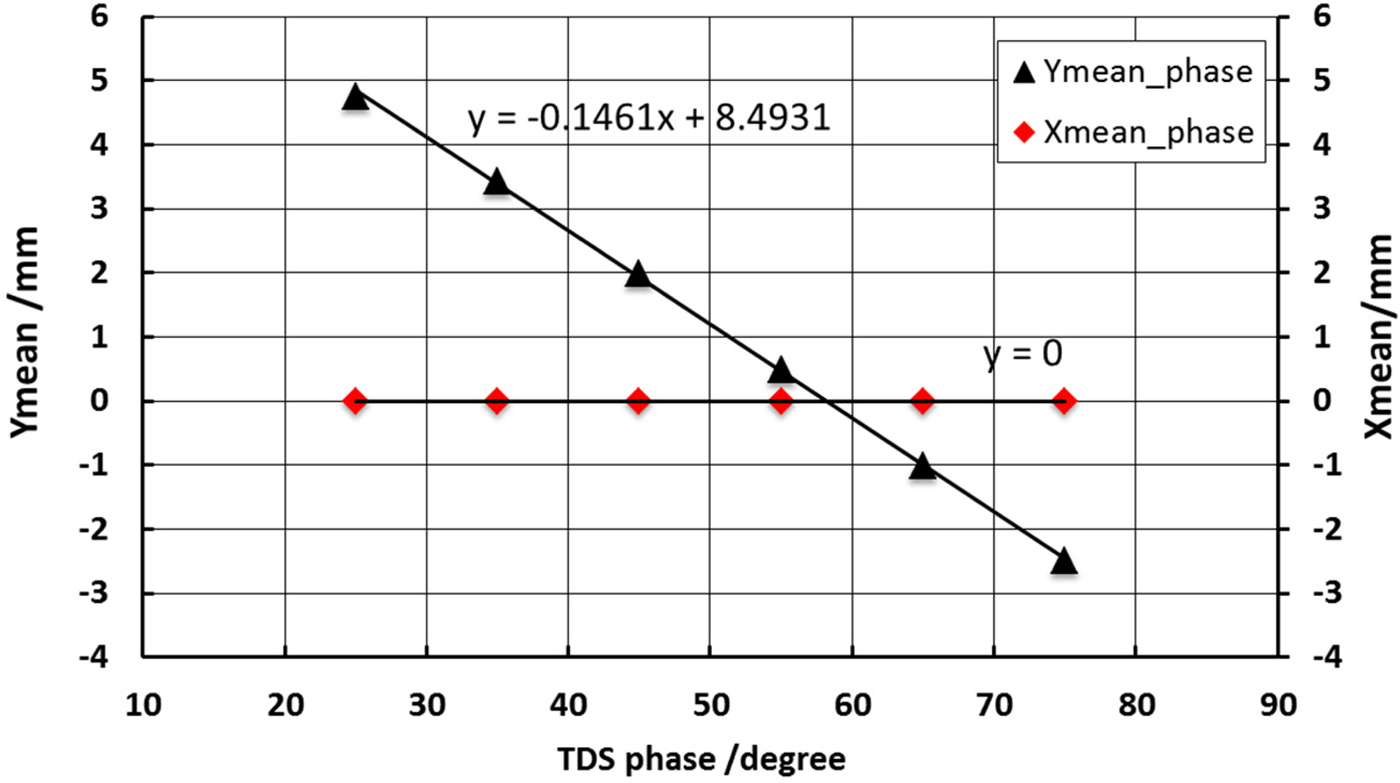
Fig. 6. Beam mean vertical and horizontal positions as a function of the TDC phase at z = 2.2 m position.
If the bunches 1 (red) and 3 (blue) can be deflected to the opposite side with maximum deflection angle, the time relationship of the bunches interval t and the TDC frequency should satisfy Eq. (4) with respect to the zero-cross phase.
 $$2\pi f_{\rm tdc} \cdot t = \left\{\matrix{\left(\displaystyle{2N + 1 \over 2} \right)\cdot \pi, &\hbox{negative maximum deflection} \cr N\cdot \pi, &\hbox{no deflection} \cr \left(\displaystyle{2N - 1 \over 2} \right) \cdot \pi, &\hbox{positive maximum deflection},} \right.$$
where N is the integer.
The time interval of bunches in a bunch train depends on the laser frequency and the LINAC. Therefore the TDC frequency can be selected to match the beam bunches period or change bunches time interval to match the TDC frequency. In the simulation study, the TDC frequency is 3 GHz and the shortest bunches interval is calculated as t = N/4f tdc, when N is one, t equals to 83.3 ps. So with 3 GHz TDC the beam bunches interval longer than 83.3 ps times N (N is the integer) can be separated into one of the three directions.
The first (red) bunch is in minus 90° with respect to TDC zero-cross phase, and the third (blue) bunch is in plus 90° with respect to TDC zero-cross phase in simulation. The simulation was done by change the TDC phase with respect to the zero-cross phase, which is equivalent to the bunches with corresponding time interval t with respect to the z position for zero-cross phase bunch (second one). The beam vertical mean position at positive maximum deflection is 2.58, 8.68, and 14.78 mm at z position of 1.2, 2.2, and 3.2 m, respectively. The beam parameters after TDC at three positions are shown in Table 1. From the simulation results, it is clearly shown that, with long drift distance the larger vertical separated distance can be achieved, but the beam energy spread and emittance are also increased. For the non-deflected beam, the y-direction emittance is changed because of the the beam y–z distribution exchange due to deflection (the non-deflection means after TDC the vertical beam mean position is zero, but the bunch head and tail are still deflected).
Table 1. Beam parameters after TDC at three z-positions without TSM
3.2. Beam bunches split with TDC and TSM
From the above simulation, at z = 3.2 m, the separated bunch from the positive or negative directions to center is 14.78 mm. For further beam transport to the target, the space is not enough to put other focusing or bending magnets. Hence, the TSM is added after 1.17 m distance of the TDC, at z = 2.2 m, shown in Figure 5.
The magnetic fields distribution of TSM for simulation is shown in Figure 7, with uniform fields and fringe fields but opposite polarity field in upper and down bending area. The amplitude is 0.1 T. The gap distance of the field-free area is 10 mm, which is constrained by the upper and down beam vertical position at the entrance of the TSM at 2.2 m and the space for the septum plate (thickness is about 2 mm with or without some magnetic shielding material). The same simulation procedure as only with TDC was done, and the vertical mean beam positions along the beam line is shown in Figure 8. At z = 3.2 m position, the vertical separated distance from the positive or the negative to the center is 85.32 mm.
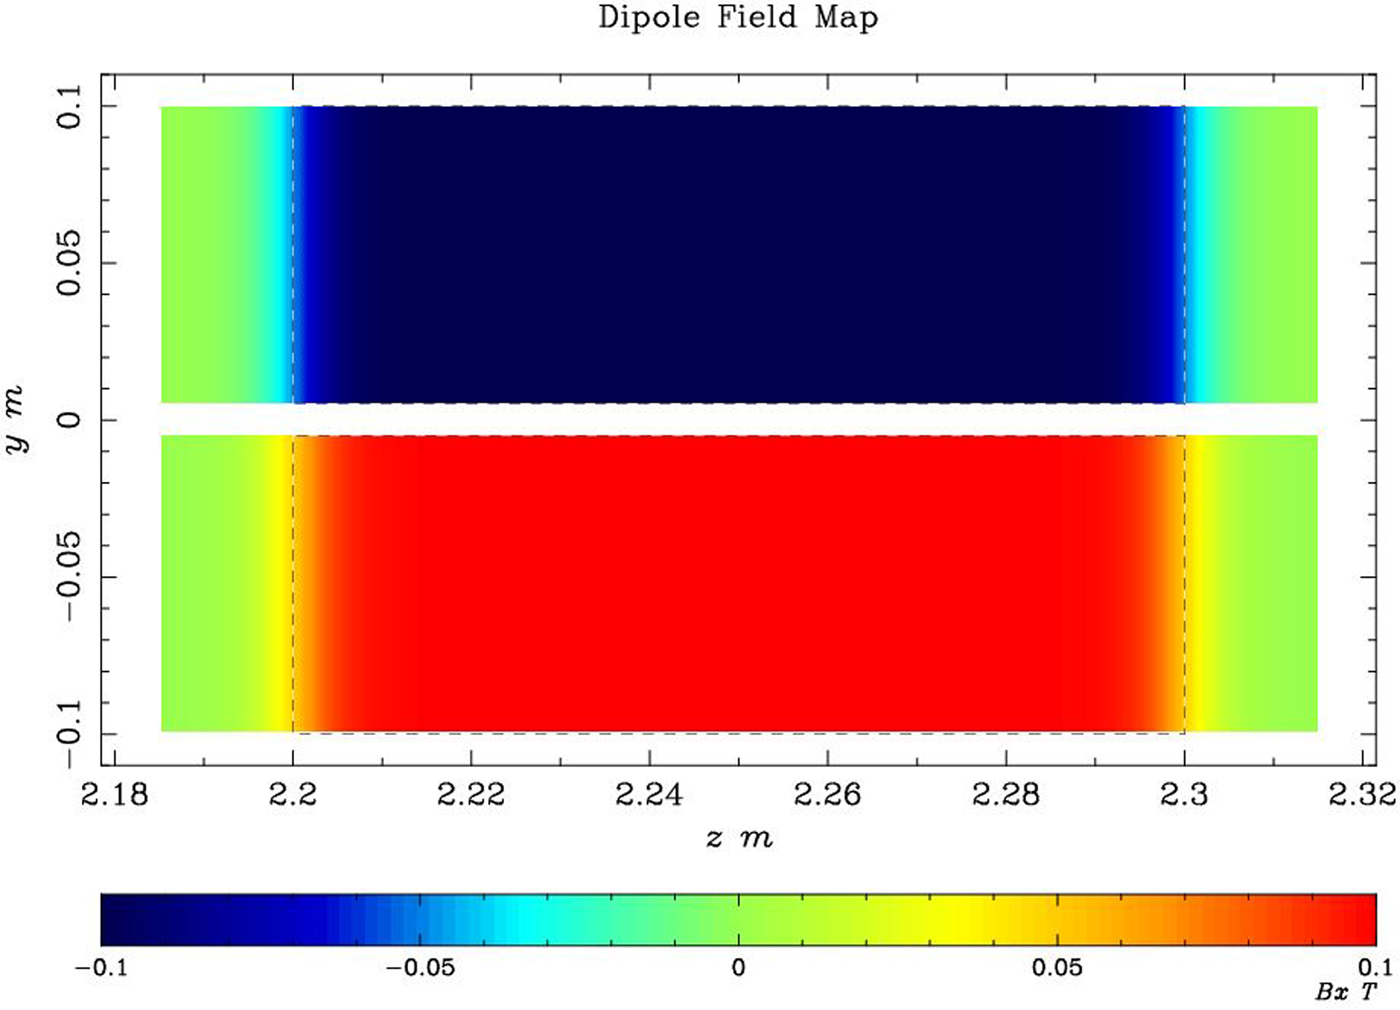
Fig. 7. The magnetic fields B x distribution of the TSM in the z–y-plane used for simulation.
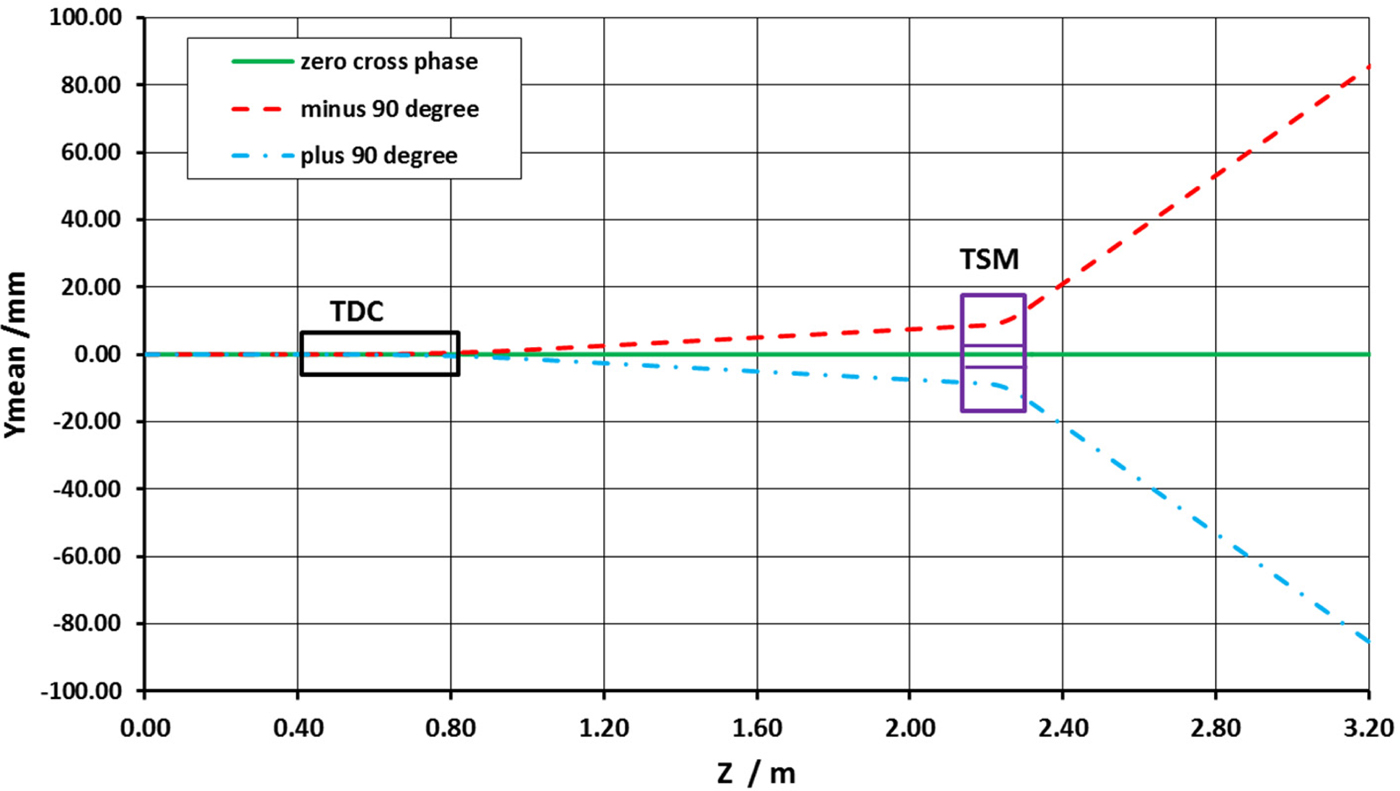
Fig. 8. Simulated beam vertical mean position along the beam line with TDC and TSM for three TDC phases.
The overall beam distribution and phase space of the upper split beam with TDC and TSM at z = 3.2 m is shown in Figure 9 and the beam parameters are in shown Table 2, compared with the beam split without TSM. It is indicated that the separated distance is drastically increased with TSM. The TSM will induce energy dispersion in the beam line, so more attention should be paid for the subsequent beam transport and beam matching line (BT&ML 1, 2, and 3 in Fig. 1) design for eRad, which is not included in this paper. In the simulation, the non-deflected beam parameters are almost same with TSM and without TSM.

Fig. 9. The overall phase space and particle distribution of the positive vertical deflected bunch with TDC and TSM at z = 3.2 m in local cordinate.
Table 2. The beam bunch parameters at z = 3.2 m position with and without TSM
From particle-tracking simulation, the beam parameters can be gotten at arbitrary positions. This will be useful for subsequent beam transport design in reference coordinate with Courant–Snyder parameters and also proved that this design and simulation method is helpful for the whole eRad system development. The emittance of non-deflected beam in the y-direction is increased a lot, which can be restrained by other y-plane focusing quadrupoles in further beam transport beam line.
4. CONCLUSIONS
The conceptual design of compact three orthogonal directions eRad system was proposed for WDM, ICF, and other dynamics diagnostics study. One of the critical technologies, the ultra-fast beam bunches split from the bunch train (bunches interval about picoseconds to nanoseconds) is studied, which could be transported to three orthogonal planes of the target for dynamic radiography. The key elements of the bunches split are TDC and TSM. The principle of TDC and TSM are briefly introduced. An example of beam bunches split system design with TDC and TSM for test experiment (40 MeV energy electron) is achieved and studied by particle-tracking simulation, by which it confirms this method is valid and feasible. With TSM, the length of the whole system can be reduced drastically, which is more efficient for compact three orthogral directions radiography system. The evolution of the beam parameters along the beam line is also studied here, which is useful for subsequent beam transport and matching beam line design for the whole system. The details of the design and simulation study in this paper will be helpful for the principle experimental test and the development of future higher energy three orthogonal directions or fully 3D eRad system.
ACKNOWLEDGMENTS
The work is supported by the National Natural Science Foundation of China (grant numbers 11435015 and 11505251) and the National Instruments major project 11427904. One of the authors Q. Z. would like to thank DESY, PITZ group for providing the experiment experience with photo injector and TDC.