INTRODUCTION
For a long time, there was a pervasive thought among ecologists: natural ecosystems would, through succession, reach a mature state or climax, and stay there in the absence of significant disturbance (Clements Reference CLEMENTS1916). Nowadays, it is understood that ecosystems change continuously from one state to another (Anderson et al. Reference ANDERSON, GOUDIE and PARKER2007, Magurran & Dornelas Reference MAGURRAN and DORNELAS2010), and are highly dynamic in response to fluctuating environments (Yachi & Loreau Reference YACHI and LOREAU1999). The effects of temporal variation in environmental quality have been studied for single species at the population and metapopulation level (Buckley & Beebee Reference BUCKLEY and BEEBEE2004, Hare et al. Reference HARE, HOARE and HITCHMOUGH2007, Prugh et al. Reference PRUGH, HODGES, SINCLAIR and BRASHARES2008). There have, in contrast, been relatively few attempts to explore the effects of fluctuating environments in community and metacommunity terms, in part because they are more difficult to comprehend, frame and analyse (but see Magurran & Henderson Reference MAGURRAN and HENDERSON2010, Presley et al. Reference PRESLEY, HIGGINS and WILLIG2010, Varughese Reference VARUGHESE2011). This is especially true for Neotropical amphibian communities, for which we have very little knowledge of temporal dynamics based on systematic, standardized sampling. Here we set out to address this knowledge gap by the analysis of 2 y of transect data from two protected areas in Chiapas, Mexico.
A metacommunity is a set of communities conceived of as being linked by periodic dispersal (Leibold & Mikkelson Reference LEIBOLD and MIKKELSON2002, Leibold et al. Reference LEIBOLD, HOLYOAK, MOUQUET, AMARASEKARE, CHASE, HOOPES, HOLT, SHURIN, LAW, TILMAN, LOREAU and GONZALEZ2004, Presley et al. Reference PRESLEY, HIGGINS and WILLIG2010, Resetarits et al. Reference RESETARITS, BINCKLEY, CHALCRAFT, Holyoak, Leibold and Holt2005). A community is a set of species populations occupying a particular habitat patch which, in theory, have full opportunity to interact with one another (Holyoak et al. Reference HOLYOAK, LEIBOLD, MOUQUET, HOLT, HOOPES, Holyoak, Leibold and Holt2005).
Within a fragmented landscape, local communities are restricted to certain spatial units, or patches (e.g. forests, open areas), defined by environmental boundaries reflecting for example, local hydrology, microclimate, soils, etc. (Pickett & Cadenasso Reference PICKETT and CADENASSO1995, Welsh et al. Reference WELSH, HODGSON and LIND2005). Herein we explore how amphibian metacommunities respond to fluctuating environments through the evaluation of their structure within the landscape. Changes in the emergent properties of the metacommunities can be quantified by means of a recently developed analytical framework permitting classification of metacommunities in relation to two opposed foundational theories of community organization. These theories are attributable to Clements (Reference CLEMENTS1916) and Gleason (Reference GLEASON1917, Reference GLEASON1926), respectively. They are first, communities as ‘super-organisms’ responding to environmental gradients as a coherent unit, in contrast to second, the individualistic concept of the community, within which each species is viewed as responding individualistically (Leibold & Mikkelson Reference LEIBOLD and MIKKELSON2002, Presley et al. Reference PRESLEY, HIGGINS and WILLIG2010). In places where seasons are clearly defined, i.e. in this case dry vs. rainy seasons, local climatic boundaries can change drastically, affecting the dispersion of species across the landscape. Seasonality affects everything, from simply humidity and solar radiation, to the distribution of predators (García & Cabrera-Reves Reference GARCÍA and CABRERA-REVES2008). It is also well known that most amphibians respond to rain for mating (Duellman & Trueb Reference DUELLMAN and TRUEB1994, Stebbins & Cohen Reference STEBBINS and COHEN1997).
We hypothesize that if the conditions of the environment change, amphibian distributions will change within the landscapes. If they do, it is of interest to determine the impact on metacommunity patterns, with three possible outcomes: (1) the organizational structure and relationships with environment remain constant but the populations shift around spatially (displacement), or (2) the constituent communities demonstrate change in structural properties and relationships with environment (flux), or (3) some combination of displacement and flux. Thus, in this paper we evaluated: (1) how the metacommunities change year to year in two landscapes in the south of Mexico; and (2) how metacommunity patterns respond to temporally variable factors, such as rainfall and temperature.
METHODS
Study site
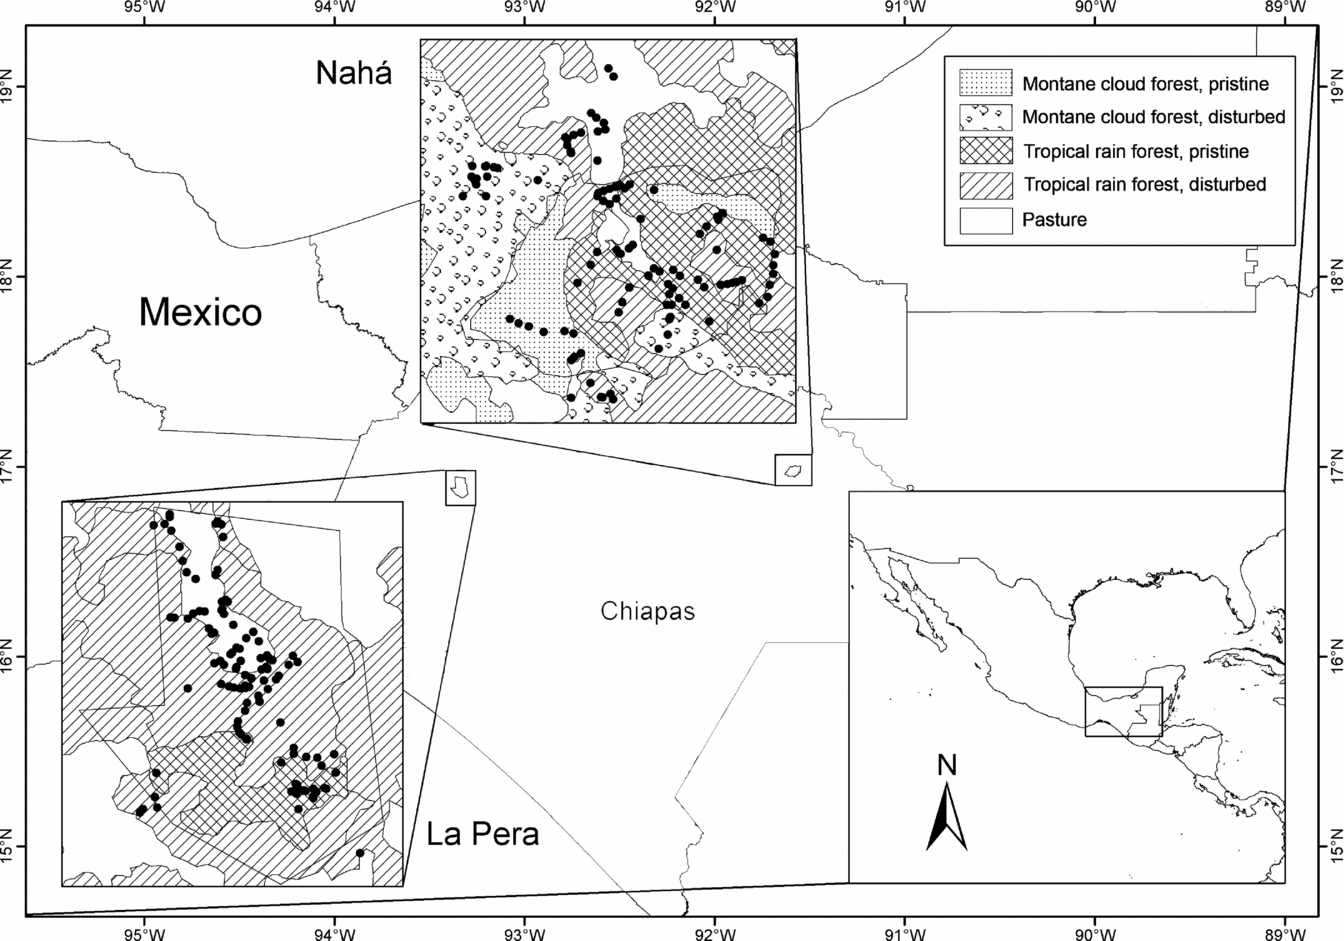
The fieldwork was carried out in two natural protected areas (PAs) of Chiapas (~ 17ºN), south Mexico (Figure 1): La Pera, a state PA, and the Nahá biosphere reserve. The topography of both regions is complex and the altitude ranges are 500–1200 m asl and 700–1250 m asl, respectively. La Pera is an area of 7506 ha containing pristine and disturbed patches of two natural vegetation formations: tropical rain forest and evergreen seasonal forest (CONANP 2006). The area encompasses two climatic zones: warm–humid, with the rainy season in June–September, and warm–sub-humid, with more than 50% of the annual rainfall occurring in July–October (García Reference GARCÍA1988). Nahá is located in the north-west of the Lacandona region and has an area of 3847 ha. The vegetation types are tropical rain forest, montane cloud forest, pine–oak forest and disturbed vegetation commonly known in Mexico as acahuales (CONANP 2006). The area has a hot sub-humid climate with June–September rainfall and a humid period from May to December (García Reference GARCÍA1988). In order to sample approximately the same area in both landscapes, some areas outside the Nahá PA were also sampled.

Figure 1. Location of the landscapes sampled, La Pera to the west and Nahá towards the east.
Field-sampling
The sampling was performed within the rainy season, June–September, in both 2009 and 2010, only at night. We mostly sampled within transects of 50 × 2 m, but in cases where the characteristics of the site did not permit their use, we used plots of 10 × 10 m. The sampling was performed in forested (interior), edge (as the outer 20 m of a forested patch) and transformed/disturbed areas (matrix habitat). Time was not controlled during sampling, as the aim was to locate and record all amphibians present. In La Pera a total of 30 patches were sampled and in Nahá 31. Four to five transects were sampled per patch depending on the size of the patch. We did not mark any specimen so potential double recordings are possible.
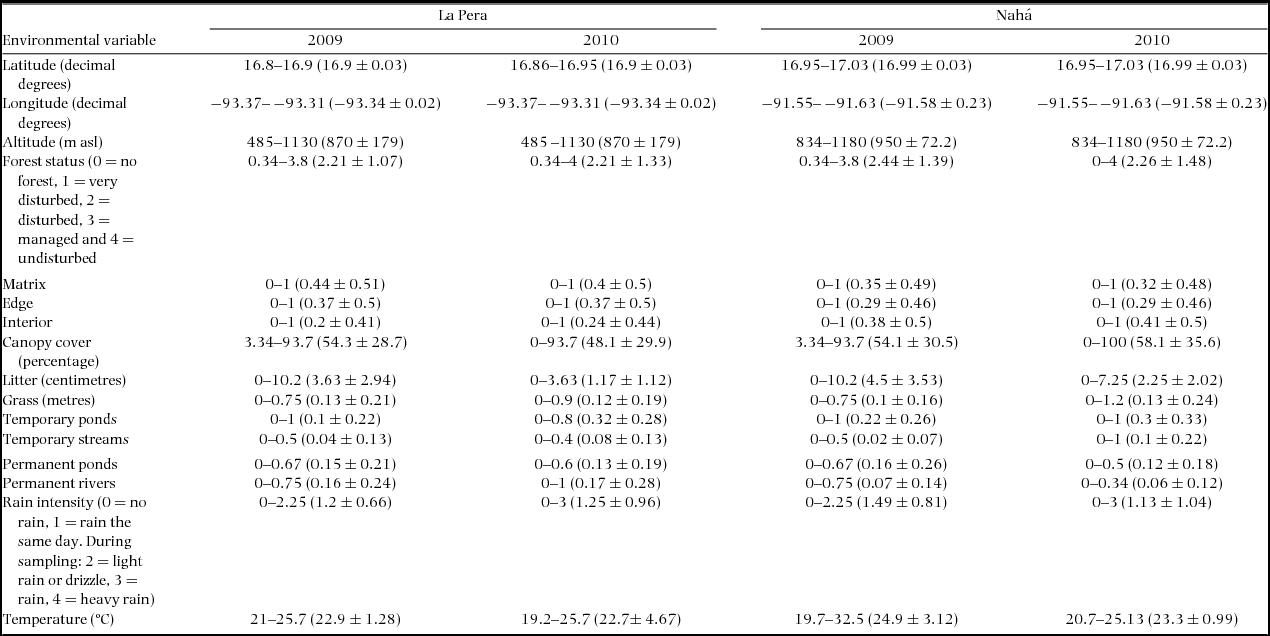
The environmental variables measured were: latitude (Y); longitude (X); altitude; rain intensity measured using a categorical classification: no rain (0), rain the same day (1), and, at the moment of sampling, light rain or drizzle (2), rain (3), heavy rain (4); local temperature (measured with data loggers LogTag HAXO-8); forest status divided into: no forest (0), very disturbed with <20% forest cover (1), disturbed with <50% forest cover (2), managed –areas where it was possible to observe logging, reforestation, or farming, but some forest cover remained, (3) undisturbed forest cover (4); patch location: matrix (defined as any open or modified area), edge or interior; canopy cover, as the mean of three measures of the cover randomly taken within the transect; litter as the mean of three measurements of litter depth; grass height, the mean of three measurements of the grass height; water-body presence divided into six categories: temporary ponds (TP), temporary streams <2 m wide (TS), permanent streams (PS), permanent ponds and lakes (PP), permanent river >2 m wide (PR). Environmental measures were obtained as the mean from all transects within each patch in the year in question. In total 16 environmental variables were used for the following analyses (Appendix 1).
Metacommunity analyses
The structure of the metacommunity and its variation between years was analysed following the protocol of ‘elements of metacommunity structure’ (EMS) proposed by Leibold & Mikkelson (Reference LEIBOLD and MIKKELSON2002) as modified by Presley et al. (Reference PRESLEY, HIGGINS and WILLIG2010). This method is based on an ordinated sites and species presence/absence matrix (by reciprocal averaging/correspondence analysis) along the major compositional gradient(s) (in this case we used just the first axis because it is the dominant axis of variation). It evaluates three different attributes: coherence, species turnover and boundary clumping among the sampled sites. It assesses whether the pattern presented by the analysed metacommunities is statistically different from random and can also test multiple hypotheses of idealized structural patterns based on consideration of these elements by comparing coherence and species turnover with null models (for derivation and methods see: Leibold & Mikkelson Reference LEIBOLD and MIKKELSON2002, Presley & Willig Reference PRESLEY and WILLIG2010, Presley et al. Reference PRESLEY, HIGGINS and WILLIG2010).
Coherence measures the distribution of species along the gradient, through the number of embedded absences found (Leibold & Mikkelson Reference LEIBOLD and MIKKELSON2002). Positive coherence (fewer embedded absences than the null model) means that the metacommunity is structured; negative coherence implies random metacommunities. The following two attributes are tested after all embedded absences are replaced by presences or ‘filled in’ (i.e. assuming that all embedded absences are essentially measurement errors or unnatural gaps). Turnover indicates how species replacement happens site by site; the number of replacements is compared with a null model that shifts species distributions within the gradient while holding their range size constant (Presley et al. Reference PRESLEY, HIGGINS and WILLIG2010).
Boundary clumping measures the regularity of the process of turnover, i.e. the degree to which the end points of multiple species distributions coincide along the gradient once embedded absences are filled in with dummy presences (Leibold & Mikkelson Reference LEIBOLD and MIKKELSON2002). To evaluate boundary clumping, Morisita's index (I) is used and compared with a null model. When range boundaries are random I = 1, when range boundaries are more clumped than expected I > 1, and I < 1 when they are less clumped than expected or are over-dispersed. A chi-square test is used to evaluate if I is significantly different from 1 (higher or lower). Although null models can vary in their susceptibility to type I and type II errors, the framework developed by Presley et al. (Reference PRESLEY, HIGGINS and WILLIG2010) allows the operator to choose from a selection of highly random to more constrained null models. In these analyses the null model that maintains the observed richness per site (prior to the filling; Leibold & Mikkelson Reference LEIBOLD and MIKKELSON2002) and assigns equal probability to the occurrence of each species was selected.
Environmental factors varied between years, therefore we computed analyses separately for each year rather than summarizing the presences in a single matrix (Werner et al. Reference WERNER, SKELLY, RELYEA and YUREWICZ2007). Thus, two species-by-site incidence (presence–absence) matrices were created, one for 2009 another for 2010. These analyses were performed in Matlab 7.7.0 using the script Metacommunity. The parameters used were: 1 = reciprocal averaging, 3 = species richness per site is fixed and species occurrence is equiprobable, 0 = range perspective, 1000 = number of iterations, 1 = axis to use in ordination.
In order to enable comparison between matrices of different size (Nahá and La Pera) we calculated the z-scores of the embedded absences and species replacements for each year and site (Keith et al. Reference KEITH, NEWTON, MORECROFT, GOLICHER and BULLOCK2011), which are the number of standard deviations from the mean, z = (observed value – mean)/standard deviation. This method allows comparison because it normalizes the variables (Shaw Reference SHAW2003).
Community–environment relationships
We calculated Spearman's rank correlation coefficients using the site scores of the first axis, to explore if the associations (i.e. structuring mechanisms) between the metacommunities and environment changed between years and sites (Legendre & Legendre Reference LEGENDRE and LEGENDRE1998). In order to do so, reciprocal averaging (RA) ordinations were performed using the package vegan in R (v.2.15.2), based on raw species presence/absence data for each study area (as used in the analyses of metacommunity structure), down-weighting the rare species to avoid them having undue influence. For each area we calculated Spearman's rho between the site scores on the first RA axis and the environmental variables in R (package stats). P values were computed using the asymptotic t approximation, using a critical value of P < 0.05. We performed Kruskal–Wallis tests to assess the variation in first axis RA scores for sites of each location type (matrix, edge and interior) for each protected area.
RESULTS
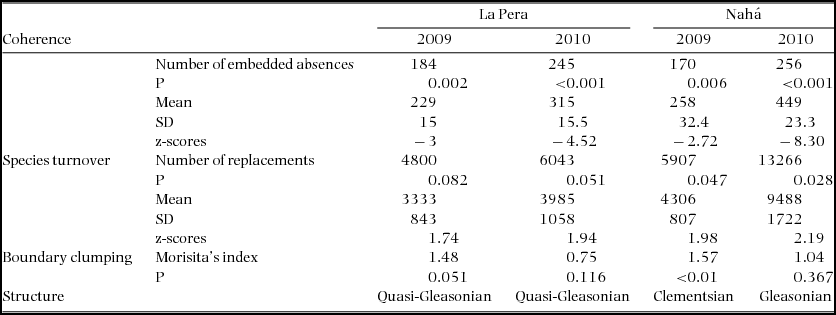
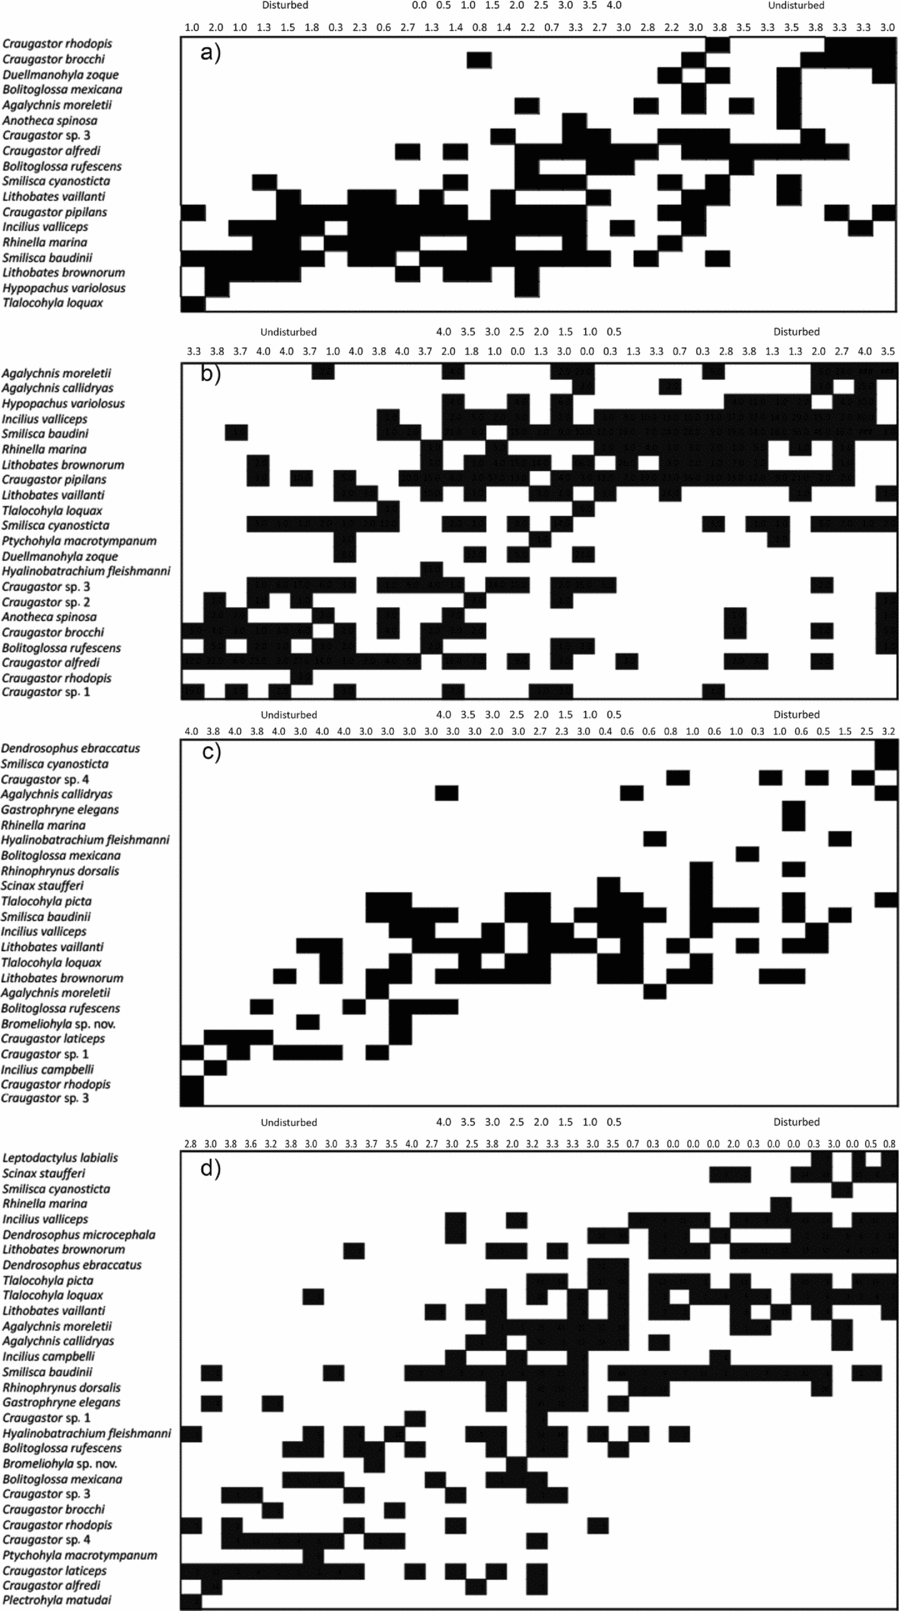
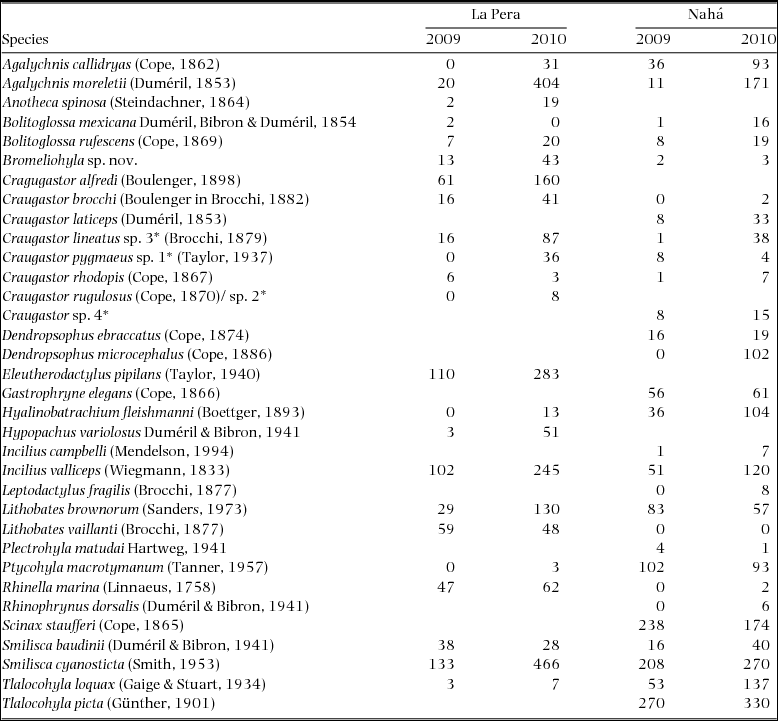
The species of the metacommunity in La Pera were almost completely a nested subset of the metacommunity of Nahá, i.e. 21 of 23 La Pera species also occurred in Nahá (Appendix 2). The EMS analyses showed that metacommunity structure for both landscapes changed between years (Table 1, Figure 2). Both metacommunities, in both years, presented significant positive coherence (i.e. had fewer embedded absences than the mean of the null model). In La Pera, in both years, turnover was greater than the mean produced by the null model and not significant, therefore the metacommunities presented a non-nested quasi-structure. In Nahá, turnover was greater than the mean produced by the null model and the difference was significant in both years. As a consequence, the Nahá metacommunity presented idealized patterns of distribution rather than quasi-structures. Although a quasi-Gleasonian structure was maintained in La Pera in both years, the z-scores showed variation in the embedded absences and number of replacements. The z-scores for Nahá indicate significant variation in the embedded absences. The two landscapes also presented different behaviour for boundary clumping between years. In La Pera for 2009, Morisita's Index was > 1, indicating that range boundaries were more clumped than expected, but in 2010 Morisita's index was < 1, pointing to over-dispersed range boundaries (less clumped than expected). In Nahá for 2009, Morisita's Index was significantly greater than 1, while for 2010 the value was around 1 and not significant, indicating that boundary clumping was stochastic. Given these results, the metacommunity of La Pera can be classified as presenting a quasi-Gleasonian structure in both years. The Nahá metacommunity presented a Clementsian structure in 2009 and a Gleasonian structure in 2010.
Table 1. Summary of the metacommunity structural analyses (coherence, species turnover and boundary clumping with the first axis of a Reciprocal Averaging ordination of presence/absence data) for amphibians of La Pera and Nahá, Chiapas, Mexico, for the rainy season sampling seasons of 2009 and 2010. The null model holds the observed richness constant and assigns equal probability to the occurrence of each species.


Figure 2. Matrices of amphibian site–species data from Chiapas, Mexico: La Pera 2009 (a), La Pera 2010 (b), Nahá 2009 (c) and Nahá 2010 (d), as ordered by the first axis of a Reciprocal Averaging ordination. Species names are on the left and an indication of forest status for the patch is given at the top. Forest status was recorded for every transect as: no forest (0), very disturbed with <20% forest cover (1), disturbed with <50% forest cover (2), managed – areas where it was possible to observe logging, reforestation, or farming, but some forest cover remained (3), undisturbed forest cover (4). In case of doubt we asked our field guides whether there was any management in the area. For every patch we calculated an arithmetic mean of the values of the transects within. Ordination was performed in Matlab using the scripts of Leibold & Mikkelson (Reference LEIBOLD and MIKKELSON2002) as updated by C. L. Higgins (http://www.tarleton.edu/Faculty/higgins/EMS.htm, accessed January 2012). The gradient of forest status was included after the analyses to illustrate a relationship between an environmental variable and the metacommunity structure.
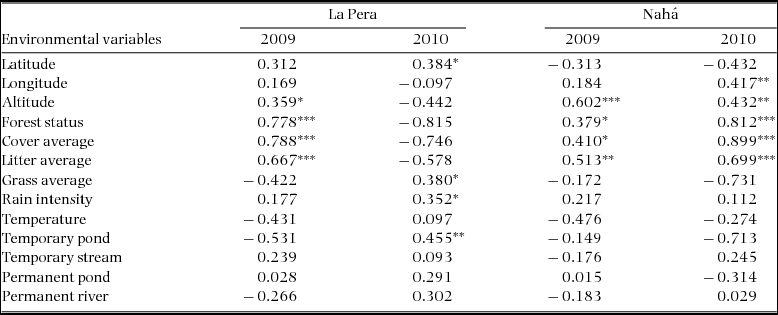
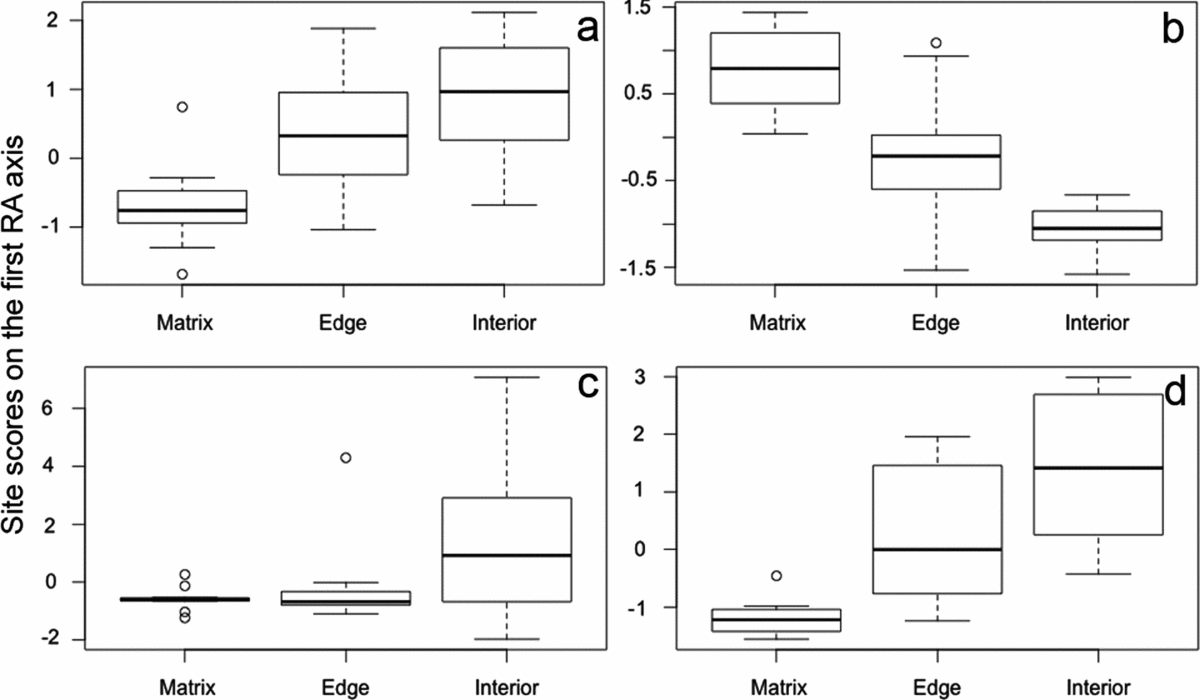
The Spearman's rank correlations show the relationships between environmental factors and the community structure (Table 2). Results from the Kruskal–Wallis tests showed significant differences between the position of matrix, edge and interior sites on the ordination axis in La Pera in both years, but in Nahá only in 2010. Test statistics were as follows: in La Pera 2009, χ2 = 11.8, P = 0.002; in La Pera 2010, χ2 = 19.2, P > 0.000; in Nahá 2009, χ2 = 3.67, P = 0.16; and in Nahá 2010, χ2 = 19.2, P > 0.000 (df = 2 in each case). In La Pera, the site types described a simple gradient from open (matrix), through ecotone (edge) to interior forest along the first RA axis; broadly intelligible in terms of the ecological characteristics of the amphibian species and their distribution on the equivalent species axis (compare Figures 2 and 3). The relationships between the environmental variables and the community structure nonetheless showed considerable change between years. Broadly speaking, the 2009 La Pera gradient from matrix to edge to interior sites (Figure 3) (disturbed to undisturbed in Figure 2) was inverted in the 2010 analyses, but with enough further differences evident to reveal a considerable re-assortment of species distributions between the years (Table 2, Figure 2a, b). In Nahá, in 2009, there was a distinction between interior and other sites but no clear overall gradient across the three site types, but in 2010 a clear matrix to edge to interior gradient emerged (Figure 2c, d). The relationships between the environmental variables and the community structure did not show substantial changes, except for the variable longitude, which was significant only in 2010.
Table 2. Summary of the Spearman's rank correlations between the first axis of the Reciprocal Averaging (with down-weighting of rare species) of the amphibian communities and the environmental variables of La Pera and Nahá, Chiapas, México, between sampling seasons of 2009 and 2010. Significant values were * P < 0.05, ** P < 0.01, *** P < 0.001.


Figure 3. Site scores on the first RA (reciprocal averaging with down-weighting of rare species) axis by patch location (matrix, edge, forest interior) for amphibian communities in Chiapas, Mexico, (a) La Pera 2009, (b) La Pera 2010, (c) Nahá 2009 and (d) Nahá 2010. Values are calculated in standard RA units (solid bar = median, box = IQR, whiskers = IQR × 1.5, dots = outliers).
DISCUSSION
Metacommunity analyses
The EMS results show that the amphibian communities exhibit different emergent metacommunity properties in the two landscapes. In La Pera, there is relatively little change in these metrics and thus notwithstanding considerable change in species distributions across sites, there is consistency in the emergent classification as quasi-Gleasonian in both years. By contrast, in Nahá, the metacommunity shifted from a Clementsian to Gleasonian structure from 2009 to 2010. Changes in the metacommunity structures support the suggestion that amphibians are very responsive to environmental changes (Denver Reference DENVER1997, Gardner et al. Reference GARDNER, BARLOW and PERES2007, Raffel et al. Reference RAFFEL, ROHR, KIESECKER and HUDSON2006). However, it is uncertain whether the changes in the metacommunity structure reflect meaningful changes in species abundances in the wider landscape. Alternatively, they could indicate a combination of transient fluctuations in behaviour, distribution or temporary population dynamics in response to inter- and intra-annual variation in weather, and only longer sequences of data could establish if they form part of a longer-term trajectory.
In Clementsian metacommunity structures, species boundaries are highly coincidental, indicating that they are responding to similar environmental drivers or structural mechanisms (Keith et al. Reference KEITH, NEWTON, MORECROFT, GOLICHER and BULLOCK2011). In biological terms, a Clementsian metacommunity means that the sets of species that inhabit each patch within the landscape are well-defined, i.e. forest species such as leaf-litter frogs, Craugastor spp., are limited to the high-cover forests, a genus like Lithobathes is limited to open areas, stream-hylids are limited to patches with forest and streams, etc. It is also reasonable to assume that boundary permeability among patches is low due to the difference in environmental characteristics, i.e. species do not cross from a forest patch to a matrix patch. Therefore, well-defined communities are in well-defined patches. The change in Nahá from Clementsian to Gleasonian may be an indicator that boundary permeability among patches increased from the rainy season of 2009 to the rainy season of 2010, implying that the difference in environmental characteristics, from patch to patch, decreased, i.e. patches became more alike. Although this initially seems counterintuitive with respect to Figure 3, it is possible to make sense of these changes by reference to the species involved. In 2009 the portion of the principal gradient occupied by the matrix and edge communities is small compared with the interior community; this indicates that they are tightly grouped towards the matrix end of the axis. Notwithstanding these differences, several species that occurred reasonably often in both datasets also show consistent patch-type affinity. For example, Craugastor laticeps, C. rhodopis and Bolitoglossa rufescens associate with undisturbed forest in both years, while more generalist species such as Smilisca cyanosticta and Rhinella marina are associated with disturbed site. Hence, these correlative analyses demonstrate ecologically interpretable relationships between species and environmental conditions related to the matrix–edge–interior gradient, with indications of departure from this pattern for Naha in 2009.
Environmental variation
For Mexico, especially in the south, the 2009 rainy season was particularly dry. Indeed, in several places seasonal crops were lost due to the lack of rain. In quantitative terms, the annual rainfall in the capital city of Chiapas – near La Pera – was 643 mm in 2009 and 1409 mm in 2010, against a long-term average of 922 mm. For Nahá, the nearest climatological station is in Yaquintela. Here the annual rainfall was 1387 mm in 2009 and 2628 mm in 2010 (http://smn.cna.gob.mx). Thus, the climatic disparity between open areas and forested areas was huge in 2009, allowing more differentiation in amphibian communities inhabiting those areas. Conversely, 2010 was a year with plenty of rain, and as a result patch boundary permeability increased. Therefore, each species, instead of being limited to a certain patch, could move freely across the landscapes, limited only by its physiological constraints. These differences in weather between the two years may thus provide an explanation for why the species distributions changed so much and the emergent properties of the metacommunity of Nahá switched between Clementsian in 2009 and Gleasonian in 2010.
It is possible that patterns of breeding boom and bust among the species have a strong influence in determining a Gleasonian metacommunity structure. During the rainy season individuals will look for good breeding sites, where mates are present, responding especially after a heavy rain event to conspecific calls (Gottsberger & Gruber Reference GOTTSBERGER and GRUBER2004). It is also known that some amphibians prefer warm and shallow ponds to reproduce because these factors contribute to rapid larval development (Richter-Boix et al. Reference RICHTER-BOIX, LLORENTE and MONTORI2006), and generally these ponds are located in naturally open or disturbed areas, so that some species of amphibians only use open areas for purposes of reproduction, while for the rest of the year they are restricted to the forests. Moreover, it has been documented that juveniles of some species exhibit high dispersion rates (Sinsch Reference SINSCH1997; but see Smith & Green Reference SMITH and GREEN2005), although this depends on the permeability of patch boundaries (Stevens et al. Reference STEVENS, POLUS, WESSELINGH, SCHTICKZELLE and BAGUETTE2004, Reference STEVENS, LEBOULENGÉ, WESSELINGH and BAGUETTE2006). For our study system, it is not known how many times these particular amphibian species reproduce during the rainy season, or if they exhibit variation in their mating patterns (Olson et al. Reference OLSON, BLAUSTEIN and O’HARA1986), how many species present philopatry (Sinsch Reference SINSCH1990), or given the case of more than one mating, whether the individual moves to other ponds/places for the next mating.
In spite of the fluctuation in rainfall between years and the changes in actual species distributions that occurred, the emergent metacommunity properties of La Pera remained fairly similar from 2009 to 2010. Quasi-structures are thought to emerge in two situations: when the niche breath of the species is greater than the environmental gradient existent, or when only a part of an empirical gradient is sampled (Presley et al. Reference PRESLEY, HIGGINS and WILLIG2010). In the case of La Pera, which presented a quasi-structure in both years, a way to evaluate which of the two processes is the cause would be to sample more of the environmental gradient, i.e. over a larger spatial extent and of course over more years.
The ecological interpretation of the RA axes shares a broadly common structure across years and between the two landscapes, in that a gradient from matrix to edge to interior sites is revealed in each case, except for Nahá in 2009. As the species of La Pera metacommunity largely comprise a nested subset of the Nahá metacommunity, it is unsurprising that there will be some similarities in the species–environment relationships reported. However, examined in closer detail, there are also clear differences evident in the position of species along the first RA axis between sites and years. The environmental factors exhibiting significant correlations with RA axis 1 for La Pera switch from cover average, forest status, amount of litter, and altitude in 2009 to temporary ponds, rain intensity, grass cover and latitude in 2010. These changes would be consistent with a greater dependency on the more resilient humid areas in La Pera in the very dry year of 2009, and on sites for reproduction in 2010. The environmental factors emerging as significant for Nahá in 2009 are the same set (and direction) as those for 2010, with the exception of the addition of longitude as a significant variable.
Despite all changes of the community structure there are some species that have very specific preferences, for example, species of Craugastor, Bromeliohyla sp., Bolitoglossa rufescens, Plectrohyla matudai and Incilius campbelli will always prefer sites with a cover of mature, undisturbed forest, featuring large amounts of litter, and higher levels of humidity, lower levels of radiance and lower temperatures than elsewhere in the landscape. But these species also have other physiological needs that mean they prefer different micro-habitats across the landscape. For instance, species of Craugastor lay their eggs on the ground in areas with humid soil, therefore they are commonly found in forests with a great amount of litter (Bogert Reference BOGERT1969, Hödl Reference HÖDL1990, Jameson Reference JAMESON1954); Bromeliohyla spp., P. matudai and I. campbelli lay their eggs in small permanent and cold rivers.
Final remarks
Variation in structure between years does not necessarily mean population decline is prevalent or vice versa (Adum et al. Reference ADUM, EICHHORN, ODURO, OFORI-BOATENG and RÖDEL2013, Salvidio Reference SALVIDIO2009). Therefore studies that compare amphibian data between periods need to take account of environmental variation, sampling effort (Lips et al. Reference LIPS, MENDELSON, MUÑOZ-ALONSO, CANSECO-MÁRQUEZ and MULCAHY2004) and the period of activity (Ron et al. Reference RON, DUELLMAN, COLOMA and BUSTAMANTE2003), if they are to produce meaningful assessments of the population status. Amphibian populations respond to varying weather, and principally to the distribution of the rainfall within and between years (Stewart Reference STEWART1995), rather than merely to the annual precipitation (Alexander & Eischeid Reference ALEXANDER and EISCHEID2001). It also has been shown that amphibian tolerances to shifts in climatic and ecological factors are generally narrow (Donnelly & Crump Reference DONNELLY and CRUMP1998, Jiang & Morin Reference JIANG and MORIN2004, Newman Reference NEWMAN1998, Wells Reference WELLS2007). Our results show that amphibian metacommunity structure is highly labile in response to short-term environmental variation (mainly in weather conditions), although it will require longer-term data to determine what such dynamics mean for the long-term sustainability of the constituent species populations in these regions (Brodman Reference BRODMAN2009, Salvidio Reference SALVIDIO2009). If our inference is correct, this undoubtedly complicates the problem of determining the implications of long-term shifts in environmental conditions such as are associated with climate change and habitat fragmentation.
In landscapes inhabited by human communities, environmental variability will be increased by human activities, e.g. agriculture, building, construction, etc. When habitats are modified (e.g. fragmented by deforestation) distribution patterns of species change, therefore the structure of the communities living there changes (Adum et al. Reference ADUM, EICHHORN, ODURO, OFORI-BOATENG and RÖDEL2013). We have seen that the metacommunity structure may also vary significantly from year to year in respect to varying weather. This variation in the metacommunity structure is the emergent outcome of the individual responses of each species, as members of each population search for places to inhabit or in which to reproduce. If we are to understand these changes in metacommunities and how they reflect underlying population processes in fluctuating environments such as the seasonal tropics, long-term standardized monitoring programmes are clearly essential (Whiteman & Wissinger Reference WHITEMAN, WISSINGER and Lannoo2005, Yachi & Loreau Reference YACHI and LOREAU1999). In addition to this it is crucial that we learn to distinguish between environmental fluctuations that communities can cope with and those that they cannot cope with and that we should intervene to prevent or mitigate (Magurran & Dornelas Reference MAGURRAN and DORNELAS2010) – or even accept as lost causes (Ochoa-Ochoa et al. Reference OCHOA-OCHOA, BEZAURY-CREEL, VÁZQUEZ and FLORES-VILLELA2011).
Either the community and metacommunity structures are transient properties as individual species respond individualistically to environmental space, or the structure of metacommunities is a stable emergent property. Our results point to the former for these amphibian assemblages, while some studies elsewhere, for other types of system, have shown the latter to apply (Keith et al. Reference KEITH, NEWTON, MORECROFT, GOLICHER and BULLOCK2011). It has long been known that sampling size affects the outcomes of biodiversity studies (Preston Reference PRESTON1960), species-specific sampling (Sandoval-Comte et al. Reference SANDOVAL-COMTE, PINEDA and AGUILAR-LÓPEZ2012) and of community analyses (Lande et al. Reference LANDE, ENGEN and SÆTHER2003). Although we compared the same number of sites, the distribution of individuals varied between the two years, seemingly reflecting environmental variation driving the community dynamics (Grøtan et al. Reference GRØTAN, LANDE, ENGEN, SÆTHER and DEVRIES2012, Guo et al. Reference GUO, BROWN and VALONE2002). We cannot be certain to what extent the changing metacommunity properties revealed in our analyses reflect variation in number of individuals sampled as opposed to changing distributions and activity patterns of individuals within the landscape. As both may be involved, a longer period of sampling is necessary to make further statements.
Although the data presented here represent 2 y, being based on a standardized protocol and extensive plot-based sampling of amphibians, they provide a unique base-line of evidence and insights into how amphibian metacommunities respond to environmental change and variability.
ACKNOWLEDGEMENTS
This work formed part of L. Ochoa's doctoral thesis at the University of Oxford. L. Ochoa's doctoral studies were supported by CONACyT and SEP. L. Ochoa offers special thanks to L.-B. Vázquez, El Colegio de la Frontera Sur (Ecosur) and to the National Commission for Protected Areas (CONANP) for support during fieldwork. The authors are grateful to R. de Villa Magallón, N. Mejía, R. Grenyer, W.E. Kunin and two anonymous reviewers for supportive and constructive criticism of drafts of this manuscript. We thank the field assistants (too many to name), and the communities of Nahá and La Pera, for hosting L. Ochoa.
Appendix 1. List of the variables recorded during the rainy seasons of 2009 and 2010 in the two landscapes sampled: La Pera and Nahá (Chiapas, Mexico). The range, mean and SD of each variable within each landscape per year are shown. Matrix, edge and forest were recorded as the frequency of Presence-Absence (1–0) within the patches. The same procedure was used with all water bodies.

Appendix 2. List of species found during two field seasons (2009–2010) in the two landscapes sampled, La Pera and Nahá, in Chiapas, south Mexico. Vouchers are deposited in the Museum of Zoology of the Faculty of Science, UNAM. We did not collect specimens so the species assignation could be mistaken (*).


