


1. Introduction
Precipitation in the form of rain, snow, sleet and hail impacting lake or ocean surfaces changes water properties such as temperature, salinity and surface roughness and has an effect on the production of bubbles and aerosol (Soloviev & Lukas Reference Soloviev and Lukas2013). Hence, precipitation can directly impact the air–sea exchange of energy, mass and momentum. For example, rain increases gas exchange (Zappa et al. Reference Zappa, Ho, McGillis, Banner, Dacey, Bliven, Ma and Nystuen2009), creates a cool thin ‘lens’ of freshwater at the surface (Soloviev & Lukas Reference Soloviev and Lukas2013), produces marine aerosol via splashing (Murphy et al. Reference Murphy, Li, d'Albignac, Morra and Katz2015) and disperses oil slicks (Wu et al. Reference Wu, Hannah, Thupaki, Mo and Law2017). However, the role of frozen precipitation, such as snow and hail, on mass and thermal transport has not been well studied. While satellite observations include information about icy precipitation on a global scale (Palerme et al. Reference Palerme, Claud, Dufour, Genthon, Wood and L'Ecuyer2017; Adhikari, Liu & Kulie Reference Adhikari, Liu and Kulie2018; Kulie & Milani Reference Kulie and Milani2018), the detailed physics of snowflake, sleet or hail impact on the sea surface is less understood and limited information is available on its importance on the heat transfer rate at the air–water interface. Only very recently, the potential for snow to enhance surface cooling with minimal volume flux has been recognized (Soloviev & Lukas Reference Soloviev and Lukas2013). Specifically, Duffy & Bennartz (Reference Duffy and Bennartz2018) showed that, on a global scale, the cooling flux of snowstorms is often comparable to that of radiative and turbulent cooling fluxes. Still, it is unknown which phase of precipitation (i.e. solid versus liquid) affects this process the most.
Although on a large scale both rain and snow precipitation events return water directly to the ocean surface from the atmosphere, the microscale interaction of snowflakes and raindrops with the water surface can be quite different. Raindrops and snowflakes produce different distributions of air bubbles upon their impact on the free surface. Figure 1 shows the high-speed visualization of the impact of a 1.75 mm diameter freshwater droplet falling onto an artificial seawater bath (Instant Ocean with a salinity of 33 ppt) at an impact speed of 2.5 m s $^{-1}$. When a small (1 mm) raindrop impacts the still free surface, even with smaller impact velocity than the terminal expected velocity (Gunn & Kinzer Reference Gunn and Kinzer1949), certain characteristic flow features can be found. The droplet forms a subsurface cavity that collapses upward to form a Worthington jet (Prosperetti & Oguz Reference Prosperetti and Oguz1993), and ejects several jet droplets into the air. The cavity also pinches off a single bubble and forms a vortex ring of freshwater that moves downward with the entrained bubbles. These flow features are characteristic of the regular entrainment category of splash behaviour in which a bubble is repeatedly entrained (Murphy et al. Reference Murphy, Li, d'Albignac, Morra and Katz2015).

Figure 1. High-speed photographs show the impact of a 1.75 mm freshwater drop on the seawater surface at a speed of 2.5 m s $^{-1}$ (a), the formation of a cavity (b), Worthington jet, a single entrained bubble (c) and a downward-moving freshwater vortex ring (d).
Figure 2 shows the high-speed visualization of a  $5.2\ {\rm mm}$ diameter snowflake impacting a bath of artificial seawater (Instant Ocean with a salinity of
  $33\ {\rm ppt}$ and water temperature of approximately
  $8\,^{\circ }{\rm C}$) at
  $1\ {\rm m\ s}^{-1}$ (Murphy Reference Murphy2016). The images were acquired in a snowstorm in Baltimore, MD, with a pco.dimax high-speed camera equipped with a
  $200\ {\rm mm}$ lens and operating at
  $500\ {\rm Hz}$ with a temporal resolution of
  $14\ \mathrm {\mu }{\rm m}$ pixel. The snowflake crosses the air–water interface largely intact and immediately starts to melt. Quite different from the rain precipitation, here the flow dynamics is largely governed by the melting process. As the snowflake's melting progresses, tiny bubbles up to approximately
  $150\ \mathrm {\mu }{\rm m}$ in diameter simultaneously form from the melting ice crystals comprising the snow particle. These bubbles may originate from different sources such as pockets of air trapped in crevices of the snowflake as it enters the water, gas coming out of solution as the snowflake melts, or pockets of air trapped inside individual ice crystals or empty spaces in the crystal structure. This plume of bubbles is advected downwards in a vortex ring until their buoyancy arrests their motion and causes them to rise again towards the air–water interface, where they presumably pop and create fine sea spray. Blanchard & Woodcock (Reference Blanchard and Woodcock1957) noted that snowflakes produce bubbles when submerged, but the impact of snowflakes on the sea surface has not been previously described. Furthermore, it is paramount to study the microphysics of these interactions and the phase change processes involved to assess the impact of snow, hail and rain on the overall mass, momentum and energy transfer across the air–water interface and deeper water sublayers. The current study will fill this gap.

Figure 2. High-speed photographs illustrating the impact of a 5.2 mm snowflake on the seawater surface at a speed of 1 m s $^{-1}$, its subsequent melting by approximately 50 ms and the formation of a bubble plume.
Since the seminal works of Worthington & Cole (Reference Worthington and Cole1897, Reference Worthington and Cole1900) and Worthington (Reference Worthington1908), many researchers have studied different aspects of liquid droplet impact. The effect of the impact crater on vortex ring generation (Chapman & Critchlow Reference Chapman and Critchlow1967; Rodriguez & Mesler Reference Rodriguez and Mesler1988; Peck & Sigurdson Reference Peck and Sigurdson1994; Shankar & Kumar Reference Shankar and Kumar1995; Dooley et al. Reference Dooley, Warncke, Gharib and Tryggvason1997), high speed impacts and splashing (Liow et al. Reference Liow, Dickinson, Allan and Gray1995; Jong-Leng & Gray Reference Jong-Leng and Gray1996; Leng Reference Leng2001) and overall characterization of liquid–liquid impact dynamics (Engel Reference Engel1967; Oguz & Prosperetti Reference Oguz and Prosperetti1990; Pumphrey & Elmore Reference Pumphrey and Elmore1990; Rein Reference Rein1996; Morton, Rudman & Jong-Leng Reference Morton, Rudman and Jong-Leng2000) have been investigated. Similarly, extensive studies have been performed to understand the dynamics of a solid object impacting a liquid surface. At the early stage of impact, liquid jets may form at the impact site (Korobkin & Pukhnachov Reference Korobkin and Pukhnachov1988; Howison, Ockendon & Wilson Reference Howison, Ockendon and Wilson1991; Oliver Reference Oliver2007), and later the solid body may form a cavity under the surface (Gilbarg & Anderson Reference Gilbarg and Anderson1948; May Reference May1951; Glasheen & McMahon Reference Glasheen and McMahon1996; Gaudet Reference Gaudet1998). The impact dynamics may change by modifying the solid body properties such as rotational velocity (Truscott & Techet Reference Truscott and Techet2009b), surface hydrophobicity (Lee & Kim Reference Lee and Kim2008; Truscott & Techet Reference Truscott and Techet2009a; Li et al. Reference Li, Zhang, Zhang, Huang, Ma and Wang2019) and material elasticity (Reinhard Reference Reinhard2013; Belden et al. Reference Belden, Hurd, Jandron, Bower and Truscott2016; Hurd et al. Reference Hurd, Belden, Jandron, Fanning, Bower and Truscott2017; Jalaal, Kemper & Lohse Reference Jalaal, Kemper and Lohse2019). Still, there is limited study about the impact on a liquid surface of a solid (i.e. frozen) object which changes phase (i.e. melts) during the impact process. Recently Baskin, Flores & Weisensee (Reference Baskin, Flores and Weisensee2020) experimentally studied the heat transfer and melt dynamics of ice particles impacting heated liquid bath inspired by metallic additive manufacturing. A complex interaction between the melting particle and the resultant annular plume created during melting is observed. It was suggested that the vortical structure during the melting is the result of interaction between sinking colder liquid from the melting process and the warmer bath. However, the details of fluid mechanics of the vortex generation and its connection to the melting rate were not explored.
The solidification and melting processes can be numerically modelled with different levels of complexity. It may include intermediate material states such as mushy material (Hills, Loper & Roberts Reference Hills, Loper and Roberts1983; Dahle & StJohn Reference Dahle and StJohn1998; Tavakoli, Davis & Kavehpour Reference Tavakoli, Davis and Kavehpour2015), supercooled liquids (Frank Reference Frank1952) and thermal and athermal nucleation (Quested & Greer Reference Quested and Greer2005). Owing to the small size of the snow and ice particles compared with the large body of water, the distinct temperature difference, the phase change type and their melting process may be modelled and computationally represented using the two simpler approaches of enthalpy and energy jump models. The enthalpy model is an appropriate technique to represent a two-phase system of a single material with phase change. The phase domains can be determined either with enthalpy criteria (e.g. Voller & Cross Reference Voller and Cross1981; Cao, Faghri & Chang Reference Cao, Faghri and Chang1989; Tabakova, Feuillebois & Radev Reference Tabakova, Feuillebois and Radev2010; Chaudhary & Li Reference Chaudhary and Li2014) or interface tracking methods (Pasandideh-Fard, Chandra & Mostaghimi Reference Pasandideh-Fard, Chandra and Mostaghimi2002; Alavi, Passandideh-Fard & Mostaghimi Reference Alavi, Passandideh-Fard and Mostaghimi2012; Raessi, Thiele & Amirzadeh Reference Raessi, Thiele and Amirzadeh2013). The application of the enthalpy formulation, however, is suitable for systems with weak energy jumps, such as the solidification process in metals. The energy jump model on the other hand employs the energy jump condition at the interface to find the rate of phase change mass transfer (Gibou et al. Reference Gibou, Chen, Nguyen and Banerjee2007). Despite the fact that this method does not account for the kinetic energy contribution (Shin & Juric Reference Shin and Juric2002), it is extensively employed for melting and solidification applications as it does not require empirical coefficients (Juric & Tryggvason Reference Juric and Tryggvason1998). In addition to the static/low-speed phase change of spherical drops (Grimado & Boley Reference Grimado and Boley1970; Mcleod, Riley & Sparks Reference Mcleod, Riley and Sparks1996; McCue, Wu & Hill Reference McCue, Wu and Hill2008), the model is employed for investigation of the impact and freezing of molten metal (Pasandideh-Fard et al. Reference Pasandideh-Fard, Qiao, Chandra and Mostaghimi1996, Reference Pasandideh-Fard, Chandra and Mostaghimi2002) and water (Thiévenaz, Séon & Josserand Reference Thiévenaz, Séon and Josserand2019) drops on solid surfaces, and melting of a solid sphere (Hao & Tao Reference Hao and Tao2002) or cylinder (Ameen, Coney & Sheppard Reference Ameen, Coney and Sheppard1991) in cross-fluid-flow.
Here we numerically study the impact of canonical snow and hail particles onto the surface of a liquid bath and quantify the effects of fluid and energy transports in the problem. Physical and mathematical models for the impact of frozen and liquid particles on the water surface are presented in the next section. Simulations of the impact of simplified snow, hail and rain particles on the water surface are then described. Three stages, namely particle impact, particle melting and vortex descent, are identified and the role of their associated time scales on the overall mass, momentum and energy transfer during this event are presented. The article concludes with a summary of the work and future research directions.
2. Problem description
Two materials (water and air) and two phases of water (liquid and solid forms) are considered to represent the system mathematically. We employ mass, momentum and energy conservation in all materials and phases. The phase change dynamics for melting and the surface momentum and energy interfacial conditions are used to calculate the velocity of the particle and the rate of mass and energy transport on its surface.
To make this problem amenable to fundamental analysis of the thermal and flow dynamics, the geometry of the snowflake is simplified as a canonical spherical ice shell with a spherical interior air cavity. Although the use of a spherical model to approximate snow shape appears like a ‘spherical cow’ (Boroditsky & Ramscar Reference Boroditsky and Ramscar2001), this approximation is adopted as a first step of such study to characterize different time scales of the system. The simplified geometry preserves the snowflake's buoyancy effect of entrapped air pockets that the snowflake transports across the air–water interface. The hail particle is similarly modelled as a solid ice sphere without an interior cavity. A comparative raindrop is also modelled as a spherical water drop with the same radius as the other particles. Moreover, the pool of water is enclosed in a container with walls far away from the impact point to eliminate edge effects. The water and air domains are assumed to be initially isothermal. The structural deformation of the snowflake at the time of impact and when it crosses the air–water interface are not considered and instead, the frozen state of the ice particle is enforced using the large viscosity model. The large viscosity penalizes any deformation inside the ice particle and essentially represents the solid state of the ice throughout the process (Carlson et al. Reference Carlson, Mucha, Van Horn III and Turk2002). This technique is commonly employed for the numerical modelling of viscoplastic and complex fluids (Saramito Reference Saramito2016).
2.1. Computational method
A level-set function  $\phi _{i}(\boldsymbol x,t)$ is used to identify the
  $i$th material domain. The region inside the material is identified with a positive level-set function
  $\phi _{i}(\boldsymbol x,t)>0$, and the region outside the material is identified with a negative level-set function
  $\phi _{i}(\boldsymbol x,t)<0$. Once the level-set function is defined, the interface between material
  $i$ and other materials can be given by
  $\phi _{i}(\boldsymbol x,t)=0$. In the computational domain, we solved for the conservation of mass, momentum and energy:
 $$\begin{gather} \boldsymbol{\nabla} \boldsymbol{\cdot} \boldsymbol u = 0, \end{gather}$$
 $$\begin{gather}(\rho_{i}\boldsymbol u)_t+ \boldsymbol{\nabla}\boldsymbol{\cdot}(\rho_{i}\boldsymbol u \otimes \boldsymbol u +p_{i} \mathbb{I})=\boldsymbol{\nabla}\boldsymbol{\cdot}(2\mu_{i}\mathbb{D})+ \rho_{i}\boldsymbol g, \end{gather}$$
 $$\begin{gather}(\rho_{i}C_{p,i}T)_t+ \boldsymbol{\nabla}\boldsymbol{\cdot}(\boldsymbol u\rho_{i}C_{p,i}T)= \boldsymbol{\nabla}\boldsymbol{\cdot} (k_{i}\boldsymbol{\nabla} T). \end{gather}$$
 Here,  $\boldsymbol u = (u, v, w)^T$ is the velocity vector;
  $p_i$,
  $\rho _i$ and
  $\mu _i$ are pressure, density and dynamic viscosity of material
  $i$, respectively;
  $\boldsymbol {g}$ is the gravitational acceleration vector, and
  $\mathbb {D}=\frac {1}{2} (\boldsymbol {\nabla }\boldsymbol u+(\boldsymbol {\nabla }\boldsymbol u)^{T})$ is the rate of deformation tensor. In the energy equation (2.3),
  $T$ denotes the temperature, and
  $C_{p,i}$ and
  $k_i$ are the heat capacity and thermal conductivity of material
  $i$, respectively. The jump conditions at the interface between material
  $i$ and
  $j$ are (where
  $[X]\equiv X_i - X_j$ for a typical state variable
  $X$) the following.
The mass exchange across the interface is
 \begin{equation} [\boldsymbol{u}] \boldsymbol{\cdot} \boldsymbol{n}_{i,j} = \dot{m}_{i,j} \left[\frac{1}{\rho} \right], \end{equation}
where  $\dot {m}_{i,j}$ is the inward (
 $i$-to-
 $j$) phase change mass flux (Ishii & Hibiki Reference Ishii and Hibiki2010). Here,
  $\boldsymbol {n}_{i,j}$ is the normal vector to the interface between materials
  $i$ and
  $j$ calculated using the material level-set function (Vahab, Sussman & Shoele Reference Vahab, Sussman and Shoele2021).
For energy exchange across interfaces we assume the rate of phase change is proportional to the jump in heat flux at the interface (Davis Reference Davis2001),
 \begin{equation} \dot{m}_{i,j} ={-} \frac{[k \boldsymbol{\nabla} T] \boldsymbol{\cdot} { \boldsymbol n_{i,j}}} {L_{i,j}}, \end{equation}
where  $L_{i,j}$ is the latent heat of phase change, and the interface between phase change materials is assumed to have the prescribed melting temperature
  $T_m$.
For momentum exchange and capillary forces the interface in the absence of surfactants is massless and the momentum jump condition is described by
 \begin{equation} [2\mu \mathbb{D} - p \mathbb{I}]\boldsymbol{\cdot} \boldsymbol n_{i,j} = \sigma_{i,j}\kappa_{i,j}\boldsymbol n_{i,j}, \end{equation}
where  $\sigma _{i,j}$ is the surface tension coefficient of the interface and
  $\kappa _{i,j}$ is the interface curvature.
The fluid and thermal dynamics in the system are solved computationally using the method presented in Vahab et al. (Reference Vahab, Pei, Hussaini, Sussman and Lian2016, Reference Vahab, Sussman and Shoele2021) and Vahab, Shoele & Sussman (Reference Vahab, Shoele and Sussman2018). This approach can model several materials and phases in the system and accurately resolve the material domains using the moment-of-fluid method (Jemison, Sussman & Arienti Reference Jemison, Sussman and Arienti2014; Jemison, Sussman & Shashkov Reference Jemison, Sussman and Shashkov2015; Pei et al. Reference Pei, Vahab, Sussman and Hussaini2019; Liu et al. Reference Liu, Sussman, Lian and Hussaini2020). The equations are discretized on a Cartesian grid, and the adaptive mesh refinement technique is employed to create multiple levels of grid resolution in the problem. The fine grid resolution is applied to the regions of interest (near material interfaces, high-vorticity regions) using an adaptive mesh refinement technique to reduce the computational cost of the problem. The model is validated for related canonical problem of the radial growth of a freezing front of a circular ice phase surrounded by supercooled liquid (Vahab et al. Reference Vahab, Pei, Hussaini, Sussman and Lian2016) and also for a growing vapour bubble in a superheated liquid (Vahab et al. Reference Vahab, Sussman and Shoele2021).
2.2. Model set-up and parameters
A snow particle can have different shapes and material properties based on atmospheric conditions (Pruppacher & Klett Reference Pruppacher and Klett1980). Snow aggregates are connected ensembles of unit ice particles called ‘monomers’ (Westbrook et al. Reference Westbrook, Ball, Field and Heymsfield2004; Schmitt & Heymsfield Reference Schmitt and Heymsfield2010; Pruppacher & Klett Reference Pruppacher and Klett2012; Dunnavan et al. Reference Dunnavan, Jiang, Harrington, Verlinde, Fitch and Garrett2019). It is observed that the volume and density of these aggregates are related to the size of the snow particle through power-law relations, which motivates the use of fractal approaches to represent the geometry of snow particles (Maruyama & Fujiyoshi Reference Maruyama and Fujiyoshi2005; Ishimoto Reference Ishimoto2008). It would be computationally very expensive to model and simulate the intricate fractal shape of a snow crystal or aggregate particle in three dimensions. To alleviate this limitation, we use a geometrical homogenization approach and employ a spherical representative model. The mass and surface area of snow particles, however, have different allometric relations to the size of the system (here the diameter of the particle) (Passarelli Jr & Srivastava Reference Passarelli and Srivastava1979; Matrosov et al. Reference Matrosov, Reinking, Kropfli and Bartram1996), meaning that the model has less surface area compared with the aggregate snowflake or snow crystal. Therefore, the melting time scale of the spherical model is slower than that of a snow particle with the same material properties. To account for this mismatch and study the relative effects of mass/momentum/energy transfers in this system, it is necessary to match the melting time scale of the spherical and snowflake shapes. This is done here through the adjustment of the value of melting latent heat to compensate for the reduced ice surface area and increased ice thickness. In the prior canonical tests, the rate of reduction in the particle size for a cylindrical ice monomer of radius  $1/50$ mm (e.g. a typical monomer in a snow aggregate) with the physical value for the latent heat of water
  $L_w$ is calculated and found to be close to a spherical ice particle of radius
  $1$ mm with a representative latent heat value of
  $L_{w,rep}=L_w/1000$ (figure 3a). This calibrated value is chosen for the comparative analyses presented here. Later in §§ 3.4 and 3.5, we will discuss how the latent heat value affects the dynamics of the representative spherical model.

Figure 3. (a) Comparison of melting rates of a cylindrical ice (a unit of an aggregate snowflake) and spherical ice with modified latent heat values. Here  $r_0$ is the initial radius of each geometry. (b) The problem set-up and boundary conditions.
The characteristic particle size and speed are selected to be within the range of common snowflakes ( $r_p=1\ {\rm mm}$,
  $v_p=1\ {\rm m\ s}^{-1}$) obtained from the statistical model proposed by Gunn & Marshall (Reference Gunn and Marshall1958). The rest of the material parameters are chosen based on water, ice and air physical properties at
  $0\,^{\circ }{\rm C}$ (see table 1 for their values in physical units). In the remainder of the paper, we use non-dimensional values for reporting of the results based on the particle radius (
 $r_p$) and characteristic time (
 $t_c=r_p/v_p$). Since the ice melting temperature is a relevant value in this study, the unit ‘degrees Celsius’ is kept for reporting, without further scaling. To have a better characterization of the problem, we calculate the following dimensionless variables for the base test case:
 \begin{equation} \left. \begin{array}{c} We=\dfrac{\rho_w v_p^2\,r_p}{\sigma_{w-a}}=26.4, \quad Re=\dfrac{2\rho_w v_p r_p}{\mu_w}=1333 \\ St=\dfrac{C_{p,w}(T_w-T_p)}{L_{w,rep}}=63.1, \quad Fr=\dfrac{v_p^2}{2gr_p}=51 \end{array} \right\}. \end{equation}
Table 1. The model parameter for the base case simulation. The subscripts terminology is as follows: air, water, ice, domain and particle. Figure 3 shows the geometrical parameters,  $r_d, h_d, r_a, r_p$.

The computational set-up is shown in figure 3(b). The physical values of the parameters are given in table 1. The computational model has been tested to ensure that the results are insensitive to space and time discretizations and the computational domain size.
3. Results
We initially compare the fluid and melting dynamics of representative snow, hail and rain particles during and after their impacts on the free surface with the original characteristic values discussed in § 2.2. This is followed by a detailed investigation of the effect of size of the air cavity within the snow particle. We then discuss the effect of the temperature difference between the impacting particle and receiving water bath. At the end in § 3.5, we explore how the Reynolds, Weber and Stefan numbers influence the fluid and thermal dynamics of the system.
3.1. Comparison between modelled snow, hail and rain particles
Here, the thermal and fluid transport processes involved in the impact of snow (with an air cavity of radius of  $r_a/r_p=0.5$), hail (frozen particle without an air cavity) and raindrop particles with identical radii and initial temperature of
  $T_p=-1\,^{\circ }{\rm C}$ are compared. The water temperature bath is initially set at
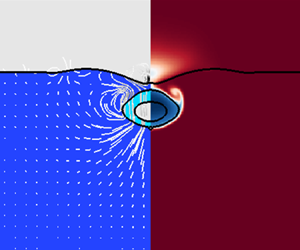
  $T_w=4\,^{\circ }{\rm C}$ in all cases. Figure 4 shows the temperature fields, material interfaces and vorticity contours at selected time frames of these three cases during and after their impact on the water bath surface. Figure 5 shows how temperature varies with depth over time, where temperature is horizontally averaged inside a disk of radius
  $r/r_p=4$. Three distinct phases, namely impact, melting and vortex ring descent, are identified and described next.

Figure 4. Material interfaces and temperature pseudocolour of particle impact for rain, hail and snow particles. Ice and air interfaces are shown with magenta and green curves, respectively. The grey curves are the vortex contours at values:  $-0.3, -0.1, -0.025, -0.01$ (dashed); 0.01, 0.025, 0.1, 0.3 (solid). The timestamps are non-dimensional (
 $t/t_c$) and temperature units are in degrees Celsius.

Figure 5. Depth–time profiles of horizontally averaged temperature after impact for the snow, hail and rain particles.
(1) Impact stage. The liquid droplet impacting the water surface falls into the ‘coalescence and vortex ring’ regime (Murphy et al. Reference Murphy, Li, d'Albignac, Morra and Katz2015) in which the low velocity droplet coalesces with the water bath and high levels of surface tension generate a descending vortex ring as the droplet penetrates. With the presence of a small crater and outwardly propagating radial wave and the absence of a rebounding jet and no regular bubble entrainment, the simulation is similar to visualizations conducted by Rein (Reference Rein1996,  $Fr=31, We=26$) and Leng (Reference Leng2001,
  $Fr=90, We=43$) and to the simulations of Morton et al. (Reference Morton, Rudman and Jong-Leng2000,
  $Fr=22, We=25$) and Ray, Biswas & Sharma (Reference Ray, Biswas and Sharma2015,
  $Fr=25, We=50$). Because of the retarding effect of surface tension, the raindrop causes significant cooling at the air–water surface, including both the water in close proximity to the impact location and the air layer directly above this point. In contrast, the frozen particles penetrate into the water with less disturbance of the water surface, resulting in minimal surface cooling (figure 4,
  $t/t_c=0$–
 $5$, and figure 5a,e,h).
(2) Melting stage. The frozen particles travel downwards in the water column while melting. As they do so, a vortex ring forms around their surface and grows on the edge of the particle. While the initial vortex ring formation is due to shear at the particle surface, its subsequent enhancement is due to the rapid conversion of ice to water. In such rapidly melting bodies, most added mass energy is released to the flow and results in the strengthening of the vortex ring. This is an inviscid mechanism related to the surface flux as discussed in Eames (Reference Eames2008) and the resultant vortex ring is called a ‘ghost’ vortex. The same mechanism has been explored in other situations with vanishing, melting and suddenly retracting bodies (Taylor Reference Taylor1953; Eames Reference Eames2008; Akhmetov Reference Akhmetov2009; Weymouth & Triantafyllou Reference Weymouth and Triantafyllou2012). The melting process occurs over approximately  $t/t_c=40$, during which there is a continuous vortex creation at the ice–water interface. The vortex and melted cold liquid are transported and entrapped in the vortex rings while the melting particle decelerates due to drag and boundary actions. During this stage, the snow particle melts sufficiently to release its entrapped air bubble. The buoyancy of this initially entrapped bubble reduces the descent rate of the melting snow particle compared with the solid hail particle (figure 5b, f). The low-temperature vortex ring created by the snow particle interacts with the body and the vortex ring expands on the side of the particle. The time scale of melting is found to be similar to the real snowflake observation in figure 2. For the hail particle, the resultant vortex ring is larger and elongated primarily in the travel direction (figure 4,
  $t/t_c=10$–
 $30$). In contrast, the liquid rain drop rebounds upwards due to surface tension and subsequently forms a downward directed jet that rolls up into a vortex ring. As a result, the cold water initially stays near the surface and cools the air–water interface and the air layer near the surface (figure 5i).
(3) The vortex ring descent stage. Following the melting phase of the ice particles, the region of cold water (i.e. the centre core and the vortex ring around it) continues to descend and stretch in both vertical and radial directions. For the hail particle, detachment and stretching of the vortex ring starts at the final melting stage of the ice particle ( $t/t_c\approx 80$) when the ice particle becomes very small. The radial expansion of the vortex ring happens much sooner for the snow particle (
 $t/t_c\approx 30$). Nevertheless, in both cases, the radial expansion of the vortex ring results in temporary drop of the descending rate of the vortex and localized cooling of the fluid bath (the blue colour in figure 5). The difference between the snow and hail is associated with the entrapped air bubble in the snow particle. The buoyancy force of the air cavity slows the downward motion of the snow particle compared with the hail and results in more a compact and weaker vortex ring around the particle (
 $t/t_c=20$–
 $50$). As the bubble ascends toward the surface, it interacts with the vortex ring and amplifies the vortex expansion in the radial direction (figure 4,
  $t/t_c=40$–
 $80$, and figure 5c). The cold water regions now entrapped in the vortex ring continue descending while losing momentum due to viscosity and regain heat from the body of water. The descent rate of the vortical flow decreases monotonically in this phase (figure 5d,g,j). For the rain particle, the cold temperature region remains in a tightly formed vortex ring advecting downward. Here, the descent rate of the vortex ring is much slower than that of the frozen particles and, as a result, most of the convective heat transfer concentrates near the free surface and close to the impact location.
The momentum transfer and vortex ring location and detachment depend on the particle's core mass as described above. The ice particle is the core mass of the hail particle, and momentum transfer only occurs until the end of the melting stage. However, for the snow particle, both the ice shell and bubble act as the core (the ice shell initially, and the air bubble after the ice is melted). The momentum transfer period is thus extended by the presence of the air bubble, which imparts upward momentum when the bubble ascends towards the surface and separates from the vortex ring. In the rest of the paper, we look at the effect of changing the air cavity size and the variation in dynamics when the temperature of the particle or environment is altered.
3.2. Effects of melting
To understand how the ice core mass interacts with the vortex ring and the importance of the phase change process in the particle dynamics, we compare the results of two hail particles impacting the free surface: one with melting and the other one without melting. Figure 6(a) shows snapshots of the material interfaces and temperature fields. The ice particle's vertical location, and the coldest region in the domain are also presented in figure 6(b). For the case that undergoes melting, the cold melted water is trapped in the particle's generated vortex ring, which stays with the particle until the end of the melting stage and subsequently stretches downward and descends further after absorbing the remaining added mass energy of the melting particle (Eames Reference Eames2008). On the other hand, the cold region is much smaller for the case without melting, stays with the particle and does not stretch downward. The density of ice is lower than that of water, and without melting, the hail particle experiences more significant buoyancy effects, leading to a faster decrease of the particle velocity. By losing mass due to melting, the remaining hail particle experiences less buoyancy and can travel faster and propel the generated vortex ring farther. In summary, it is found that the phase change process is a central mechanism that controls the creation and descent of the vortex ring to lower depth, and consequently it is the driven factor in enhancing convective heat transfer near the interface.

Figure 6. Hail particle evolution with and without phase change. (a) Temperature profile and material interfaces (see the caption of figure 4 for plot notations and details). (b) Vertical location of ice particle and coldest region in the domain.
3.3. Effect of air cavity volume
The ratio of the air cavity volume to the particle volume directly changes the particle mass, momentum and energy, thereby also changing the effective particle buoyancy force and the amount of ice available to melt. Here, we examine the effect of varying the air cavity radius from  $r/r_p=0.1$ to
  $0.8$ while keeping all other parameters the same. This variation of the air cavity size represents the compound effect of changes in the porosity of the particle. To better explore the physics of the problem, we examine the ice/air movement, temperature and vorticity in each stage separately. Figure 7 shows particle impacts for
  $r/r_p=0.1$,
  $0.4$ and
  $0.8$, and figure 8 shows the volume of melted ice and depth of the coldest region over time for all cases.

Figure 7. Temperature profiles for the particle impact with different air cavity radii (see the caption of figure 4 for plot notations and details). Here (a)  $r_a / r_p = 0.1$, (b)
  $r_a / r_p = 0.4$ and (c)
  $r_a / r_p = 0.8$.

Figure 8. Effects of air cavity radius on (a) the volume of melted ice, and vertical symmetry of melting. The asymmetric melting is visible by deviation from the  $r_a/r_p=0.1$ case and sharp change in the rate of melting; (b) the depth of the coldest region. The circles show the time when entire ice is melted. The inset shows the rate of descent for a short period after the melting is completed.
Impact stage. For small ( $r_a/r_p \le 0.2$) to medium (
 $0.3 \le r_a/r_p \le 0.6$) air cavity sizes, the impact stage is very similar to the case described in § 3.1. The main difference is for a larger air cavity size (
 $r_a/r_p > 0.6$) wherein the bottom of the ice shell melts while the particle is still crossing the air–water interface. The larger surface tension force at the air–water interface, compared with that of the ice–water interface, leads to higher deceleration of the penetrating particle into the body of water (figure 7,
  $t/t_c=5$,
  $r_a/r_p=0.8$). As a result, a portion of the energy released from the melting process is directly transferred to the air and not to the water. In the case of a very large air cavity (
 $r_a/r_p \ge 0.8$), melting of the thin ice shell during the impact results in exposure of the trapped air cavity to the ambient air before the particle is fully submerged, which strongly affects the subsequent dynamics.
Melting stage. The results for the volume of the melted ice show that at the beginning of the melting process, the melting rates are independent of the air–cavity radius (figure 8a,  $t/t_c=0$–
 $2.5$). However, after this initial stage, the ice shell thickness plays a central role in the vertical asymmetry of the melting process. The thinner ice shell melts faster on the bottom side, exposing the air bubble inside to the surrounding water. The air bubble, on the other hand, acts as thermal insulation for the ice cap on the top. This process is visible by the flattened curve of melted ice volume for particles with large air cavities.
During the melting stage, the decelerating motion of the particle creates a vortex ring (as previously described in § 3.1). This vortex ring's final shape and position relative to the particle depend on the duration of melting, the penetration depth of the particle and the upward buoyant force. For small  $r_a/r_p$, the melting time is longer and the particle gradually reduces in size and descends deeper into the water. The shrinking of the particle surface also allows for a vortex ring to form into a perfect torus in its wake (figure 7,
  $t/t_c=35$,
  $r_a/r_p=0.1$). In this situation, since the upward buoyant force from the air cavity is negligible, the particle mostly interacts with the descending vortex ring and continues moving downward. For larger air cavities, the melting time is faster. In this case, the more considerable buoyancy effect of the air bubble decelerates the particle quickly and reverses its motion direction, resulting in the lateral displacement of the vortex ring, as shown in figure 7,
  $t/t_c=35$,
  $r_a/r_p=0.4$. For larger
  $r_a/r_p$, the deceleration from the air bubble is strong, to the extent that the vortex ring does not have enough time to form into a torus and instead distorts into a complex shape resembling a stretched vortex sheet. As a consequence of premature separation from the bubble, the vortex structure displays higher diffusion decay and there is no coherent vortex central jet in these cases (figure 7,
  $t/t_c=35$,
  $r_a/r_p=0.8$).
Vortex ring descent stage. For a small air cavity, the buoyancy force is small and the air bubble does not substantially influence the dynamics of the vortex ring. Instead, the bubble only acts as a core anchoring geometry for the vortex ring due to their mutual hydrodynamic interactions. Indeed, the small-radius vortex ring is only slightly altered by its interaction with the bubble. The vortex ring thus maintains its toroidal shape and propels the bubble with its as it descends (figure 7,  $t/t_c=85$,
  $r_a/r_p=0.1$).
For a medium air cavity size, the increase of vortex ring radius is more prominent (figure 7,  $t/t_c=85$,
  $r_a/r_p=0.4$). The increase in the radius of the vortex ring is primarily due to the interaction between the bubble and the forming vortex ring. As a result of counteracting vortex and buoyancy forces on the bubble, the bubble interacts with the vortex ring before separating from the ring and returning to the surface. When the air bubble is large, the particle moves toward the surface even before all of the ice melts. Therefore, a coherent vortex ring is not formed, and a smaller amount of downwash momentum exchange is induced. (figure 7,
  $t/t_c=85$,
  $r_a/r_p=0.8$).
The time histories of the centroids of the air bubble and the ice particle before melting for different air bubble radii are shown in figure 9. Larger air bubbles are found to return quickly to the surface, while smaller air bubbles continue descending to lower depths. The resurfacing time and the penetration depth of the bubble are inversely proportional to the bubble size and can be accurately signified with the fitting functions of  $t_{{resurface}}/t_c=24.04/(r_a/r_p-0.23)$ and
  $z_{{air,min}}/r_p=-2.28/(r_a/r_p-0.09)$, respectively. The interaction of the air bubble/ice particle and vortex ring modifies the convective heat transfer near the interface of air and water. The thermal footprint of the particle is tracked, and the depth of the coldest region (or layer) versus time is plotted in figure 8(b). For small air cavity cases, the air bubble (a combination of the air cavity and the small bubble trapped upon impact beneath the particle) continues descending, and the vortex ring stays attached to it. Therefore, the cold region at the centre of the vortex ring descends with the air bubble to a lower depth. For medium air cavity sizes, the interaction between the bubble and the ring reduces the descent velocity of the vortex ring after the melting phase and consequently lowers the descent rate. For larger air cavity sizes of
  $r_a/r_p>0.6$, there is a limited amount of thermal transport by the vortical structure and, instead, all cases exhibit a similar heat transfer rate through the depth. However, the rate decreases slightly for larger bubbles since lateral diffusion starts to dominate the vertical convection of the cold liquid.

Figure 9. The depth of the air cavity centroid (solid line) and ice particle centroid (dashed line) for the snow particles with various air cavity radii. The inset shows the resurfacing time and minimum depth of the air cavity and the fitted functions.
3.4. Temperature effects
The temperature difference between the ice and surrounding fluid drives the melting process and determines a substantial part of the subsequent flow dynamics. In this section, the effects of particle temperature  $T_p$ and water bath temperature
  $T_w$ are investigated for the base snow particle with the air cavity size of
  $r_a/r_p=0.5$.
We first set the particle temperature to  $-1, -2, -4$, and
  $-8^{\circ }{\rm C}$ while keeping the water temperature constant (
 $T_{w}= 4^{\circ }{\rm C}$). The simulation results (Figure 10) show the variation of the particle temperature negligibly affects the overall thermal and momentum dynamics. The melting and the descent rates of the coldest region are mostly similar among the four cases. The heat diffusion inside the ice is the primary reason for this similarity. Ice has a larger thermal diffusivity than water (
 $\alpha_i\approx 10\alpha_w$, where
  $\alpha=k/(\rho C_p)$), and therefore the thermal layer in the ice at the ice–water interface forms faster than the layer in the water. Therefore, despite the cold water around the ice particle being constantly replenished, this process is not strong enough to hinder the heat flux capacity within the ice. The heat flux thus controls the phase-change rate on the liquid side of the interface in these cases, and variations in the ice temperature only marginally modifies the melting process.

Figure 10. Simulation results for the variation of initial temperature of the particle while  $T_{w}=4\,^{\circ }$C: (a) material domain and temperature profile (see the caption of figure 4 for plot notations and details); (b) depth of coldest region; and (c) volume of melted ice.
On the other hand, changing the water bath temperature while keeping the ice particle temperature constant causes major changes. We set the water temperature to  $T_{w}= 1, 2, 4, 8\,^{\circ }{\rm C}$ while keeping the ice temperature constant at
  $T_{p}=-1\,^{\circ }{\rm C}$. Here, the simulation results in figure 11 show that the water temperature variation strongly affects the overall thermal and momentum dynamics. As expected, the warmer water melts the particles faster (figure 11c). The vortex ring creation and strength, which previously was shown to depend on the melting rate, are thus strongly affected. For warmer water, the momentum of the fast-melting particle is less dissipated before being transferred to the vortex ring. The resulting stronger vortex then can propel the cold fluids deeper in a shorter period of time (figure 11b). In contrast, the ice particle melts much slower in colder water. As a result, a weaker vortex ring is formed next to its surface, and there will be a much smaller transport role by the vortex ring in this case.

Figure 11. The variation of initial temperature of the water with the fixed snow temperature of  $T_{p}=-1\,^{\circ }{\rm C}$: (a) material domain and temperature profile (see the caption of figure 4 for plot notations and details); (b) depth of coldest region; and (c) volume of melted ice. The results for cases with 10 times higher latent heat values are also shown with the dashed lines.
As we found that the change of the bath temperature substantially modifies the melting rate of the ice particle, it would be interesting to examine how variations in  $L$ affect the melting process. When
  $T_w$ is similarly varied while the latent heat value is increased by a factor of 10 (dashed curves in figure 11c), it is again seen that higher water temperatures cause faster melting. However, this increase in the latent heat value significantly slows down the melting process. The effects of these opposing changes (i.e. increasing both
  $T_w$ and
  $L$) can be tested simultaneously by setting
  $L=T_w \times L_{rep,w}$. Results from these simulations all show similar melting rates (marker curves in figure 11c). This effect can also be seen from (2.5). The jump in the temperature gradient and hence the heat flux difference is dominated by the values on the liquid side. Therefore, the increase in the temperature difference in the numerator and latent heat in the denominator approximately cancel out in these cases where the particle temperature is close to the melting temperature. The results suggest that, despite the complexity of shape and melting rate, the Stefan number
  $St={C_p (T_w -T_p)}/{L}$, representing the ratio of sensible heat to latent heat absorbed during the phase change process, can predict the rate of melting of the particles with good accuracy. Finally, we note that for the different melting rate cases (e.g.
  $L=10 \times L_{rep,w}$), the melting time scale is much longer than the time scale for the air bubble to detach and return to the surface. As a result, the resulting simulated behaviour deviates far from the impact and melting response sequences observed in actual snowflakes. This emphasizes the expediency of the representative snowflake model.
3.5. Dependence on Reynolds number, Weber number and Stefan number
In the previous section, we observed that that Stefan number can predict the melting rate with a good accuracy when the latent heat coefficient and particle temperature were changed. This section examines how the variations of dimensionless parameters affect the overall dynamics of the cold region, particle and melting process. Here, it is assumed that  $r_a/r_p=0.5$.
3.5.1. Reynolds number
Using the base case simulation set-up, a large range of Reynolds number between 25 and 3200 is studies. The response of these cases is shown in figure 12. The ratio of air and water viscosities  $\mu _a/\mu _w$ is kept constant and other non-dimensional parameters are fixed at their base values. The particle has a very slow descent rate for low Reynolds number cases (
 $Re \le 150$) with no vortex ring formation, and cold meltwater stays dominantly around the ice particle. This leads to further slowing down of the melting process after the initial impact phase. The general behaviour is similar to the snow cases described before for medium Reynolds number cases (
 $150< Re<2000$). However, for the high Reynolds number case (e.g.
  $Re=3200$), other than the main descending vortex ring, two smaller vortices are shed from the primary vortex, making the flow pattern around the particle more complex. This effect leads to enhanced mixing in the horizontal layer, seen as the changes in the depth of the coldest layer around
  $t/t_c=100$.

Figure 12. Effects of Reynolds number. (a) From left to right: depth of the coldest region; depth of the ice centroid; and volume of melted ice for various Reynolds numbers. (b) Snapshots showing the material interfaces and temperature contour of three representative  $Re$ numbers at
  $t/t_c=50$.
3.5.2. Weber number
Using the base case simulation set-up and with the fixed ratios of  $\sigma _{w-i}/\sigma _{w-a}$ and
  $\sigma _{i-a}/\sigma _{w-a}$, the effect of Weber number,
  $We={\rho _w v_p^2\,r_p}/{\sigma _{w-a}}$, between 5 and 500 is discussed here. The results are shown in figure 13. Due to large surface tension forces, very little disturbance at the air–water interface is observed for a low Weber number case such as
  $We=5.0$. The increase of
  $We$ shifts fast melting regions of the ice particle from the top of the air cavity area to below it, resulting in topological changes of the phases during the melting stage. In very small
  $We$ cases such as
  $We=5$, the ice part of the particle detaches from the air bubble and continues its descent for the whole duration of melting, while the air bubble returns to the free surface. Here we see the fastest transport of the coldest fluid into the depth. On the other hand for larger
  $We$ cases, the entire melting process occurs adjacent to the air cavity. For much larger Weber number cases (
 $We>200$), there is large displacement of the air–water interface during impact with substantial splashing dynamics, which leads to rapid cooling of the surface air during the impact phase (see the depth of cold region for
  $We=500$). Although the surface disturbances lead to a slower descent rate of the immersed particle, the melting rate is not affected significantly and stays very similar across all the Weber number values.

Figure 13. Effects of Weber number. (a) From left to right: depth of the coldest region; depth of the ice centroid; and volume of melted ice for various Reynolds numbers. (b) Three snapshots of the material interfaces and temperature profile at  $t/t_c=50$ show the changes in the overall behaviour of particle impact and melting.
3.5.3. Stefan number
The role of Stefan number,  $St={C_{p,w}(T_w-T_p)}/{L_{w,rep}}$, between 1 and 500 is shown in figure 14. As we discussed in the previous section, the ice melting rate correlates very well with the Stefan number, and the same observation is made here. The cases with larger Stefan numbers have a faster melting rate and create a stronger and more coherent vortex ring flow structure. Conversely, the melting process is prolonged for low Stefan number cases, similar to the no-melting case discussed before. In this case, there is almost no vortex ring decent stage, and instead the cold water stays with the particle. It is observed that the dynamics of the particles during the impact phase and initial part of the melting phase are similar and the higher melting rate (associated with larger Stefan number) primarily changes the later stages of the melting phase and subsequent vortex ring descent stage.

Figure 14. Effects of Stefan number. (a) From left to right: depth of the coldest region; depth of the ice centroid; and volume of melted ice for various Reynolds numbers. (b) Snapshots of the material interfaces and temperature profile at  $t/t_c=50$ for three
  $St$ numbers.
4. Conclusion
The impact, immersion and melting dynamics of frozen particles within a water bath are complicated processes with significance to the global climate. Inspired by the high speed visualization of a morphologically complex snowflake falling into a water bath, the physics of a canonical frozen particle impacting the water surface is investigated here with a multiphase numerical model. Three distinct stages, which were observed in both the visualization and modelling, namely impact, melting and vortex ring descent, have been identified, and the effects of the air cavity size and thermal conditions are explored (figure 15). We have shown that the vortex ring descent strongly depends on the particle air content, which affects the buoyancy force and bath temperature, which affects the melting rate of the particle. The transient nature of the melting particle over a short time after the impact has lasting effects on the vortex ring descent and the thermal transport over a longer time scale by promoting greater depth penetration. Further, the effects of particle phase are explored by simulating a similarly sized liquid drop impacting the water surface. These results show that, in contrast to solid particles which melt after passing through the air–water interface, liquid droplets are greatly influenced by surface tension forces which retard their descent in the water column. Therefore, it is not reasonable to look at this system as a simple mass or cooling effect at the water surface. Instead, the response of the system is highly dependent on the detailed physics (e.g. phase, air content, temperature) of individual particles.

Figure 15. Overview of the significant parameters in snow particle impact and melting.
For the canonical particles considered here, it is shown that the air cavity size directly affects the depth of mass penetration and also controls the formation of coherent vortices. Depending on the relative volume of air in the particle, the vortex ring undergoes different dynamics. It could stay attached to the air bubble or delay the separation instance between the bubble and the vortex ring. For a realistic snow particle aggregation with many spatially distributed air cavities, the dynamics of coherent vortex ring formation may be different. Further, the air cavities and resulting air bubbles may range over an order of magnitude. Some air cavities are as small as the capillary space inside a single ice snow crystal (such as hollow columns) or ice dendrite spaces. Larger air cavities are found in the gaps when multiple snow crystals form an aggregate particle (Pruppacher & Klett Reference Pruppacher and Klett1980). The distribution of these cavities in a snow particle largely depends on the atmospheric conditions and in general follows a fractal law. This distribution in air cavity size may result in smaller bubbles being preferentially carried into deeper waters while the more buoyant larger bubbles rise quickly to the surface and pop, with resulting impacts on mass diffusion at shallow depths and on sea surface aerosol generation, respectively.
The role of relevant dimensionless numbers (Reynolds, Stefan and Weber) on the observed dynamics of frozen particle impact and melting were also considered. Reynolds number more determines the strength of the vortex ring and has a significant impact on snow particle transport and flow dynamics. The threshold on  $Re=150$ is identified for the formation of a coherent vortex ring. The Weber number changes mostly the impact phase of the interaction. In the low Weber number cases, the ice particle's melting rate is faster on the top part of the ice particle than its bottom part. The trend reverses in higher Weber number conditions. Impacting frozen particles melt at different rates that are mainly dependent on their Stefan numbers.
Further research is required to quantify the effects of snow particles’ size and speed. Extremely small or slowly falling ice particles may be trapped by surface tension at the air–water interface and melt to create a thin, cool freshwater lens. In addition, concurrent impact by multiple snow particles may have a synergistic effect, such as the transport of the air bubble of one particle with the impact/melting of another particle. While the current study with a homogenized spherical snow model provides new knowledge about the mass and heat transfer from frozen precipitation modes, these effects can only be studied with a more refined model of the snow particle in which the fractal nature of the geometry is retained. The results can be extended to large-scale events in order to investigate the accumulative effects of each precipitation mode. One possible approach is to form a subgrid model for the mass and heat transfer at the water interfaces based on thermodynamic and geometrical characteristics of the particles. Factors such as snow shape and multiparticle precipitation modes can be used in this model. The large-scale effect of an atmospheric event may be evaluated as the space–time ensemble average of many particles’ impact and melting. Such a model could form a subgrid model that would be computationally inexpensive compared with the direct numerical simulation of many particles.
Acknowledgements
The authors acknowledge the Florida State University Research Computing Center for the computational resources on which these simulations were carried out.
Funding
This research received no specific grant from any funding agency, commercial or not-for-profit sectors.
Declaration of interests
The authors report no conflict of interest.


