Introduction
Drylands cover almost 40% of the Earth’s total land surface and are home to more than two billion people; these habitats contain a great variety of unique and endemic plant and animal species that are extremely sensitive to disturbances (Davies et al. Reference de Rochambeau, Fournet-Hanocq and Tien Khang2012). In the Americas, a high percentage of arid lands are subject to degradation due to the intensifying introduction of exotic cattle, now threatening biodiversity and significantly changing natural ecosystems (Chapin et al. Reference Cingolani, Noy-Meir and Díaz2000). Humans are highly dependent on these natural ecosystems for a variety of services (Daily Reference Davies, Poulsen, Schulte-Herbrüggen, Mackinnon, Crawhall, Henwood, Dudley, Smith and Gudka1997), and plant species are the main sources of food and shelter for both humans and livestock, highlighting an urgent need to study the impact of land use on plant biodiversity (Bellard et al. Reference Bellard, Bertelsmeier, Leadley, Thuiller and Courchamp2012). Maintaining the provision of goods and services in the face of anthropogenic disturbance aids with advancing both conservation and economic agendas, but the challenge remains considerable, given that ongoing climate change is deepening these effects (Hughes & Stachowicz Reference Lanfear, Kokko and Eyre-Walker2004, FAO Reference Frankham, Ballou and Briscoe2008).
The impact of large herbivores on the diversity of plant communities has been investigated in a variety of terrestrial ecosystems (Milchunas et al. Reference Milchunas, Laurenroth and Burke1998, Proulx & Mazumder Reference Ranker, Haufler, Soltis and Soltis1998, Metzger et al. Reference Mitton, Linhart, Sturgeon and Hamrick2005). Depending on the system studied, grazing can either increase, decrease or have no consistent effect on plant diversity (Proulx & Mazumder Reference Ranker, Haufler, Soltis and Soltis1998, Loreau et al. Reference Manly2001, Hanke Reference Hanke, Böhner, Dreber, Jürgens, Schmiedel, Wesuls and Dengler2014). In arid and semi-arid environments, however, several studies have shown negative impacts of livestock on plant density, species richness and cover of native vegetation (Perelman et al. 1997, Buttolph & Coppock Reference Buttolph and Coppock2004, Cingolani et al. Reference Collevatti, Grattapaglia and Hay2005, Zhao et al. Reference Zhao, Zhao, Zhou, Zhang and Drake2005, Tadey Reference Vallentine2006, Tadey & Souto Reference Weir and Cockerham2016). It has also been well documented that livestock affect sexual reproduction in plants by decreasing floral abundance and/or seed production (Whitham et al. Reference Yeh, Boyle, Yang, Ye, Mao and Yeh1991, Paige Reference Perelman, León and Bussacca1992, Strauss et al. Reference Tadey and Souto1996, Strauss & Armbruster Reference Tadey1997, Tadey 2007).
Quite apart from the effects on total plant population abundance, however, there is another important consequence of disturbance on the array of genetic diversity. Genetic diversity is the base of evolutionary potential of any species, providing an adaptive substrate for and improving their ability to survive stochastic events, such as pests or volcanic eruptions, as well as climatic or human-imposed environmental changes (Frankham Reference Goudet2005; Willi et al. Reference Zhao, Zhao, Zhou, Zhang and Drake2006; Lanfear et al. Reference Loreau, Naeem, Inchausti, Bengtsson, Grime, Hector, Hooper, Huston, Raffaelli, Schmid, Tilman and Wardle2014). Despite the importance of genetic diversity, few studies have investigated livestock impacts on the genetic diversity of consumed plants in the field. Livestock can cause direct and indirect effects on the genetic diversity of a given population. One direct effect would be the elimination of individuals from a population by consumption, with the consequent winnowing over the long run. In addition, livestock may indirectly affect the genetic diversity of consumed species by reducing their reproduction. If only a small group of individual plants contribute to the next generation, part of the genetic diversity of the population will be lost.
The Monte Desert is the largest and most arid biome of southern South America; it is characterized by scattered, shrubby vegetation and scarce grasses and palatable herbs (Cabrera Reference Cabrera1953; Tadey Reference Vallentine2006). This region has been arid since the lifting of the Andes, but like other arid regions of the world, this habitat is increasingly being used for livestock ranching. Low productivity and carrying capacity characterize the region, yet it is intensively used to feed a mixture of sheep, cattle, horses and goats (Tadey Reference Vallentine2006). Farming is performed by a large number of small producers in poor and marginal conditions. The traditional agricultural model has been orientated mainly towards wool and meat production, exceeding the carrying capacity of the system, which has resulted in continuous grazing schemes over large areas. Consequently, serious environmental degradation is observed in most of the Patagonian drylands (Ares et al. Reference Ares, Bertiller and Bisigato2003).
Here, we studied the effects of livestock on the genetic variation of dryland shrub vegetation, evaluating a grazing gradient under natural environmental conditions. We investigated the standing genetic variation and how livestock affects it along a stocking gradient in Patagonian Monte Desert. Particularly, we related increasing stocking rate with the neutral genetic variation found in codominant markers. We hypothesized that livestock decrease genetic variation in the standing population, either as a result of elimination of individuals or as a consequence of reduced reproduction of previous generations. Land-use change is leading to demonstrable, and in some cases dramatic, reductions in the genetic diversity within species (Young et al. Reference Whitham, Maschinski, Larson and Paige1996, Williams Reference Willi, Van Buskirk and Hoffmann2001). Genetic diversity, like species diversity, enhances the consistency and sustainability of ecosystems by providing biological insurance against environmental change (Hughes & Stachowicz Reference Lanfear, Kokko and Eyre-Walker2004). Understanding the ecosystem consequences of losses of genetic variation is critically important, particularly in conservation and restoration efforts.
Materials and Methods
Monte Desert Context
Fieldwork was conducted in Monte Desert, a temperate, arid region of Patagonia, Argentina (Neuquén province, 39º 17’S, 68º 55’W). Monte is a scrubland dominated by Larrea cuneifolia and Larrea divaricata and associated with other xerophytic shrubs such as Atriplex lampa, Bougainvillea spinosa, Monttea aphylla and Prosopis alpataco (Correa Reference Correa1969–1998). Grasses are naturally scarce in this region, representing only 6% of plant cover (Tadey Reference Vallentine2006). Mean annual precipitation is 200 mm and mean annual temperature is 15ºC (Akaike information criteria [AIC], meteorological station of El Chocón). In this region, livestock graze freely all year round, and given that paddocks lack water points, grazing intensity is similar within the confines of each paddock, so grazing is evenly distributed within each of them, rather than clustered around a water source. The livestock composition of each paddock is a mixture of cattle, horses, goats and sheep. We selected ten paddocks that have similar climatic and plant species compositions and edaphic characteristics (León et al. Reference Luikart, Sherwin, Steele and Allendorf1998, Tadey Reference Vallentine2006). The paddocks differ in stocking rate (Table 1), expressed in cattle ha–1 year–1 form, with each horse scored as 1.25 cows, each goat as 0.17 cows and each sheep as 0.3 cows (following Vallentine Reference Young, Boyle and Brown2001). To obtain a historical value for grazing pressure, we multiplied the stocking rate by the number of years each paddock had been sustained at similar disturbance levels, henceforth referred to as the stocking rate (Supplementary Table S1, available online).
Table 1 Sampled paddocks, stocking rate with stocking level (SL) in brackets, mean dung density per paddock and mean plant species richness per paddock. Species (LC=Larrea cuneifolia; LD=Larrea divaricata) and their average characteristics: plant height and diameter (Diam.), browsing index (%) and proportion of reproductive individuals (Rep.)
Focal Plant Species
The two studied species are L. divaricata and L. cuneifolia, both perennial creosote shrubs that are endemic to southwestern South America, now found in Bolivia, Peru, Chile and Argentina (Cabrera, Reference Cabrera1953). These species are members of the Zygophyllaceae family, closely related to Larrea tridentata (creosote bush), which is confined to North American deserts. These focal species are found in drylands, open woodland, scrubland and rough grassland and are the most abundant species of the Monte Desert (Tadey et al. 2009). In the absence of alternative sources of forage, which is a frequent situation in the region, cattle, horses, sheep and goats consume both Larrea species in about equal amounts, although L. cuneifolia tends to show less cover in highly grazed paddocks (Tadey Reference Vallentine2006). The four herbivores consume leaf biomass, as well as reproductive tissues.
Collection and Measurements
Within each paddock, we sampled the vegetation located at least 300 m away from the highway and more than 3 km from the farm houses. Plants were sampled randomly, attempting to embrace the largest area representing the species population in each paddock, with a minimum of 10 m between plants. Fresh leaves of both Larrea species were collected during spring from 30 plants within each paddock, totalling 300 individuals of L. divaricata from ten paddocks and 240 individuals of L. cuneifolia from eight paddocks, since this species is absent in two of the sampled paddocks. For each sampled plant, we measured height and crown diameter. To obtain an independent measure of browsing pressure, we estimated a browsing index per plant species and paddock, computing the number of browsed branches divided by the total number of branches for each sampled plant. When these species are reproductive, they produce large numbers of flowers, so we also recorded whether the sampled plants were reproductive or not in order to estimate the proportion of reproductive individuals per paddock (Table 1). To obtain paddock-level grazing proxies, we established ten circular plots (6 m diameter), separated every 50 m along a transect, randomly located in each paddock (totalling 100 plots). We measured dung density and animal source of dung, as well as the number of plant species (Table 1). For each plot, we also estimated plant cover as the relative area projected by each plant canopy onto the ground (Supplementary Table S1).
Isozyme Analysis
Genetic characterization of L. divaricata and L. cuneifolia individuals from paddocks under different herbivory pressures was performed by horizontal isozyme electrophoresis. Enzymes were extracted by grinding the leaf material with the buffer of Mitton et al. (Reference Paige1979). Homogenates were stored at –80°C until electrophoresis on 12% w/v starch gels was performed. Anodal (and, in the case of one enzyme, cathodal) slices were cut horizontally and stained for enzyme activity using the agarose-staining methods of Mitton et al. (Reference Paige1979) and Soltis et al. (Reference Strauss, Conner and Rush1983). Eight enzymes coding for 12 putative genetic loci were resolved using two gel and buffer systems that were reliably scored. These were: isocitrate dehydrogenese (Idh), malic enzyme (Me-1, Me-2), menadione reductase (Mnr), cathodal peroxidase (PerCat) and shikimate dehydrogenase (Skdh) on the morpholine-citrate system (MC) of Ranker et al. (Reference Schuster, Sandquist, Phillips and Ehleringer1989) and malate dehydrogenase (Mdh-1, Mdh-2), phosphoglucoisomerase (Pgi-1, Pgi-2, Pgi-3) and peroxidase (Per) on the boric-citrate buffer pH 8.2 by Poulik (1957). Electrophoresis was carried out at 4ºC with an ice bag on top of the gel until a bromophenol blue die migrated anodally approximately 10 cm from the origin. Alleles were sequentially numbered, with the most anodal allele assigned the lowest number.
Statistical Analyses
Genetic Variation and Structure
Although isozyme variation itself is mostly neutral, it has been reported that some loci showed selective sweep, reflecting selection or adaptation (Bergman & Gregorius Reference Bergmann and Gregorius1993). To detect whether there is selective sweep within each inferred population, the Ewens–Watterson test of neutrality was performed with the program POPGENE version 1.31 (Yeh et al. Reference Yeh, Boyle, Yang, Ye, Mao and Yeh1999) and the algorithm given in Manly (Reference Milchunas, Laurenroth and Burke1985). To obtain sufficient precision with this test, the probability was calculated using 1000 simulations. These neutrality tests showed that all 12 loci in all populations were neutral (Supplementary Table S5). Isozyme data were used to calculate the following parameters of genetic variation at paddock level: mean number of alleles per locus (A), mean effective number of alleles per locus (A E), the observed (H O) and expected heterozygosity (H E) and the percentage of polymorphic loci (%P, 95% criterion) using GenAlEx 6 (Peakall & Smouse 2006). Genetic relationships among populations of the two focal species were explored by multivariate cluster analysis using Nei (Reference Piry, Luikart and Cornuet1978) unbiased genetic distance following the unweighted pair group method with arithmetic mean using POPGENE version 1.31 (Yeh et al. Reference Yeh, Boyle, Yang, Ye, Mao and Yeh1999). The hierarchical genetic structures within and among populations were measured by Wright’s F statistic, based on polymorphic loci, using FSTAT v. 2.9.1 (Goudet Reference Hanke, Böhner, Dreber, Jürgens, Schmiedel, Wesuls and Dengler2000). Means for F statistics were computed by jack-knifing over polymorphic loci, and confidence intervals (95% CI) were obtained by bootstrapping, following Weir and Cockerham (Reference Williams1984). F ST values among different paddocks with similar stocking rates were calculated for both species.
We used the program BOTTLENECK version 1.2.02 (Piry et al. Reference Proulx and Mazumder1999) to test both species in all paddocks for recent bottlenecks. This program compares single-population H E values with the value predicted for the observed number of alleles under the assumptions of the mutation-drift equilibrium model (Ewens 1979), generating a distribution through simulating the coalescent process under the infinite allele model. We used a mode-shift indicator that allows for the identification of populations that suffered recent bottlenecks from allele frequency data (Luikart et al. Reference Metzger, Counghenour, Reich and Boone1998). A one-tailed Wilcoxon signed-rank test was used to identify heterozygosity excess, which has been suggested as the best method to analyse fewer than 20 loci (Piry et al. Reference Proulx and Mazumder1999).
To account for the relative genetic contribution of each individual to the next generation, and assuming that it depends on plant size (minus the portion consumed by livestock), we calculated a weight factor (WF) as size multiplied by (1 − browsing index), where size is the product of plant height and diameter. The relative WF (RWF) is a proxy for the number of times a genotype will be represented in the next generation and was calculated as (WF / lowest WF) in the population. The genetic population parameters A, A E, H O, H E and %P were calculated for each individual, weighted by its relative reproductive contribution to the next generation. We compared RWFs among stocking levels with Kruskal–Wallis analysis of variance using R 3.0.2 (R Development Core Team Reference Rowiński and Rogell2013).
Modelling Livestock Effects on Genetic Variation
We used linear mixed effects models to describe the relationships among stocking rate, browsing index, plant cover and plant species richness within each paddock. We then investigated the effects of these explanatory variables on A E, H E, %P and F IS. First, we evaluated the independent effects of the variables by building univariate models for each explanatory variable. Then we built multifactor models, combining explanatory variables (see the complete set of models in Table 2). The models were evaluated with a linear mixed model and the maximum-likelihood method in R package lme4 (Bates et al. Reference Bates, Maechler, Bolker and Walker2015). Stocking rate, percentage of plant cover and plant species richness were set as fixed effects, and plant species and paddock were set as random effects. Since the effect of herbivores on plant genetic variables could be complex and dependent on the interaction of diverse factors, we used a model selection with multiple competing hypotheses approach (Burnham & Anderson Reference Burnham and Anderson2002). To select the best model, we used AIC, where the model with the lowest AICc (corrected number of parameters; Burnham & Anderson Reference Burnham and Anderson2002) was considered to be the most plausible explanation of the observed patterns. Delta AICci (ΔAICci, where i represents each model) was calculated as the difference between AICc for the model i and the smallest AICc observed. We determined Akaike’s weight of evidence (wAICc) as the relative contribution of model i to explaining the observed pattern given a set of competing models (Burnham & Anderson Reference Burnham and Anderson2002). Models with ΔAICc <2 and wAICc >0.1 are equally plausible to explain the observed pattern (Burnham & Anderson Reference Burnham and Anderson2002). All analyses were performed using a maximum-likelihood approximation in the bbmle package implemented in R (Bolker & R Core Team Reference Bolker2016).
Table 2 Model selection for livestock effects on genetic diversity: A E (mean effective number of alleles per locus), H E (expected heterozygosity – genetic diversity) and F ST (inbreeding coefficient) in ten paddocks dominated by Larrea species from Patagonia Monte Desert. These models have stocking level and species as random factors. DF=degrees of freedom for each model; ΔAICc=delta Akaike information criterion among competing models corrected for small samples; wAICc=Akaike’s weight of evidence, representing the relative contribution of model i to explaining the observed pattern

Results
Livestock Effects on Plant Characteristics
Stocking rate was positively associated with both browsing index (R 2=0.40, p=0.016) and dung density (R 2=0.32, p=0.013). Increasing stocking rate also reduced plant cover (R 2=0.47, p=0.008) and plant species richness (R 2=0.47, p=0.009) (Supplementary Fig. S1 & Supplementary Table S2). Linear mixed-effects models showed that plant height, diameter, size and reproductive status of Larrea species decreased with increases in stocking rate and browsing index (all models with p<0.07) (Fig. 1 & Supplementary Table S4).
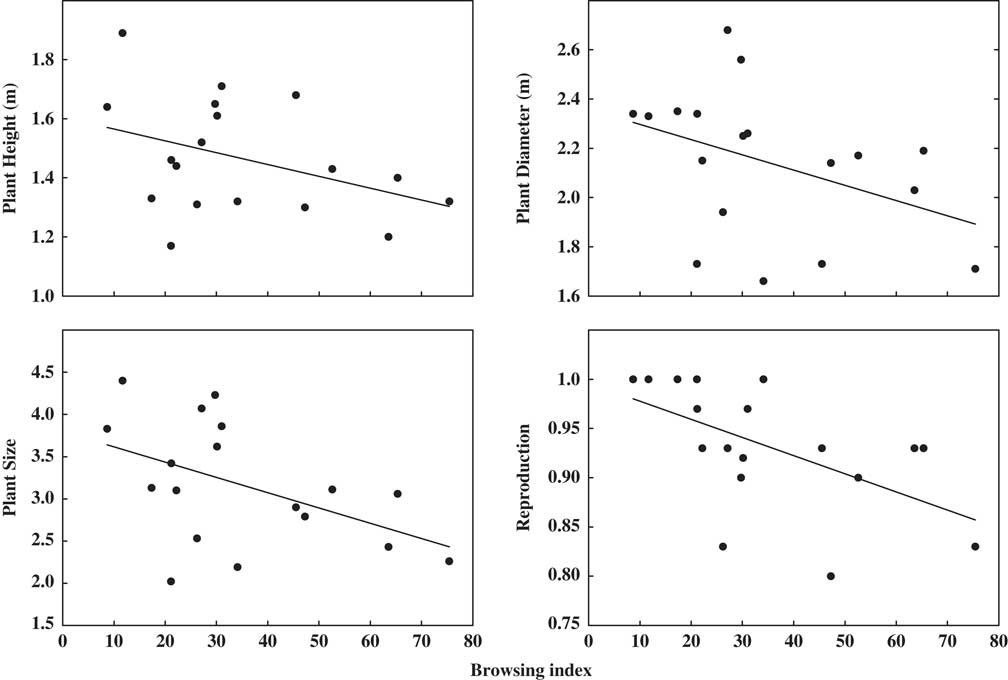
Fig. 1 Bivariate relationship between plant height, diameter, size, reproduction and browsing percentage in ten paddocks in Monte Desert rangelands.
Genetic Variation and Structure
Each of the 12 resolved loci were polymorphic in at least one paddock within both Larrea species, and the species were similar in their overall levels of genetic variation (Table 3). The multivariate cluster analysis yielded two groups, one for L. cuneifolia and the other for L. divaricata populations, clearly separating the two species (Supplementary Fig. S3). The genetic structures of both Larrea species were also similar and meaningful. There were high levels of inbreeding (F IS =0.21) and divergence (F ST =0.26) on average for L. cuneifolia and L. divaricata (Table 3). Both species have gone through population bottlenecks, regardless of the differences in stocking rates; about half the paddocks yielded significant excesses of heterozygosity sign tests (BOTTLENECK sign tests p<0.05; Table 3).
Table 3 Summary of average within-population genetic variation statistics of the ten studied paddocks of Larrea species. SL=stocking level; A E =mean number of effective alleles; H E =expected heterozygosity; %P=percentage of polymorphic loci; ACNG=average contribution to the next generation; Bn St=p-values of the sign test for evidence of a recent bottleneck under the infinite allele model; F IS =average fixation index; CI=confidence interval; F ST =inbreeding coefficient. LC=Larrea cuneifolia; LD=Larrea divaricata. Bold values represent statistically significant p-values according to the Wilcoxon one-tail test for heterozygote excess. Standard error (SE) values in parentheses. *Statistically significantly different from 0

The average contribution of each individual to the next generation, estimated via its RWF, increased with stocking rate (Fig. 2 & Table 3). In low-stocking-rate paddocks, all individuals appeared to contribute little to the next generation and in a similar fashion (4.80 ± 0.45). In high-stocking-rate paddocks, by contrast, few individuals disproportionately contributed to the next generation (61.89 ± 12.18) (Fig. 2 & Table 3). Notably, only 14% of the individuals had a RWF higher than 50 (only 64 out of 523 scored individuals) and contributed between 50 and 1400 to the next generation. These individuals were taller (1.84 vs. 1.41 m), showed lower proportions of browsed branches (26.1% vs. 36.4%) and most of them were reproductive (100% vs. 92.6%), but they evinced smaller numbers of alleles per locus (1.02 vs. 1.15) than 86% of the individuals in the population with RWFs less than 50 (Supplementary Fig. S2 & Supplementary Table S3).
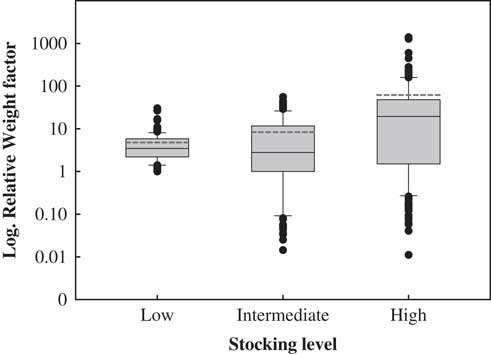
Fig. 2 Box plot of relative weight factors (RWF). The central square is the mean value, the box represents the standard deviation, the whiskers are 95% confidence intervals and the dashed lines represent mean values considering outliers.
Livestock Effects on Genetic Variation
Results of the model selection procedure indicate that the genetic variation of both Larrea species, measured as A E , H E and F ST , is most sensitive to increases in stocking rate (wAICc ≥0.99; Table 2). Meanwhile, models involving browsing index, plant cover and plant richness contribute very little to explaining the observed pattern (wAICc <0.004; Table 2). Highly grazed paddocks had lower A E and H E , and higher F ST than less heavily grazed paddocks (Table 3). Stocking rate was negatively associated with A E (R 2=0.24, p=0.047), but somewhat positively associated with genetic divergence F ST (R 2=0.35, p=0.086) (Fig. 3). Models including genetic variation measured as %P and F IS do not show statistically significant relationships with explanatory variables.
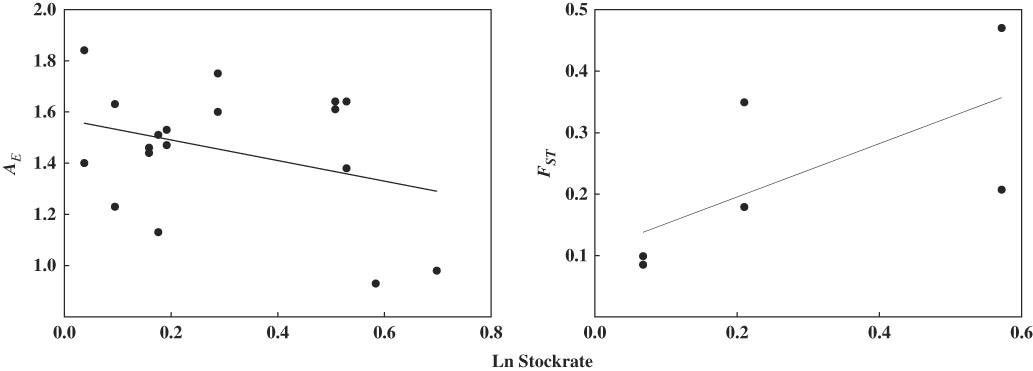
Fig. 3 Bivariate relationship between population genetic parameters (A E , F ST ) and stocking rate in ten paddocks in Monte Desert rangelands.
Discussion
Our results suggest that the standing crop of two dominant forage species of ecological importance in austral drylands show negative effects of livestock pressure on both morphological and genetic levels of variation, indicating both reductions in forage availability and genetic variation, coupled with increased non-random mating within paddocks. Although the effects of non-grazing and heavy grazing on vegetative structure have been documented in a wide range of ecosystems, the effects of moderate grazing, which is frequent on desert land, have remained poorly documented (Gamoun 2014). At the community level, previous studies have demonstrated a negative relationship between livestock density and plant cover, richness and abundance in the study area (Tadey Reference Vallentine2006, Tadey & Farji-Brener 2007), and we have here confirmed that same pattern for these dominant Larrea species. Despite the fact that creosote bushes have not been viewed as preferred forage species for livestock, we have observed that c. 35% of each plant showed signs of browsing, with consequent reductions in both their size and reproduction. The negative association between these phenological variables and both browsing and stocking rates is evidence of a reduction in forage quality as livestock pressures increase. Previous studies have also shown that, in the studied area, livestock affected pollination quality as a consequence of changes in pollinator species composition, richness and relative abundances (Tadey 2015). These findings, coupled with our results on declines in plant reproduction as a consequence of increased stocking rate, allow us to anticipate an impact on the future genetic variation of the forage species themselves.
Livestock Effects on Genetic Variation
L. divaricata and L. cuneifolia showed high levels of genetic variation, as expected for shrub species from arid lands, and these were even higher than their North American congener L. tridentata, which is an autopolyploid complex (Schuster et al. Reference Strauss and Armbruster1994). Theoretical and empirical studies have indicated that environmental heterogeneity can lead to the maintenance of high levels of intra-population genetic variation (Hedrick et al. Reference Hunziker and Comas1976, Gilliespie & Turelli 1989), yielding higher evolutionary potential in stressed conditions (Rowiński & Rogell Reference Soltis, Haufler, Darrow and Gastony2017). Intergeneric hybridization can also increase genetic variation, yet our results showed two separate clusters of populations with the higher genetic distance between species. Accordingly, it has been shown that intergeneric crossings between these two species produce completely sterile seeds (Hunziker & Comas Reference León, Bran, Collantes, Paruelo and Soriano2002). Despite the high levels of genetic variation observed, both focal species are already showing the impact of past bottlenecks, representing the accumulated impact of more than 100 years of ranching in this region. These effects are probably the result of breeding population isolation (Frankham et al. Reference Frankham2002), coupled with increases in mating among related individuals within single paddocks. Our results also show that the genetic contributions of the standing crop of adults to the next generation will be highly uneven, particularly in the more highly grazed paddocks. The long-term consequences of that would be progressive decay of future evolutionary potential within any single paddock.
We have shown here that the stocking rate accounted for much of the variation in genetic diversity and genetic divergence within both Larrea species. Methodologically, browsing index, plant cover and plant species richness contribute little to explaining the observed patterns of genetic variation, suggesting stocking rate as the tighter proxy for describing genetic losses. Meanwhile, neither stocking rate nor plant cover nor plant species richness can explain genetic parameters as %P and F IS , probably since these parameters are not yet showing the grazing effects. Our results suggest that grazing has negatively impacted the genetic variability within single paddocks and increased the divergence among them due to major reductions in effective population size. As the effective number of alleles within paddocks decreases, locally restricted genotypes are expected to emerge, increasing between-paddock divergence and potentially reducing the sustainability of the system as a whole. Such effects of disturbances may be detectable only after a certain threshold of alterations has been reached (Collevatti et al. Reference Correa2001).
Recommendations
We have identified a large and looming problem as a result of 100 years of genetic impact from ongoing land management practice. The applied approach that combines analyses of genetic and ecological data can give scientifically based insights in order to achieve both economic and environmental sustainability. Thus, an efficient plan for species conservation must not only account for human impacts and environmental suitability, but also assess the genetic variation of seedlings and adults in drylands subjected to overgrazing. Our findings, combined with those of related experiments (Tadey Reference Vallentine2006, Tadey & Souto Reference Weir and Cockerham2016), suggest that mitigation efforts should involve reductions in stocking rates, rotating/resting a portion of the paddocks each year and creating ‘refuge areas’ within paddocks by fencing off protected areas, which could allow pre-grazing processes to proceed. This could also protect both the plants and their pollinators, restoring Larrea species so as to increase the diversity of genotypes within each paddock by moving propagules from less grazed to more highly grazed paddocks, thereby enhancing the likelihood of long-term persistence in the face of changing conditions.
The near-term evolutionary potential of any species depends on the array of extant genetic variation, which constrains the ability to survive unexpected catastrophic events, diseases and changes in both climate and other environmental factors (de Rochambeau et al. Reference Ewens2000). The current availability of molecular markers, like nuclear-encoded microsatellites, could give a more detailed picture of the genetic variation of the different species in dryland communities. Maintaining, or even fostering, genetic variation within the forage community should contribute to the long-term sustainability of productive livestock ranching in dryland regions, where climatic stochasticity is the rule, rather than the exception.
Supplementary Material
For supplementary material accompanying this paper, visit www.cambridge.org/core/journals/environmental-conservation. Supplementary material can be found online at http://dx.doi.org/10.1017/S0376892918000280
Acknowledgements
We thank Peter Smouse for comments on early versions of this manuscript, Richard Ennos for developing the relative weight factor and three anonymous reviewers for improving the quality of our manuscript.
Financial Support
This work was supported by CONICET (PIP2011 IU D750) and ANCyT (PICT 2011-1578, PICT 2014-3478).
Conflict of Interest
The authors declare that they have no conflict of interest.