


Introduction
The main objective of radiation therapy is to deliver a therapeutic homogenous dose to the tumour site and to reduce dose to organs at risk (OARs). Intensity-modulated radiation therapy (IMRT) plans are found to be dosimetrically and clinically advantageous for gynaecological, prostate, head and neck, and brain cancer.Reference Norihisa, Mizowaki and Takayama 1 , Reference Yang, Xu, Jiang, Wang and Xie 2 IMRT provides excellent sparing of OARs, such as rectum and bladder in case of patients with cervix cancer, by using multiple beams. It is considered as an ideal technique and provides clinical and dosimetric advantages for treating cervix cancer.Reference Sheng 3 IMRT technique has the potential of reducing dose inhomogeneity within the target volume and hence it is considered a promising technique in significantly reducing the risk of complications from treatment. Most alarming complications are those involving urinary and gastrointestinal systems.Reference Wydra, Emerich, Sawicki, Ciach and Marciniak 4
Isodose lines and dose–volume histograms (DVHs) are two important tools which are used for the evaluation of dose distribution. DVH is the representation of quantified three-dimensional dose distribution. It quantifies minimum, maximum, modal and mean dose values delivered to the volume of interest and the critical organs. For the volume of tumour cells, dose distribution in DVH is easy to elucidate as it marks the isodose that covers the given percentage of target volume.Reference Feuvret, Noël, Mazeron and Bey 5 – Reference Hawrylewicz, Leszczyński, Namysł-Kaletka, Bronclik and Wydmański 7 DVHs are also suitable for providing the information about dose–volume coverage. Nevertheless, it is difficult and time-consuming to interpret the large amount of data present in these DVHs. So it is crucial to explore uncomplicated as well as fast tools to analyse dose distribution of the treatment plans. This helps the treatment planner to choose optimum plan which will provide maximum coverage of the tumour.
Precise delivery of the radiation dose to the target volume is often made complicated by tumour heterogeneity. For this reason dosimetric indices are extensively used for treatment plan evaluation. Homogeneity index (HI) is one of such tools.Reference Helal and Omar 8 Both under dosage and over dosage of planning target volume (PTV) are detrimental as the former increases the likelihood of tumour recurrence and the later results in acute reactions in the cell.Reference Lu, Lin, Zheng, Lin, Cheung and Huang 9 So better homogeneity of the target volume is advantageous in lowering the risk of radiation-induced toxicity and tumour recurrence.Reference Sheng 3 Aoyama et al.Reference Aoyama, Westerly and Mackie 10 proposed a formula of integral dose (ID) in normal tissues and employed this formula to compute and compare dose in PTV and surrounding tissue for different irradiation techniques. The ID is the measure of total dose deposited in the whole body and is used to determine the risk of complications due to radiotherapy. No ideal threshold value for ID is suggested, however it is recommended to maintain it as low as possible without compromising target coverage so that risk of relapse of malignancies is reduced.Reference Pasciuti, Kuthpady, Anderson, Best, Waqar and Chowdhury 11
This study aims to investigate HIs and ID for IMRT technique using 15 MV photon beams in case of patients with cervix cancer.
Materials and Methods
A total of 18 patients were selected at random, for the treatment of cervix cancer. Patient characteristics and disease stage is given in Table 1.
Table 1 Patient characteristics

Abbreviation: PTV, planning target volume.
All IMRT plans included seven fields and gantry angles were fixed at 0°, 30°, 60°, 105°, 180°, 255°, 270°, 300° and 330° delivered by Varian DHX Clinac (Varian Medical Systems, Palo Alto, CA, USA) equipped with 120 leaf multileaf collimator (MLCs). Plans were created for which no hotspot lies outside PTV.
Computed tomography (CT) images with slice thickness of 3 mm were acquired using CT simulator. Laser system was used to tattoo the patients after the determination of coordinates of organs to be treated by virtual simulation. Sliding window IMRT treatment planning was conducted with Eclipse Aria version 11 (Varian) treatment planning system using analytical anisotropic algorithm (AAA) software. Collimator angle and couch angle were set at 0° for all treatment plans. Dose of 5,040 cGy was delivered in 28 equal fractions.
Uniformity of dose to the PTV is evaluated by HI. The use of multiple beam angles result in improved homogeneity of IMRT plans. For better sparing of OARs, beam angles are optimised and the intensity of radiation beams is modified using MLCs until PTV is completely covered. Besides having the ability to effectively conform field shape, size and position; IMRT plans have advantage of providing desired homogeneous dose distribution in the patient body.Reference Pathak and Vashisht 12 , Reference Naik, Gurjar and Bagdare 13
In 1993, RTOG proposed recommendations for assessment of radiotherapy plans.Reference Shaw, Kline and Gillin 14 HI A, also referred to as maximum dose to the prescription dose ratio,Reference Kataria, Sharma, Subramani, Karrthick and Bisht 15 described dose HI as
 $${\rm HI A{\equals}}{{D_{{{\rm max}}} } \over {{\rm PD}}}$$
where D max is maximum dose to the target and PD the prescribed dose. Because of its simplicity, this formula is extensively used in clinical applications. If value of HI A is closer to 1, it indicates better homogeneity. Homogeneity of treatment plans, calculated using this formula, have acceptable values between 1 and 1·5. Equation (1) shows that lower HI values indicate a more homogeneous target dose.Reference Yoon, Park and Shin 16
Ratio of minimum to maximum dose is termed as radical dose homogeneity index (rDHI).Reference Oliver, Chen, Wong, Van Dyk and Perera 17 D min and D max represent point doses and use of true minimum and maximum doses is not reliable in practice. As for point dose D min or D max may be very low or very high so D5% and D2% are chosen to better represent maximum dose and likewise D95% and D98% represent minimum dose.
 $${\rm rDHI{\equals}}{{D_{{{\rm max}}} } \over {D_{{{\rm min}}} }}.$$
The ideal value is 1, while value >1 depict heterogeneous dose distribution.Reference Kataria, Sharma, Subramani, Karrthick and Bisht 15 According to International Commission on Radiation Units and Measurements (ICRU) report 83 D50% represents the median dose which is considered as normalisation value.Reference Grégoire and Mackie 18
Most commonly used formula in literature is.Reference Kataria, Sharma, Subramani, Karrthick and Bisht 15
 $${\rm HI B{\equals}}{{D2\,\%\,{\minus}D98\,\%\,} \over {{\rm PD}}}$$
where D2% and D98% represent near maximum and near minimum doses to 2 and 98% of target volume, respectively. In this case HI of zero scores to most homogenous dose distribution.Reference Magalhães 19
 $${\rm HI C{\equals}}{{D5\,\%\,{\minus}D95\,\%\,} \over {{\rm PD}}}$$
D5% represents the dose delivered to 5% of PTV which is most heavily irradiated and D95% is regarded as a dose delivered to 95% of PTV.Reference Dybwad 20 , Reference Sharyan, Allehyani and Tolba 21 For the last two formulae, ideal value is 0. A smaller value of HI indicates a more homogenous dose distribution.Reference Helal and Omar 8 , Reference Pathak and Vashisht 12 , Reference Dybwad 20 , Reference Murthy, Shukeili, Kumar, Davis, Chandran and Namrata 22 , Reference Krishna, Srinivas, Ayyangar and Reddy 23
The homogeneity volume index (HVI), represented as HI D, indicates homogeneity of the dose distribution inside the target volume and is calculated as a ratio of ID within target volume to the product of target volume and prescribed dose.
 $${\rm HI D}{\equals}{{{\rm ID}} \over {{\rm TV} {\times}{\rm PD}}}.$$
The HVI is a good indicator of the degree of dose uniformity inside the target.Reference Yomo, Tamura, Carron, Porcheron and Régis 24
The ID is equal to the product of mean dose to organ, volume receiving that dose and the density of that volume as represented by the following equation.Reference Hermanto, Frija, Lii, Chang, Mahajan and Woo 25
 $${\rm ID}\,\left( {{\rm GyL}} \right){\rm {\equals} }D_{{{\rm mean}}} \,{\times}{\rm }\,V{\times}\rho .$$
Complex calculations are required for determination of ID with variable tissue densities. Calculations are made simpler by considering uniform density of the patient’s body volume. No ideal threshold value for ID is suggested, however it is recommended to maintain it as low as possible without compromising target coverage.Reference Pasciuti, Kuthpady, Anderson, Best, Waqar and Chowdhury 11 The HIs of 18 cases were evaluated using four different formulas. Mean, standard deviation (SD), R 2 and coefficient of variation (CV) of HIs for PTV are calculated using SPSS software, version 18 (SPSS Inc., Chicago, IL, USA).
Results
Mean, SD and CV of HIs using four formulas is summarised in Table 2.
Table 2 Statistical analysis of four homogeneity indices (HIs) for planning target volume of 18 patients diagnosed with cervix cancer

Abbreviation: CV, coefficient of variation.
All the plans have values within acceptable range with no major or minor deviation as can be seen in Figures 1 and 2. After final analysis of results, mean values of HIs for formulas HI B and HI C gives homogenous dose distribution, which is quite close to ideal value, that is, 0. Mean value of HI C gives more homogenous dose distribution as compared to other formulas. The results suggest that for the patients with malignancies in cervix, any of the formula can be used to calculate HI. However, values of HI C were closest to ideal value as compared with other three formulae; hence, it is considered a better measure to compute homogeneity of dose within the target volume. On analysis of target volume data, volume varied from 1,866 to 1,248·4 cm3 with the mean value 1,495·8 cm3 for PTV.
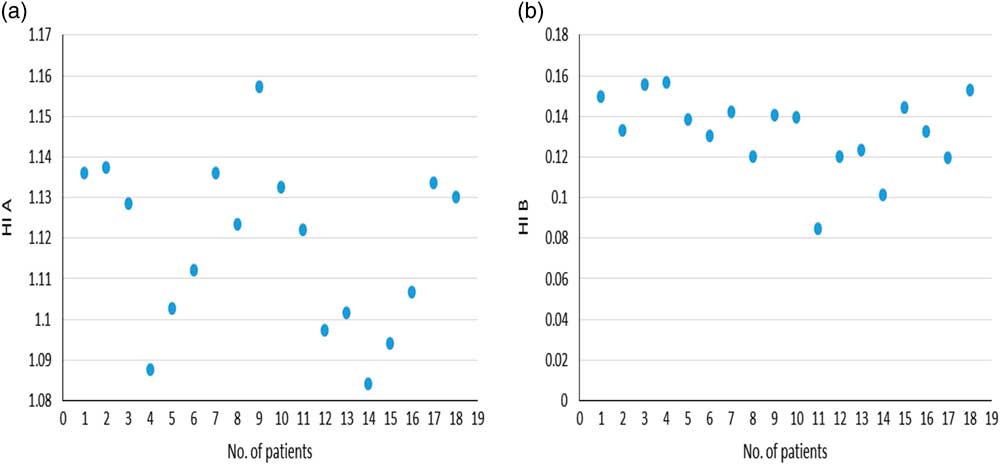
Figure 1 Number of patients versus (a) homogeneity index (HI) A and (b) HI B for 18 cases.
Good correlation was found between the HI B and the HI C (R 2=0·678). Low correlation was found between the all other formulas of HI as indicated in Table 2. Figure 3 shows the correlation between HI B and HI C. A linear regression to the data showed a poor fit for all other formulas. No trend was found which could predict the benefit of one formula over other. Figure 4 shows cumulative DVH representing PTV and OARs for cervix irradiation. It quantifies minimum, maximum, modal and mean dose values delivered to the volume of interest and the critical organs. Uniformity of IMRT treatment technique is evident by isodose distribution in Figure 5. The mean IDs of PTV, rectum and bladder are depicted in Figure 6.
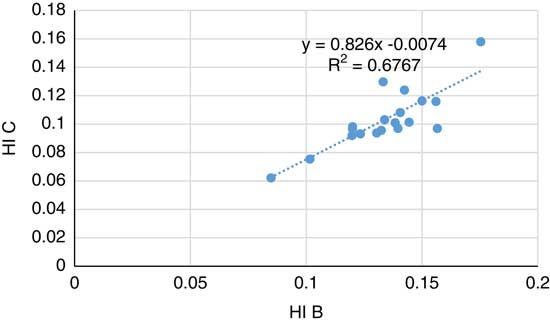
Figure 3 Relationship between homogeneity index (HI) A and HI B.
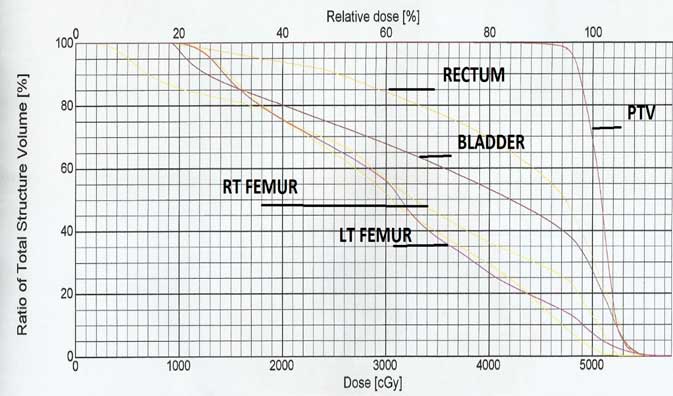
Figure 4 Cumulative dose–volume histogram of planning target volume and organs at risk.
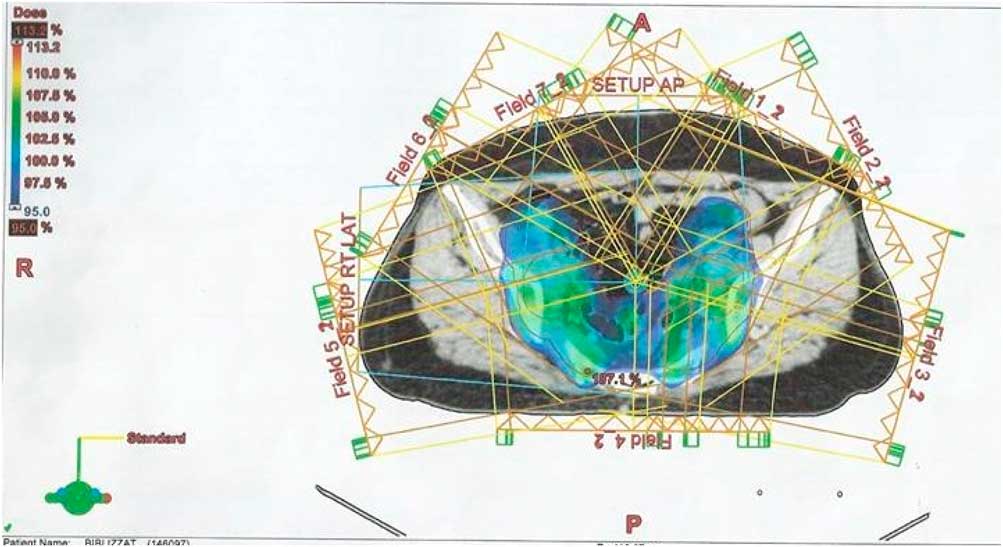
Figure 5 Dose distribution of intensity-modulated radiotherapy plan with 15 MV photon beam for patient with cervix cancer. Abbreviation: PTV, planning target volume.
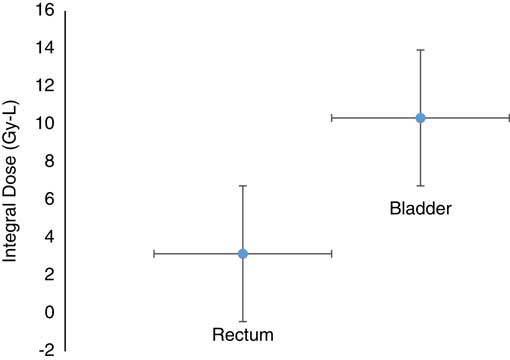
Figure 6 Mean value and standard error of the integral dose to bladder and rectum treated with intensity-modulated radiotherapy technique.
Discussion
Palm and JohanssonReference Palm and Johansson 26 reported no secondary cancer is developed in patients treated with 15 MV radiation beam as a result of treatment with IMRT radiotherapy technique. OARs include rectum, bladder and femurs. Often rectum is considered as dose-limiting organ. This study clearly demonstrated that favourable dose distribution in PTV is achieved using IMRT technique and hence the risk of damage to normal tissues is reduced. Helal et al.Reference Helal and Omar 8 suggested that prescribed dose, simple geometry and small tumour volume are parameters that describe good homogeneity of dose distribution. There is a paucity of data in literature regarding factors that influence HI. Search for factors that influence HI will help us to improve dose distribution in treatment plans in future.Reference Kataria, Sharma, Subramani, Karrthick and Bisht 15 No ideal formula or definition has been described in literature so far. There was a considerable agreement between HI using various formulas especially the formula HI B and HI C. Analysis of all formulas of HI reveal that there is level of agreement among various formulas. Each formula of HI gives maximum value for different patient as supported by Kataria et al.Reference Kataria, Sharma, Subramani, Karrthick and Bisht 15 According to their exploration they found that, HI show dependence on the prescription doses, extent and geometry of the target volumes when they calculated and compared HIs in the cases of brain cancer, thoracic and abdominal cancer. Moreover high radiation doses and target volumes of simple geometry and little extent and yield smaller values of HI, approaching zero, which indicate good homogeneity of doses. HI is capable of distinguishing between hot and cold spots, as it points out dose distribution intensity in target volume. According to ICRU report 62 homogeneity inside target volume is considered acceptable if PTV receives dose between 95 and 107% of prescribed dose PD. 27 ICRU report 83 suggests that inhomogeneous dose distribution in IMRT plans is caused by over dosage rather than under dosage. In IMRT plans radiations delivered to organs in motion or organs that undergo change in volume can give rise to low and high absorbed doses even after generous PTV margins have been outlined. OARs such as bladder and rectum are mobile structures that can affect the position of gross tumour volume. To minimise utero cervical movement, RTOG protocol suggests full bladder and empty rectum.Reference Jhingran, Winter and Portelance 28 Literature suggests that regions of low and high doses develop when more importance is given to avoid neighbouring healthy organs than PTV dose homogeneity.Reference Grégoire and Mackie 18 , Reference Donovan, Bleakley and Denholm 29 Kataria suggested that reduction in target volume results in improved homogeneity for all formulas.Reference Kataria, Sharma, Subramani, Karrthick and Bisht 15 However this present study revealed that no trend was found between PTV and HI. Inclusion of more patients in the present study would be helpful in making and conclusive remarks about the target volume on HI. A review of the literature suggests that although HI is a good indicator for an optimum plan, inspection of CT sections and DVH still remain an essential part of treatment plan assessment until ideal HI is discovered. To ensure correct delivery of radiation, it is extremely important that each step of quality assurance be performed on time and corrections implemented quickly. For the purpose of achieving accuracy in IMRT plans, it is crucial to carefully define target volume, OARs and other treatment delivery parameters. Results depict dose distribution in our institution for patients with cervix cancer to be quite homogenous. In all the treatment plans, doses to rectum and bladder were well below the tolerances as recommended by RTOG guideline P0126.Reference Michalski, Moughan and Purdy 30 It is often stated that ID to normal tissues decreases as the size of tumour increases for same anatomical regions. In case, if tumours are of same size, then ID increases with increasing anatomical sizes.Reference Aoyama, Westerly and Mackie 10 It is fair to assume that homogenous dose distribution of present study leads to better treatment outcomes. And this is also suggested in literature.Reference Pathak and Vashisht 12 , Reference Saenz, Paliwal and Bayouth 31 HI is a good indicator of quality of a plan and provides overview about dose inclination within the tumour. It is fair to assume that homogenous dose distribution observed in our treatment plans lead to better treatment outcomes. The analysis of all formulae of HI reveals that there is level of agreement among various formulas. There was a considerable agreement between HI using various formulas specially the HI B and HI C. Each formula of HI gives maximum value for different patients. Results would be further verified by including more number of patients in the study. It is recommended that determination of this parameter be taken into account in clinical practice when investigating a new technique.
Conclusion
This study clearly demonstrated that favourable dose distribution in PTV is achieved using IMRT technique and hence the risk of damage to normal tissues is reduced. For surrounding normal tissues such as rectum and bladder, ID gives satisfactory results, and better critical tissue sparing was achieved by using IMRT technique. This could result in improvement in patient’s quality of life. The results advocate that all the studied HIs can be used for assessment of uniformity inside the target volume.
Acknowledgements
The authors thank Radiation Therapy Department of Shaukat Khanum Memorial Cancer Hospital & Research Center.
Financial Support
This research received no specific grant from any funding agency in the public, commercial or not-for-profit sectors.
Conflicts of Interest
None.


