


Introduction
How important is the workplace for employees’ political donations? The extant work on money in politics assumes that most donors allocate donations based on ideological preferences or electoral competition (Ansolabehere, de Figueiredo, and Snyder Reference Ansolabehere, de Figueiredo and Snyder2003; Ensley Reference Ensley2009; Fouirnaies and Hall Reference Fouirnaies and Hall2014; Francia Reference Francia2003; Poole, Romer, and Rosenthal Reference Poole, Romer and Rosenthal1987), with the exception of more investment-oriented donations of chief executives (Gordon, Hafer, and Landa Reference Gordon, Hafer and Landa2007; Richter and Werner Reference Richter and Werner2017). Contrary to this widely held view, recent research on workplace politics highlights how employers in the United States engage in employee mobilization and coercion to advance corporate political objectives (Hertel-Fernandez Reference Hertel-Fernandez2018). However, it is not clear yet whether employers influence employees’ political donations, particularly for nonexecutive employees.
In this article, I investigate political alignment between firms and employees by linking employee and corporate Political Action Committee (PAC) donations from 12,737 publicly traded U.S. companies to 6,062 U.S. House and Senate candidates between 2003 and 2018. First, I show that 16.7% of all employee donation dollars and 12.9% of rank-and-file dollars go to company-PAC-endorsed candidates. These company-aligned contribution shares are more than double the size of simulated counterfactual donations to similar non-company-supported candidates. Second, I analyze a panel of 9,032 publicly traded firms and 1,089 House and Senate members. The within-firm–politician design allows me to rule out firm- and politician-level or dyadic explanations for alignment such as industry, geography, and long-standing firm–party relationships. I find that employees contribute 17.4% more dollars to candidates supported by their company PAC. The positive relationship between PAC and employee contributions holds not only for executives but even for rank-and-file employees.
Employee donors contribute more dollars to firm-supported politicians who are committee chairs, sit on powerful committees, are politically important for an employee’s industry, and who are ideologically moderate. Employees also donate more to company-endorsed politicians if their firm is more transparent about its policy preferences and preferred politicians and if candidates are endorsed by business-friendly associations, but I find no difference for firms with a track record of workplace political mobilization. In addition, I use a difference-in-differences (DiD) design, leveraging large swings in PAC’s partisan donations after changes in Congressional majorities. The DiD analysis shows that employees across all occupations change the partisan composition of their donations in line with their company. The effects are larger for executives and more modest for rank-and-file employee donors. Together with the strong evidence that corporate PAC donations are highly strategic (Fouirnaies and Hall Reference Fouirnaies and Hall2018; Powell and Grimmer Reference Powell and Grimmer2016), these results suggest that employees’ firm-aligned donations are driven by investment considerations instead of ideology.
As a consequence, corporations might be even more important in shaping political contributions, and by extension, who gets elected, than previously thought. The finding that even nonexecutive employee donors closely follow the donations of their employer raises the question as to whether companies pressure employees into donating to aligned candidates or whether they merely activate preexisting political preferences. This article also highlights the complementarities between different sources of corporate political influence. The relatively small corporate PAC donations might effectively be supplemented by employee donations, so that PACs might be more important to political candidates than one might otherwise assume. I further show that even within industries employee donors tend to support company-endorsed politicians, not only those with jurisdiction over their industry (Barber, Canes-Wrone, and Thrower Reference Barber, Canes-Wrone and Thrower2017). This emphasizes the importance of firm-specific as opposed to broad, sector-based sources of political preferences (Na-Kyung Lee and Liou Reference Lee, Haillie and Liou2019). Finally, if employee donations are partly a function of firm preferences, ideal points derived from individual donations (Bonica Reference Bonica2014) might reflect not only ideology but also corporate political strategy.
The second section of this article discusses employee and corporate PAC motivations to donate and under which conditions employees might align donations with their company. The following part describes the data. The fourth part shows the extent of firm–employee donation alignment, how employees react dynamically to firm donations, and which mechanisms might drive alignment. The final part discusses implications and avenues for future research.
Employee and Corporate Motivations for Political Donations
Corporate PAC Donations
Most theoretical and empirical research in Political Science and Economics suggests that PACs are ultimately interested in influencing public policy in their favor. The majority of political science work now postulates that PAC donations are not direct quid pro quo exchanges for future political favors (Tullock Reference Tullock1972); they are investment-oriented and directed toward buying access to legislators via contributions (Austen-Smith Reference Austen-Smith1995; Hall and Wayman Reference Hall and Wayman1990).
The view that donations are directly exchanged for political favors has been widely criticized due to the strong contribution limits,Footnote 1 the lack of evidence for donations yielding direct benefits (Fowler, Garro, and Spenkuch Reference Fowler, Garro and Spenkuch2019), and the high value of policies relative to the low donation amounts (Ansolabehere, de Figueiredo, and Snyder Reference Ansolabehere, de Figueiredo and Snyder2003; Milyo, Primo, and Groseclose Reference Milyo, Primo and Groseclose2000; Tullock Reference Tullock1972). At the same time, PACs have been found to be very strategic and access oriented in their contribution schedules. PACs donate 20% to 25% more dollars to incumbents (Fouirnaies and Hall Reference Fouirnaies and Hall2014), selectively target candidates sitting on powerful committees (Fouirnaies and Hall Reference Fouirnaies and Hall2018; Powell and Grimmer Reference Powell and Grimmer2016) with jurisdiction over their industry (Fouirnaies and Hall Reference Fouirnaies and Hall2018), and tend to value moderate rather than ideological legislators (Bonica Reference Bonica2013). Further, ideological groups and labor unions seem to be much more partisan than corporate PACs, which split donations more evenly between both parties (Barber Reference Barber2016b; Bonica Reference Bonica2013). In line with the access view, PACs making a contribution seem to get more face-to-face time with legislators (Kalla and Broockman Reference Kalla and Broockman2016; Langbein Reference Langbein1986). Also, lobbyists report in interviews that donations mainly serve to build and maintain relationships with legislators (Drutman Reference Drutman2015, 94–6).
Employee Donations
The extant literature broadly differentiates between two reasons for why individuals donate to politicians. First, individual donations might be motivated by ideology (Ansolabehere, de Figueiredo, and Snyder Reference Ansolabehere, de Figueiredo and Snyder2003), driven by the value of participating in the political process or supporting ideologically close candidates (Francia Reference Francia2003). Second, individuals might also view donations as an investment in line with their own material interests. Evidence suggests that individuals are ideologically motivated, except for high-level employees, whose donations seem more investment-oriented.
Individual donors regularly rank ideological reasons as the most important for donating (Barber Reference Barber2016a), and tend to give to more ideologically extreme candidates than nondonors (Barber Reference Barber2016b; Francia Reference Francia2003).Footnote 2 Donors are also wealthier, more educated, older, more likely to be white, and more likely to participate in primaries than voters who do not donate (Hill and Huber Reference Hill and Huber2017). In addition, Broockman and Malhotra (Reference Broockman and Malhotra2018) find that Democratic donors are more socially and economically liberal than nondonors and that Republican donors are much more economically conservative than Republican voters. Thus, some work suggests a connection between the political polarization of American politics and the reliance of politicians on individual donations (Bafumi and Herron Reference Bafumi and Herron2010; La Raya and Schaffner Reference Raya, Raymond and Schaffner2015). In contrast, research on the politics of chief executives shows that their donations tend to be more instrumental (Gordon, Hafer, and Landa Reference Gordon, Hafer and Landa2007; Richter and Werner Reference Richter and Werner2017), even though donations of corporate board members can be quite ideologically diverse (Bonica Reference Bonica2016a).Footnote 3 Barber, Canes-Wrone, and Thrower (Reference Barber, Canes-Wrone and Thrower2017) find a strong relationship between individual donations and whether a member of Congress sits on a committee regulating the donors’ industry. This indicates that despite strong evidence in favor of ideology as the main driver of individual donations, there is some connection between employee contributions and their industry of employment or position in a company.
Alignment between Corporate PACs and Employees
According to the literature, corporate PACs are expected to be driven by investment-oriented motivations and individual donors would seem to donate (mostly) based on ideology and industry of employment. Given this evidence, why should individual employees align their donations with their firm of employment? There are at least three mechanisms explaining alignment between firms and employees.
First, employees might align donations with the company because of career concerns or job security. Footnote 4 Employee donors can assume that firm-supported politicians will endorse policies that are good for the company, and by extension, for securing their own job. They could equally make donations to aligned candidates to signal to their superiors that they are committed to the company and to increase their chances of future promotions. Most importantly, we would expect donations of individuals to look more like investments. Thus, there should be more alignment for candidates who are politically useful for the employer. These candidates would include powerful members of important committees, committee chairs (Berry and Fowler Reference Berry and Fowler2018; Fouirnaies and Hall Reference Fouirnaies and Hall2018), and other politicians with access value (Hall and Wayman Reference Hall and Wayman1990; Kalla and Broockman Reference Kalla and Broockman2016; Langbein Reference Langbein1986). Furthermore, employees in a corporate environment where supported candidates and policies are communicated more clearly would be more likely to donate to the same candidates as their firm. In addition, high-ranking employees would be more inclined to donate instrumentally (Gordon, Hafer, and Landa Reference Gordon, Hafer and Landa2007) due to the stronger ties between their income and company profits, as well as their higher than average disposable income. These expectations contrast with the literature that finds that individual donors care mostly about ideology (Barber Reference Barber2016a; Broockman and Malhotra Reference Broockman and Malhotra2018; Hill and Huber Reference Hill and Huber2017). In that case, one would expect individual contributions to be largely unrelated to one’s company’s political preferences, access value of politicians, or the transparency of corporate donations.
Second, corporations might attempt to coerce their employees into donating to certain politicians. Hertel-Fernandez (Reference Hertel-Fernandez2018) finds that employers actively mobilize employees to turn out to vote and inform them about company-supported candidates on corporate websites and via leaflets and group emails.Footnote 5 Since the 2010 Citizen United decision, companies have the legal right to publicly support political candidates inside and outside of the workplace.Footnote 6 Further, the Business Industry Political Action Committee (BIPAC) assists companies in disseminating political information and tracking employee responses (Hertel-Fernandez Reference Hertel-Fernandez2018, 193–7).Footnote 7 However, employees report in surveys that encouragement to donate was the least-used mobilization strategy by employers (Hertel-Fernandez Reference Hertel-Fernandez2018). Therefore, alignment should be higher for companies with a record of workplace coercion, such as BIPAC members. Even though these first two mechanisms may seem more likely to play a role for low-ranking employees, it is by no means clear that senior managers and executives cannot be coerced into donating or making donations based on career concerns. For example, in a 2004 survey of senior S&P 500 employees, 24% of respondents who were vice president or higher reported that “not giving to their company PAC could be detrimental to their careers” (CFO 2004).
Third, employees might self-select into companies due to prior ideological considerations and policy preferences. This could be because employees get socialized in a certain political environment and start working where they grow up, leading to similar within-company political donations. Similarly, individuals could hold political views that affect the kind of company or industry they choose to work for. For example, environmental activists would probably choose not to work for a coal mining company and open-carry gun activists might not want to work for a nongovernmental organization that supports gun control. Recent work by McConnell et al. (Reference McConnell, Margalit, Malhotra and Levendusky2018) shows that individuals prefer working for copartisan employers and might even request lower wages from copartisans. Bonica et al. (Reference Bonica, Rosenthal, Blackwood and Rothman2021) show that physicians in the US sort into ideologically similar locations and workplaces after their residency. This suggests that donations would be mostly related to the geographic location of politicians and companies. In any case, the observable implication is that aligned donations may be more likely go to ideological politicians and not necessarily to valuable politicians.
Employee donors can learn about the donations of their company PAC via a variety of information channels: regular newsletters with updates on past and planned PAC donations, organized events to meet supported candidates, presentations educating employees about legislator positions, or external websites like www.opensecrets.org, as documented in the donor and employee surveys by Li (Reference Li2018) and Hertel-Fernandez (Reference Hertel-Fernandez2018). Likewise, politicians can know the workplace of individual donors because donors have to report their employer and their occupation if they cumulatively donate more than $200 within a reporting period. Candidates, in turn, need to make “best efforts” to determine workplace and position of itemized donors when reporting to the Federal Election Commission (FEC), risking fines and legal action for noncompliance.Footnote 8 PAC names usually contain the name of the corporation. Thus, candidates and their staff can observe whether PACs and employees of the same company donate to their committee. This could potentially be more challenging for candidates who receive donations from many corporate PACs and for small donations under the reporting threshold.Footnote 9
While some of these mechanisms operate at the firm level, others are more likely to operate at the industry level. On one hand, whether companies communicate preferred candidates and political positions to their employees or engage in coercion clearly varies at the firm level. Likewise, decisions on the specific candidates a PAC should donate to are taken at the firm level. On the other hand, whether firms seek access to policy makers depends on how vulnerable their industry of operation is to changes in regulation (Fouirnaies and Hall Reference Fouirnaies and Hall2016). Political economy scholars have long recognized that industries with more immobile assets are more likely to mobilize politically (Alt et al. Reference Alt, Carlsen, Heum and Johansen1999), as are firms in more concentrated industries and industries that depend heavily on government funding, like utilities and defense (Hansen, Mitchell, and Drope Reference Hansen, Mitchell and Drope2005). Employee donors might be aware of the political vulnerability of their industry of employment and thus be more likely to align their donations with their company.Footnote 10
While this article focuses on the interaction of corporate PACs and employee donors, it is important to note that companies are not the only actors that engage in workplace mobilization and that might affect employee donations. Most notably, labor unions mobilize workers politically, provide information on political topics (Kim and Margalit Reference Kim and Margalit2017; Macdonald Reference Macdonald2021), and might even change employee political preferences (Ahlquist, Clayton, and Levi Reference Ahlquist, Clayton and Levi2014). In addition, trade associations and ideological membership associations could also target employee donors. In comparison with corporations, these other actors might appeal to broader industry- or class-based preferences.Footnote 11
Finally, there are two major difficulties when testing these mechanisms empirically. For one, it is impossible to observe the internal decision making of PACs. Therefore, it is not clear whether at least part of the employees, such as executives or in-house lobbyists, could determine the donation targets of the PACs while simultaneously donating individually.Footnote 12 In addition, PACs cannot use money directly from corporate earnings; they can only use voluntary contributions from employees so that PACs cannot donate to candidates that are too ideologically distant from the median employee donor (Li Reference Li2018). I thus concentrate on establishing the relationship between candidate-specific corporate donations and employee donations at the level of the firm and provide tentative evidence to distinguish between these mechanisms.
Data Linking Firm and Employee Campaign Donations
In this article, I use data on employee donations linked to the corporate PAC contributions of their employers, from the FEC. The individual donation filings contain information on a donor’s name, employer, occupation, and address. Individual occupation descriptions and employer names are unstructured and self-reported. Thus, no unique identifiers exist for donor’s employer or their position in the company. To match individuals to their companies, I use string-distance matching described in Stuckatz (Reference Stuckatz2020): first, I lowercase the verbatim employer and occupation names, clean them (removing whitespace and certain punctuation), and canonicalize company types (e.g., “corporation” becomes “corp,” “limited’” becomes “ltd”). Second, from the remaining unique company and occupation names, I create a term-document matrix and weigh the entries by term-frequency-inverse-document frequency (tf-idf) so that commonly occurring terms (e.g., corp) receive less weight than more unique terms (e.g., microsoft). I then calculate the pairwise cosine distance between the names from the FEC data and the unique company and occupation names. The unique company names come from the financial database Compustat Capital IQ. The occupation names come from the “direct matching files” of the Census Bureau and the Bureau of Labor Statistics. These files contain over 20,000 occupation names matched to 850 unique occupations and their Standard Occupation Classification (SOC) code, including common abbreviations such as CEO, VP, or CFO for executive positions.
How accurate are the self-reported employer and occupation names? The FEC conducts regular audits to make sure that committees accurately report full name, employer, occupation, and address of all itemized individual donors. In principle, individual donors can misreport employer or occupation names, for instance, to conceal donations for particular candidates from their employer. However, committees must make their best effort to accurately determine employer and occupation before filing to the FEC. Findings of noncompliance can result in fines and further legal action.Footnote 13
I limit the period of investigation to the years 2003 to 2018 because data on individual occupations is only available from 2003 onwards. I also exclude noncandidate donations such as donations to associations and ideological groups. Then, I sum PAC and employee donations at the firm-candidate-cycle, to investigate when employees and PACs donate to the same candidates. I also divide employee donors into four types: any employees, top executives, government affairs employees, and rank-and-file donors.Footnote 14 Out of all dollar amounts donated to federal candidates between 2003 and 2018, 41.7% are from executives, 57.5% are from rank-and-file employees, and 1.2% come from government-relations officers. What share of individual employee donors are rank and file and how many employees in a given company make political donations? Around 75% of individual employees in the data who donate to federal candidates are rank-and-file employees, around 24% executives, and 1% government-relations officers.Footnote 15 It is also important to note that few employees makes political contributions. Using the number of employees as reported in the Compustat Capital IQ database, I find that about 1.5% of the publicly traded company employees covered in this article donate to federal candidates. This masks a lot of heterogeneity across companies. For example, while I find that 3,364, or 5.5%, of Morgan Stanley employees donate to federal candidates, only 745, or 0.4%, of Ford employees do so.
Using donations of publicly traded U.S. companies comes with certain limitations. First, the companies are larger than private companies and, thus, not representative of the population of U.S. companies. Donations from employees of these companies also differ slightly from the overall population of donors.Footnote 16 Second, I only analyze alignment on the same political candidate, but I leave out other types of alignment based on industry associations (e.g., the National Association of Manufacturers), ideological groups (Americans for Prosperity), or labor unions because information on political candidates, such as ideology or committee assignments, is more consistently measured. Third, I only observe itemized individual contributions.Footnote 17 As a consequence, I do not observe donations below $200, which might show more variation in donor occupations and sociodemographics (Alvarez, Katz, and Kim Reference Alvarez, Katz and Silvia Kim2020).
The final data on employee-politician and PAC-politician donations contain 815,905 employee donation transactions and 572,002 PAC transactions of overall 12,737 publicly traded companies to 6,062 federal candidates between 2003 and 2018. The employees work in 12,652 publicly traded companies and have 742 occupations. The PACs belong to 1,035 corporations, 950 of which appear in both employer and employee donations. These amount to US$541 million in employee donations and US$905 million in corporate PAC donations over 16 years.Footnote 18
Results
Descriptive Evidence on Firm–Employee Alignment
Table 1 summarizes alignment between employee donors and company PACs on the same candidate between 2003 and 2018. The leftmost column shows that 16.7% of the total dollar amount of employee donations goes to candidates supported by their employer PAC. The table also compares alignment across rank-and-file employees, top executives, and in-house lobbyists. Around 13, 21, and 39% go to the same candidate as the respective employees’ firm, respectively. Thus, occupations with more material incentives to donate strategically with the firm are more aligned. A slightly lower 13.5% of donation amounts go to employee-supported candidates in the same electoral cycle. Conditional on receiving a donation, employee contributions to non-PAC-supported candidates average $2,278, whereas donations to employer-supported candidates average $3,914. Thus, aligned employee donation amounts are 42% larger than nonaligned donations, on average.Footnote 19 This dollar premium for PAC-supported candidates is driven by top executives and rank-and-file employees.Footnote 20 For example, employees of Oracle donated approximate $2.8 million to 506 candidates between 2003 and 2018, $1.3 million (45.8%) of which went to candidates supported by Oracle’s PAC. When Oracle employees donated to a candidate, they donated on average $9,654 to PAC-supported candidates and $4,150 to nonaligned candidates.
Table 1. Percentage of Employee Donation Amounts to Same Candidate as Company PAC

Note: This table shows the share of total employee dollars donated to federal candidates supported by their company PAC. Between 2003 and 2018, 16.7% of employee donation amounts go to the same candidate supported by the donor’s employer PAC and 13.5% to the same candidates in the same electoral cycle.
The finding that 16.7% of donated employee dollars go to candidates supported company PACs masks heterogeneity between firms.Footnote 21 While some corporations like Nike or Lockheed Martin show an alignment of over 60% of employee donation dollars with PAC-supported candidates, Blackstone or Merill Lynch show alignment of under 20%, even though employees of the latter two contribute more dollars. I find the highest degree of alignment of close to 80% for Cintas, a provider of uniforms and other workplace supplies. Cintas has been reportedly active in informing their employees about their conservative policy and partisan stances.Footnote 22
Are these shares of aligned donations substantively large? Some alignment can be expected by chance due to colocation of employees and firms, overlaps in partisan preferences, or because donors tend to donate to incumbents (Fouirnaies and Hall Reference Fouirnaies and Hall2014). But one has to keep in mind that employee donors can choose from many different candidates in every electoral cycle.Footnote 23 To evaluate the extent to which observed alignment shares diverge from alignment by chance, I ran a simulation in which I randomly drew candidate recipients for a sample of individual donor transactions. I used increasingly stringent scenarios and drew candidates from the same office, state, and party as in the original donations or a combination of these characteristics. Additionally, I vary incumbency status. Overall, the findings in Table 1 are very unlikely to occur by chance. For example, if individual rank-and-file employee donors had randomly donated to candidates running within state for the same party and office, one would observe a share of aligned donated dollars of around 2%. Adding incumbency status results in simulated aligned shares of 3.5%, sampling from the same party and incumbents, or 6.2% for the same party, state, and incumbents. In comparison, I observe 12.9% of aligned rank-and-file donation dollars in the data, still double as much as in the most restrictive simulation.Footnote 24
This finding implies that a majority of all (83.3%), rank-and-file (87.1%), executive (78.9%), and government-relations (61.2%) donations do not go to the same candidate that is supported by a donor’s company. However, this does not necessarily mean that all nonaligned donations are ideological. In addition to electoral competition or ideological considerations (Barber Reference Barber2016a), employee donors can still be motivated by material interests that are not specifically related to the firm, such as class, occupation, industry, or asset ownership. Nonaligned employee donations are also biased toward incumbents and open-seat candidates, though to a lesser extent than aligned donations (Fouirnaies and Hall Reference Fouirnaies and Hall2014). Almost half of nonaligned contributions go to incumbents, and about a quarter go to challengers and open-seat candidates.Footnote 25 There are of course other ways in which employees might align their donations with their employer. First, employees might decide to support company-friendly candidates by donating to their employer’s PAC instead. Contrary to this idea, I find that individual employees who donate only to non-firm-supported candidates are less likely to donate to their company’s PAC, in particular rank-and-file employees.Footnote 26 Second, employees who do not align on the same candidate as their firm PAC might donate to industry associations or ideological organizations. However, these organizations represent broad industry or ideological interests rather than firm-specific ones.
Alignment is not driven by within-state donations. About two thirds of employee donations in my data go to out-of-state candidates, and about 57% of company-aligned donation amounts go to out-of-state candidates.Footnote 27 Alignment is also not driven by the number of candidates supported by corporationsFootnote 28 and happens on both Republicans and the Democrats, reflecting that, on average, corporate PACs split donations relatively evenly between both parties, with a slight Republican bias (Bonica Reference Bonica2014; La Raya and Schaffner Reference Raya, Raymond and Schaffner2015).
Dynamic Influence of Corporate PAC Donations on Employee Donations
The data presented above provides evidence to support that donations of employees and corporations are linked. But do employee donors react to company PAC donations over time? Below, I focus on all possible firm-politician-year combinations between 2003 and 2018 for donations to House or Senate members. I limit the analysis to this subset of legislators for the following reasons. First, I need additional information on the properties and activities of the politicians on whom firms and employees align. However, there is very little information on most federal candidates that is comparable across all candidates, such as positions on policies.Footnote 29 Second, there are simply too many candidates who only run once, inflating the already large number of observations.Footnote 30 The data used for further analysis below is an unbalanced panel of 1,089 Members of Congress and 9,032 publicly traded firms during a period of 16 years, 79,589,984 firm-politician-year observations in total. This includes all firm–politician pairs, with and without donations, so that I can observe employees and PACs starting to donate as well as the amount they donate. First, I investigate the effect of employer PAC donations on the amount of employee dollars donated to the same politician. I estimate the following linear model:
 $$ \begin{array}{c}\hskip-8pc \mathit{\log}\hskip-1.8pt \left( Employee\hskip0.5em {Donation s}_{ij t}\right)\\ {}\hskip-4pc ={\alpha}_{ij}+{\gamma}_t+\delta PAC\hskip0.5em {Donation}_{ij t}+{\varepsilon}_{ij t},\end{array} $$
where log(Employee Donationsijt) is the total logged US$ amount donated by employees of firm i to politician j in year t. PAC Donationijt is a binary indicator that scores one if the PAC of firm i donates to the same politician j in year t and zero if otherwise. The coefficient of interest δ indicates the percentage increase in the amount of employee donations to a candidate in a specific year given a simultaneous donation by the employer PAC.Footnote 31 I use firm–politician fixed effects, indicated by αij, as well as year fixed effects γt, so I only estimate the effect of within-firm–politician-pair PAC donations on politician-specific employee donations over time. All regressions also include a number of control variables.Footnote 32
First, I start with a model using all employee donations as the outcome in column 1 of Table 2. The results indicate a statistically significant 17.4% increase in employee dollars donated to PAC-supported candidates compared with nonsupported candidates. Given the large number of firms and politicians, this within firm–politician estimation is quite computationally demanding, but it takes care of a number of alternative explanations for alignment, such as geographic colocation or preexisting connections between particular industries and politicians.Footnote 33 The result also implies that contrary to Barber, Canes-Wrone, and Thrower (Reference Barber, Canes-Wrone and Thrower2017), employees do not tend to donate only to politicians who sit on committees regulating their industry, but even within industries, they donate more to the politicians supported by their own company.Footnote 34 In supplementary analyses, I find that the effects do not vary much across broad industries.Footnote 35
Table 2. Employee Donation Amounts and Firm PAC Donations, House/Senate, 2003–2018
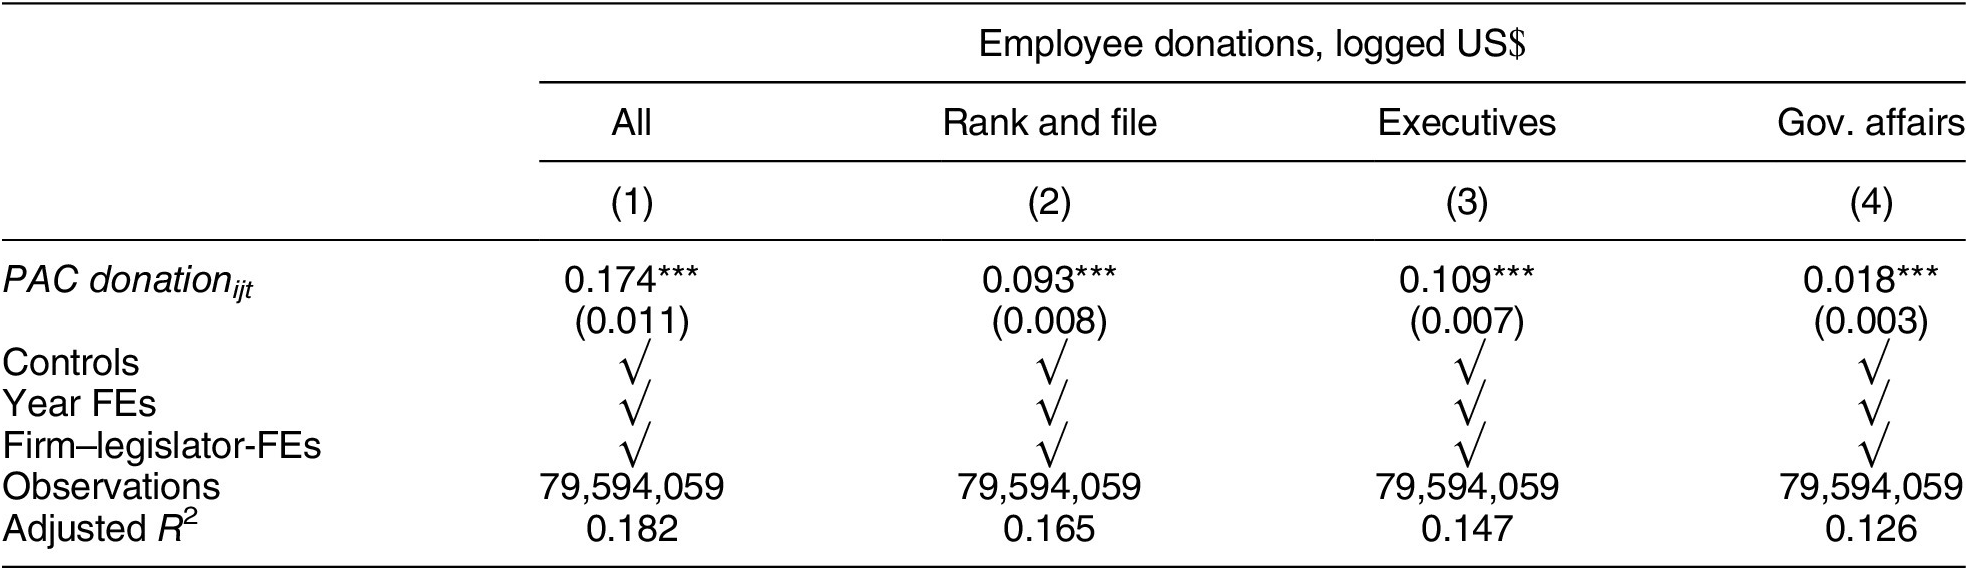
Note: Standard errors clustered by firm.*p < 0.1, **p < 0.05, ***p < 0.01.
In the second set of results, I concentrate on the change in employee donation amounts of different occupation types, for rank-and-file employees, top executives, and government affairs employees (column 2 to 4 in Table 2). As expected, executives see the largest increase in donations to a company supported politician, of about 11%, followed by rank-and-file employees, with 9.3%. In-house lobbyists show the smallest increase in the probability to donate of 1.8%.Footnote 36
Third, I investigate the timing of PAC and employee donations. If employees pay attention to the donations of their company, the effects of politician-specific PAC donations on employee donations should be stronger for contemporaneous and future donations and smaller or nonsignificant for past employee donations. It is possible that employers advertise a preferred candidate to employees before the corporate PAC makes a donation, for instance, by sending newsletters on past and planned PAC donations, organizing meetings with candidates, or making presentations to employees (Hertel-Fernandez Reference Hertel-Fernandez2018). This is reflected in the empirical setup, which uses employee contribution dollars aggregated at the firm-politician-year level so that employee donations can precede PAC donations in the same year. Figure 1 shows that the presence of a PAC donation increases employee dollars to a specific politician by about 17.4% in the same year, by 7.5% in the following year, and close to zero in subsequent years. I still find a smaller but significant effect of about 3% in the first year before the company donation, highlighting the possibility that companies might indeed communicate on preferred candidates before the PAC makes a donation. The pattern also reveals that the relationship between PAC and employee donations is short-lived, which speaks against these donations as a long-term investment (Snyder Reference Snyder1992).

Figure 1. PAC Donations and Employee Donation Amounts in Logged US$, 2003–2018
Note: This figure shows the effect of an employer PAC donation (1/0) to a specific politician in year t on the logged US$ amount of employee donations to the same politician, for contemporaneous (t), past (t – 1, t – 2, t – 3), or future (t + 1, t + 2, t + 3) employee donations.
The timing is reflected in real-life changes in employee donations. For example, Facebook Chief Operating Officer Sheryl Sandberg donated $1,392,300 between 2011 and 2018 to candidates, almost all of which went to Democrats. While Sandberg is partisan in her donations, she also donated to Senator Mazie Keiko Hirono (HI) in July 2017, only four months after the Facebook PAC donated to Hirono for the very first time. She donated to House Representative Zoe Lofgren (CA-16) on September 19, 2014, the same day that Facebook’s PAC donated to Lofgren and only 4 months after the PAC had donated to Lofgren for the first time in that cycle. Consistent with this pattern, Sandberg also donated to Democratic Senator Charles Schumer (NY) in April 2015, only days after the Facebook PAC had donated to Schumer for first time in the 2016 general election.
One concern to consider is that alignment could be larger in smaller firms with less collective action problems (Olson Reference Olson1965). However, the results are almost identical using logged sales or number of employees as measures of firm size.Footnote 37 The results are also robust to the inclusion of industry-year trends, industry-year fixed effects, or industry-legislator-year fixed effects. Therefore, the findings are not explained by industry-specific shocks or growth patterns.Footnote 38 The effects are also not driven by time-varying industry–politician relationships, like politicians pandering to specific industries, or their capacity to cater to industries via committee assignments (Berry and Fowler Reference Berry and Fowler2018; Fouirnaies and Hall Reference Fouirnaies and Hall2018).
Difference-in-Difference Analysis of Alignment
In order to further differentiate between ideological and investment explanations, I employ a difference-in-difference (DiD) design. I use swift changes in the partisan share of PAC donations over time to analyze whether employees change the partisan composition of their donations in tandem with their employer. If aligned employee donations are purely ideologically motivated, their partisan composition should not change over time. In comparison, corporate PACs mostly allocate their donations according to access to incumbents (Fouirnaies and Hall Reference Fouirnaies and Hall2014). Figure 2 above shows the partisan donation shares of 1,027 corporate PACs between 2003 and 2018 and the corresponding changes in Congressional majorities. PACs systematically shift donations between Republicans and Democrats depending on who controls Congress. Between 2003 and 2006, when Republicans held the presidency and both chambers of Congress, PACs donated around 35% of their funds to Democrats and 65% to Republicans, but PACs increased their Democratic contribution share to around 50% in November 2006 after Democrats took over both House and Senate.Footnote 39
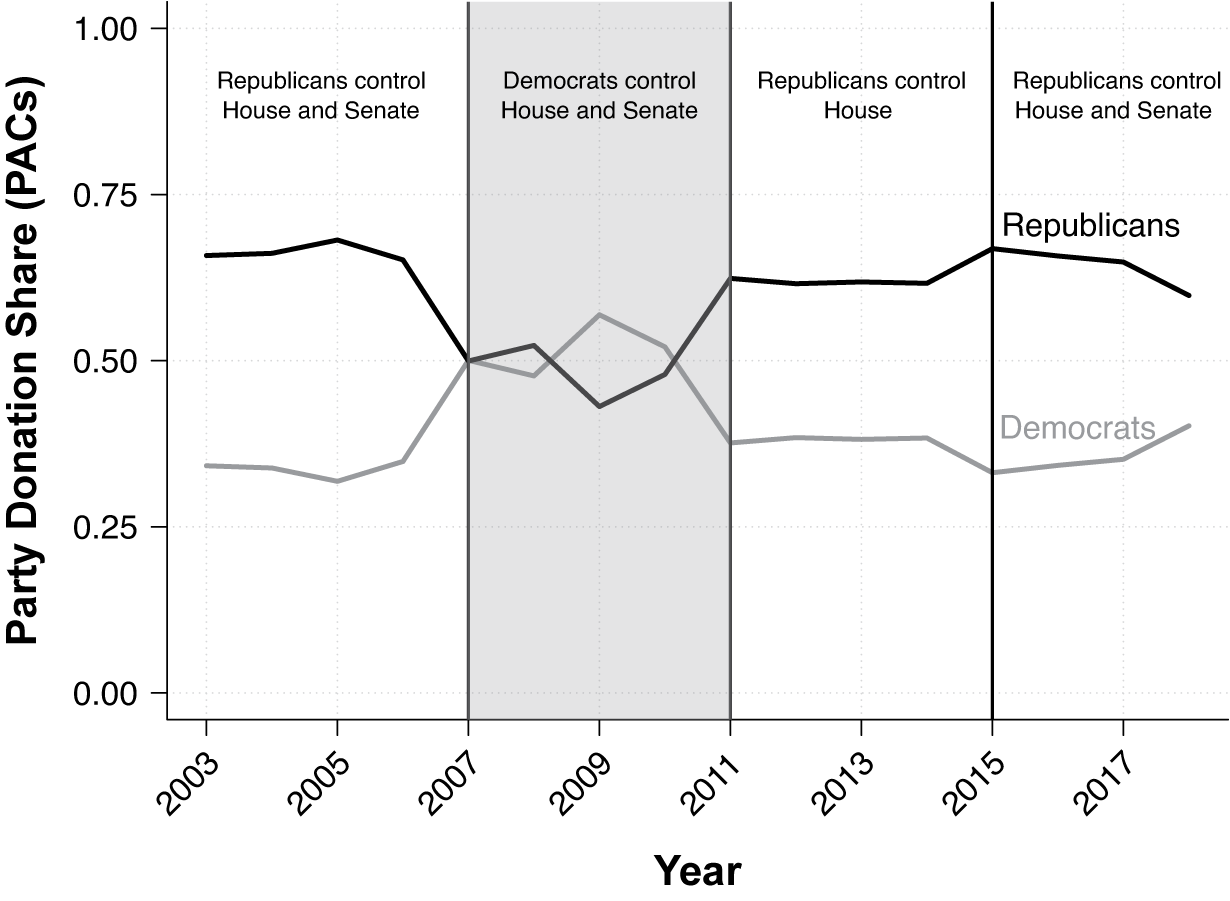
Figure 2. Partisan Donation Shares of Corporate PACs and Changes in Congressional Majorities
Note: This figure shows the partisan donation shares of 1,027 publicly traded firms’ PACs between 2003 and 2018. The black line indicates donations to Republican candidates, and the gray line shows donations to Democratic candidates. PACs switch the donation shares allocated to each party according to which party has a majority in Congress.
In the DiD, I estimate the effect of changes in partisan donation shares of PACs after the 2006 midterm elections on the partisan contribution share of employees.Footnote 40 Thus, I leverage the large swings in partisan donations after this election and that employees are often well informed about the partisan composition of their company’s PAC donations (Li Reference Li2018).Footnote 41 Between 2003 and 2010, I compare the Democratic-employee-donation share in firms with large shifts of PAC donations to Democrats to the Democratic-employee-donation share in companies in which PACs were less reactive to the change in Congressional majorities. I use the following DiD setup:
 $$ Employee\hskip0.5em DEM\hskip0.5em {Share}_{it}=\delta \left(\Delta DEM\; PAC\hskip0.5em {Share}_{it}\times Post\;{2006}_t\right)+{\alpha}_i+{\gamma}_t+{\varepsilon}_{it}, $$
where the outcome is the share of the US$ amount of employee donations of company i in year t to Democrats, ∆DEM PAC Sharei indicates the change in the average share of PAC donations of company i between the two years before and after the change in majorities, Post 2006 t is a dummy that equals one after 2006 and zero before, and αi and γ t are firm- and year-fixed effects. The coefficient of interest is δ, the interaction ∆DEM PAC Sharei × Post 2006 t. If employee donations change more strongly toward Democrats in companies where PACs donate relatively more to Democrats in 2006, this would provide evidence in favor of a material interest motive for alignment, as employees are unlikely to change their partisanship at the same time as the company for ideological reasons.
As can be seen in column 1 in Table 3, within-firm employee donation shares to the Democratic party increase significantly, by 12.8 percentage points, for a one-unit shift in PAC Democratic donation share after 2006. Differentiating between occupations, executives are the most reactive, changing donations by 13.1 percentage points compared with rank-and-file employees, with 7 percentage points, and government-relations officers, with only 5 percentage points. The changes are driven by employees donating more dollars to Democrats, not by reductions to Republicans.Footnote 42
Table 3. Employee Donations and PAC Donations, Difference-in-Differences Estimates, by Occupation, 2003-2010
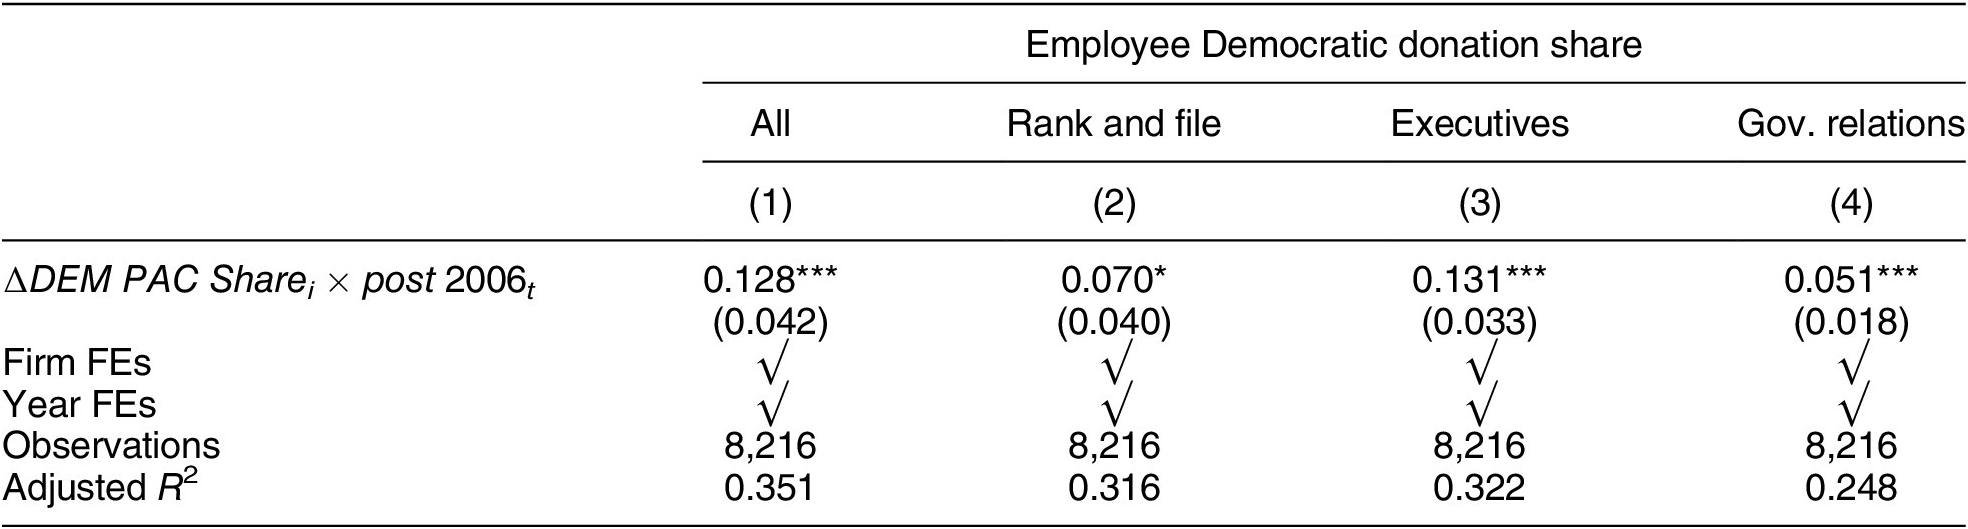
Note: Standard errors clustered by firm.*p < 0.1, **p < 0.05, ***p < 0.01.
How substantively large are these estimates? The coefficients in Table 3 refer to a one-unit increase in the Democratic PAC donation share (from 0 to 1), which might not be a typical shift in the sample of 1,027 firms. In fact, the mean range of the change in PAC Democratic donation share observed within firms is 17.4 percentage points, the 95th percentile around 53.3 percentage points, and 27.1% of the firms do not change their donation allocation after the 2006 midterm elections.Footnote 43 Following Mummolo and Peterson (Reference Mummolo and Peterson2018), I interpret the effects using changes in the treatment residualized with respect to the fixed effects used. A one-standard-deviation change in the residualized PAC donation share shift to Democrats (0.119) yields a 0.128 × 0.119 = 0.015, or 1.5-percentage-point change in overall employee Democratic donation share. A larger two-standard-deviation change in the residualized treatment implies a 3.1-percentage-point change in the outcome. The effects are slightly larger for executives (1.6% and 3.1%) and lower for rank and file (0.8% and 1.7%) and government affairs officers (0.6% and 1.2%).Footnote 44 Thus, while the results show some partisan realignment of employee donations, the effects are relatively modest, especially for rank-and-file and government-relations employees.
One concern about the DiD could be that the types of firms that switch their partisan donations after Congressional majority changes are systematically different from nonswitching firms or organizations that tend to donate to one party. For instance, PACs and members of labor organizations almost always donate to Democrats, whereas firms and employees in extractive industries tend to donate to Republicans (Bonica Reference Bonica2014). Thus, firms that drastically increase Democratic donations could also be more likely to attract employees who donate to Democrats or employees who are nonpartisan. However, I do not find any pretreatment trends in the share of employee donor dollars going to Democrats for any of the occupations.Footnote 45 Firms with larger shifts in PAC donations also do not have employee donors who systematically allocate donations more equally between parties.Footnote 46 Moreover, treated firms do not tend to come from particular industries.Footnote 47 Furthermore, it is not clear whether employees change their partisan donations or whether new donors with aligned donations are mobilized.Footnote 48 Still, tracking (and disambiguating) individuals, especially rank-and-file employees, over time is very challenging. In a supplementary analysis, I use individual executive-level data from Bonica (Reference Bonica2016a) and find that individual executives also change their partisan donations in response to swings in PAC donations.Footnote 49 Finally, one might be worried that economic shocks, like the Global Financial Crisis starting in 2007, might affect either PAC or employee donations, especially for the industries that faced more financial distress. The results are very similar using a shorter panel from 2005 to 2008Footnote 50, and the results do not change when I include industry-year trends or industry-year fixed effects.
Overall, the DiD estimates provide evidence against an ideological motive behind aligned employee donations and tentative evidence against self-selection of donors into politically aligned firms. Material motivations seem the most likely explanations for the findings. While it would seem more difficult to pressure executives into political activity (Hertel-Fernandez Reference Hertel-Fernandez2018), I cannot rule out workplace coercion for the rank-and-file employees.
Further Evidence on Alignment: Value, Transparency, and Ideology
Below, I provide further tentative evidence on whether alignment arises due to career concerns, self-selection, or coercion based on the value of politicians, transparency of corporate political activity, and ideology of candidates.
First, building on the literature that finds that committee membership is an important determinant of corporate donations (Berry and Fowler Reference Berry and Fowler2018; Fouirnaies and Hall Reference Fouirnaies and Hall2018), I investigate whether the politicians on whom firms and employee donors align are valuable for the company. If there is an investment-related mechanism behind aligning donations, aligned donations disproportionally go to politicians of value for one’s company. In the upper panel of Figure 3, I focus on within-firm–legislator variation over time and regress logged politician-specific employee donation amounts on a binary indicator for employer PAC donations to the same candidate in the same year. I then interact the PAC donation indicator with a dummy for whether a politician is chair of a committee, subcommittee, or whether the politician is a member of a powerful committee (Ways and Means or Appropriations) in a given year. The results show that in addition to the increase in contributions to PAC-supported candidates, employee donations increase by around 6.4% if the candidate is committee chair in that year. In comparison, being a subcommittee chair increases employee donations by only 3.5%. The largest increase is apparent for chairs of powerful committees, who see a positive change of about 10%.
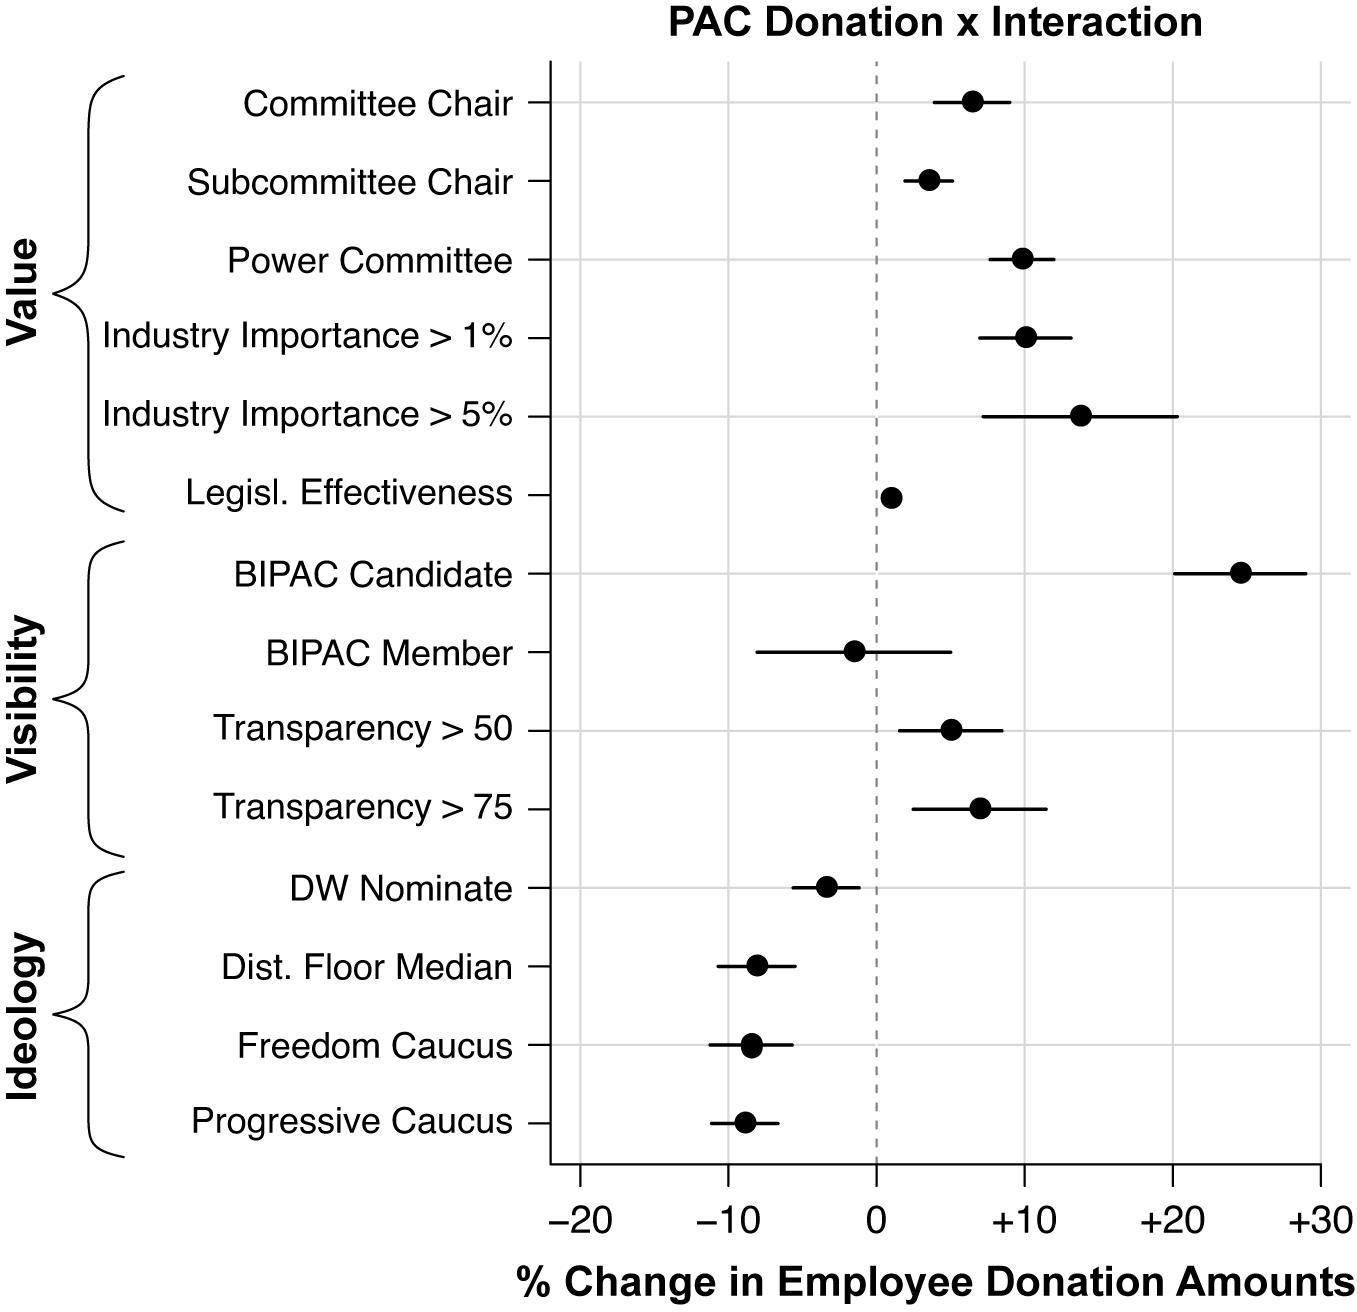
Figure 3. PAC Donations and Employee Donation Amounts in Logged $US, by Characteristics of Firms and Politicians, 2003–2018
Note: This figure shows the relationship between the PAC donations (1/0) of firm i to a politician j in year t and the logged US$ donation amount of firm i’s employees to politician j in year t. Each row is the result of a separate regression in which the binary PAC Donationijt indicator is interacted with firm- or politician-level characteristics, using the specification in Table 2.
The political value of a politician might depend on a company’s industry. I infer industry-preferred candidates from corporate lobbying activity. From the LobbyView database (Kim Reference Kim2018), I obtain firm-year-bill-level lobbying expenditures, linked to politicians sponsoring those bills. The firms can be linked to 86 broad three-digit industry codes. I then calculate the annual industry interest in a politician by dividing the amount of lobbying expenditures of an industry to this politician by the overall lobbying expenditures of the industry in that year.Footnote 51 This measure varies over politicians and time and takes into account that a firm might be regulated by multiple committes. I use binary variables indicating whether the industry share of lobbying expenses going to this politician in this year is larger than or equal to 0.01 or 0.05. When I interact the industry importance of a politician with politician-specific PAC donations, this interaction is significantly and positively related to employee donations. If an entire industry spends more than 1% or 5% of its lobbying resources on a politician, this is associated with a 10% and 13.8% increase in employee donations. This result is particularly striking, as one has to take into account that aligned donations are already to candidates that are politically important for the company; if not, it would be unlikely that PACs would donate to these politicians in the first place. Finally, I use the legislative effectiveness scores developed by Volden and Wiseman (Reference Volden and Wiseman2014) to see whether aligned donations go to more efficient legislators. More effective lawmakers are indeed receiving more aligned employee donations, even though the relationship is quite small.Footnote 52
Second, I look at the relationship between visibility of corporate political activity and employee donations. PAC donations are published by the FEC, but not every employee might be aware of the public availability of donations data. If donations are more likely to go to firm-supported candidates in more transparent companies, this could be either because employees can more easily self-select into aligned companies or because they can more easily observe which donation would be helpful for their employer. For the period between 2011 and 2018, the Zicklin Reports by the Center for Political Responsibility (CPA 2019) provide data on transparency of corporate political activity, such as donations, of 608 publicly traded companies of which 512 are also in the data used in this article. The Zicklin reports provide 24 different variables related to disclosure of political activity, such as whether a company publicizes supported candidates, has an easily accessible website listing political donations, or whether it publicizes the decision-making process for PAC donations.Footnote 53 I subset the data used above to the years between 2012 and 2018 for which the transparency score is measured reliably.Footnote 54 In Figure 3, I interact the transparency score for firm i in year t with the dummy for politician-specific PAC donations. I use different dummy variables indicating that the transparency score is above 50 and 75, respectively (the mean score is 43.2). Employee donations to PAC-supported politicians are about 4.1% or 5.7% larger for firms with a corporate political transparency larger than 50 or 75, respectively. Another way to investigate the effect of visibility on aligned donations is to leverage company membership in the Business–Industry Political Action Committee (BIPAC). Employees should be contributing more to PAC-supported candidates if their company is a member of BIPAC or if the candidate they donate to is BIPAC-endorsed. I collect data on BIPAC-supported candidates and BIPAC membership from the BIPAC website and the FEC filings of the BIPAC political action committee. Above in Figure 3, I show that employees donate 24.5% more dollars to BIPAC- and PAC-supported candidates,Footnote 55 but they do not spend more or less just because their firm is a BIPAC member. Though ultimately I cannot observe workplace pressure, I also fail to find evidence for this mechanism, as shown by the insignificant interaction between PAC donations and BIPAC membership. It is also consistent with survey evidence that shows encouragement to donate as the least-used mobilization strategy by employers (Hertel-Fernandez Reference Hertel-Fernandez2018).
Finally, I provide evidence on the relationship between alignment and politician ideology. A large literature observes that donors are more ideologically extreme than the average voter (Broockman and Malhotra Reference Broockman and Malhotra2018; Hill and Huber Reference Hill and Huber2017). If aligned donations go disproportionally to more ideologically extreme candidates, this would be more consistent with self-selection but less consistent with mechanisms based on material incentives.Footnote 56 In the lower panel of Figure 3, I first interact PAC donations with a politician’s DW-Nominate score (Lewis et al. Reference Lewis, Poole, Rosenthal, Boche, Rudkin and Sonnet2021). The coefficient on the interaction term is significant and slightly negative, indicating that a one-unit increase in ideology is associated with 3.5% decrease in employee donations to PAC-supported candidates. To see whether this is driven by more moderate or more conservative employee donations, I also interact PAC donations with the ideological distance of a politician to the median floor member of House and Senate, respectively, which ranges from 0 to 1.6. A one-unit increase in the distance to the floor median means a 8.1% decrease in donations for aligned politicians, suggesting that aligned donations tend to go to moderates. Last, I test whether alignment differs for more ideologically extreme caucuses of the Republican and the Democratic party, the Freedom Caucus and Progressive Caucus. Membership in both caucuses decreases alignment. Interestingly, the effect is almost equal in size, reducing aligned donations by about 8%.
Discussion
How do the findings of this article influence how we think about individual and corporate donations in U.S. politics? First, much of the money in politics literature has argued that PAC donations do not buy quid pro quo political favors (Ansolabehere, de Figueiredo, and Snyder Reference Ansolabehere, de Figueiredo and Snyder2003; Fowler, Garro, and Spenkuch Reference Fowler, Garro and Spenkuch2019). However, even if donations do not directly buy votes, this does not mean that PAC donations are unimportant for political representation. The relatively small donations by corporate PACs might effectively be multiplied by employee contributions, making PACs more important to candidates than one might otherwise assume. Thus, the results stress the complementarities between different types of political influence and the necessity to study them in conjunction rather than in isolation. Second, even within industries, employees donate more to candidates supported by their firm, not candidates with jurisdiction over their industry (Barber, Canes-Wrone, and Thrower Reference Barber, Canes-Wrone and Thrower2017), reflecting that sectoral economic preferences do not automatically translate into employee preferences (Na-Kyung Lee and Liou Reference Lee, Haillie and Liou2019). Finally, if donations of employees are at least partly a function of the political activity of the employer, ideal points that are derived from individual donations (Bonica Reference Bonica2014) might not reflect ideology but, rather, investment-motivated corporate political strategy.
The finding that even rank-and-file employee donations and corporate PAC contributions are aligned raises questions about the possibly coercive nature of this relationship. While I do not find evidence of workplace coercion in this article, I also cannot reject that pressure might play a role in influencing rank-and-file employee donors (Hertel-Fernandez Reference Hertel-Fernandez2018). However, it is important to note that firm-aligned employee donations do not need to be per se problematic, as employers might merely activate preexisting political preferences of employee donors. Other groups such as unions, while lacking the potentially coercive power of employers, also mobilize and inform employees about politics (Ahlquist, Clayton, and Levi Reference Ahlquist, Clayton and Levi2014; Macdonald Reference Macdonald2021). However, if employers systematically pressure employees into donating to company-friendly politicians, this might infringe employees’ freedom of political expression. It also calls into question the high transparency of donations in the US compared with that of other countries where the threshold for disclosing individual donors is often much higher.Footnote 57 U.S. disclosure rules make political finance more transparent for the public, but they also enable employers (and other actors) to monitor the political leanings and contributions of employees, which could facilitate political pressure and open the door for workplace discrimination.
Future research on money in politics should focus on the firm as a unit of analysis (Bertrand, Bombardini, and Trebbi Reference Bertrand, Bombardini and Trebbi2014; Kim Reference Kim2017; Osgood Reference Osgood2018) and pay closer attention to the complementarities between different strategies of corporate political influence. Future work should also hone in on how other actors, such as unions or trade associations, might affect the donations of employees or interact with firm-level mobilization efforts. Unions could potentially decrease employer pressure and reduce alignment or align employees’ interests more strongly with corporate interests. Linking firm-location-specific unionization data (Becher, Stegmueller, and Käppner Reference Becher, Stegmueller and Käppner2018) with employee and PAC donations data would enable researchers to investigate the role of unions in moderating alignment between firm and employee donations. In general, more information on how exactly corporations might influence employee donations is needed, and this might require using original surveys of employees (Hertel-Fernandez Reference Hertel-Fernandez2018) or donors (Broockman and Malhotra Reference Broockman and Malhotra2018)—especially outside of the US, where stricter campaign spending limits and the banning of corporate donations (Cagé Reference Cagé2020) make it impossible to use donations as a lens into firm-employee alignment. In addition, informal norms and corporate cultures vary widely across countries and might discourage or incentivize workplace politics in the first place (Cheng and Groysberg Reference Cheng and Groysberg2020). Future work should further investigate whether alignment of firm and employee donations is caused by self-selection into aligned companies or employees changing donation allocations. While the results in this article cannot be explained by geographic colocation and self-selection, recent work shows that physicians self-select into places with more ideological fit and leave workplaces with noncopartisan coworkers (Bonica et al. Reference Bonica, Rosenthal, Blackwood and Rothman2021). One possible future research project could be to match individual donor data from the FEC to high-quality voter registration files. Thus, one could track individuals over time, compare employee donations with primary registrations, and allow comparisons between employee donors and their coworkers. This would enable researchers to better understand political sorting mechanisms around the workplace across industries.
Supplementary Materials
To view supplementary material for this article, please visit http://dx.doi.org/10.1017/S0003055421000836.
DATA AVAILABILITY STATEMENT
Research documentation and/or data that support the findings of this study are openly available at the American Political Science Review Dataverse: https://doi.org/10.7910/DVN/GHRHU7.
ACKNOWLEDGMENTS
I thank Ben Ansell, Bruce Barry, Abhit Bhandari, Michael Becher, Kenneth Benoit, Brandice Canes-Wrone, Elizabeth Dekeyser, Greg Distelhorst, Maurice Dunaiski, Ray Duch, Andy Eggers, Victor Gay, Alex Hertel-Fernandez, Selina Hofstetter, In Song Kim, Yuzuru Kumon, Horacio Larreguy, Jieun Lee, Zhao Li, Imil Nurutdinov, Raluca Pahontu, Tom Paskalis, Elena Pupaza, Toni Rodon, Brian Kelleher Richter, Stephanie Rickard, Howard Rosenthal, Thomas Robinson, Nelson Ruiz, Mohamed Saleh, Moritz Schmoll, David Singer, Erik Wang, Stephane Wolton, and Hye Young You for comments and suggestions. I also thank participants of the 2020 APSA Frontiers of Money in Politics Research conference, the MaxPo-CEE Roundtable on Corporate Power, the IAST-TSE Tuesday Lunch Seminar, the 2019 Nuffield Workshop on Inequality and Representation, the 2019 Pyrenean Interdisciplinary Research Event (PIREN), the 2019 and 2021 EPSA Annual Meeting, the 2019 Oxford-LSE Politics Graduate Conference, the 2019 MPSA Annual Meeting, the 2019 GradNet Conference, the LSE PSPE Work in Progress seminar, and the 2018 International Political Economy Society Annual Meeting for valuable feedback and comments. An earlier version of this paper was circulated under the title “Political Alignment between Firms and Employees: Investment or Ideology?”
FUNDING STATEMENT
Funding from the French Agence Nationale de la Recherche (under the Investissement d’Avenir programme, ANR-17-EURE-0010) is gratefully acknowledged.
CONFLICT OF INTEREST
The author declares no ethical issues or conflicts of interest in this research.
ETHICAL STANDARDS
The author affirms this research did not involve human subjects.


Comments
No Comments have been published for this article.