Donkey milk composition is similar to human milk, except for the low and variable average total solid and fat content (Salimei & Chiofalo, Reference Salimei, Chiofalo, Miraglia and Martin-Rosset2006; Guo et al. Reference Guo, Pang, Zhang, Zhao, Chen, Dong and Ren2007; Giosuè et al. Reference Giosuè, Alabiso, Russo, Alicata and Torrisi2008). Donkey (Equus asinus) milk is well tolerated by infants with cow's milk allergy (Monti et al. Reference Monti, Bertino, Muratore, Coscia, Cresi, Silvestro, Fabris, Fortunato, Giuffrida and Conti2007; Vita et al. Reference Vita, Passalacqua, Di Pasquale, Caminiti, Crisafulli, Rulli and Pajno2007), is reported to be useful in the treatment of human immune-related diseases and in the prevention of atherosclerosis (Tafaro et al. Reference Tafaro, Magrone, Jirillo, Martemucci, D'alessandro, Amati and Jirillo2007).
Variations in thyroid hormone (TH) bioactivity allow the animals to adapt their metabolic balance to different environmental conditions, changes in nutrient requirements and availability, and to homeorhetic changes during different physiological stages (Todini, Reference Todini2007). The thyroid gland mostly secretes 3-3′-5-5′-tetraiodothyronine or thyroxine (T4), which is monodeiodinated to 3-3′-5-triiodothyronine (T3), the active form stimulating oxygen utilization and heat production in every cell of the body. Different ratios of blood/milk TH and T3/T4 in milk of various mammals suggest species differences in permeability of the blood-mammary barrier, or species differences in the conversion of T4 to T3 in mammary gland cells, or both (Akasha & Anderson, Reference Akasha and Anderson1984). Active T3 in colostrum and milk could play different physiological roles: a source of systemic T3 or a paracrine action supporting lactogenesis in the mother, or both. Physiological effects on the suckling offspring may be systemic or within the gastrointestinal tract, or both: positive effects on intraluminal digestion, absorption, maturation of enzyme systems (Sheard & Walker, Reference Sheard and Walker1988); macromolecule absorption by the intestine (Slebodzinski et al. Reference Slebodzinski, Lipczak and Brzezinska-Slebodzinska1995); responsiveness to gastrin and gastric secretion (Murray & Luba, Reference Murray and Luba1993).
Several studies have dealt with TH in milk of various mammalian species (Slebodzinski et al. Reference Slebodzinski, Brzezinska-Slebodzinska, Styczynska and Szejnoga1999), including mare (Slebodzinski et al. Reference Slebodzinski, Brzezinska-Slebodzinska, Nowak and Kowalska1998). However, there appears to be no information on donkey species, therefore it is interesting to evaluate bioactive molecules in order to contribute to a more complete knowledge of nutraceutical components in donkey milk.
With the aim of measuring TH concentrations in donkey blood and milk, the objectives of the present study were: (a) to validate ELISA methods for donkey serum, plasma and especially milk, a well-known critical matrix; (b) to evaluate the effects of sample collection and post-collection handling procedures in order to standardize them; (c) to assess the stability of TH in milk and blood serum and plasma samples stored at −20°C.
Materials and Methods
Animals and diet
Milk and blood samples were obtained 4 times from 4 healthy pluriparous lactating jennies (7 to 10 years of age, average bodyweight 240 kg). Animals were at mid-late lactation (110–170 d post-partum). Jennies, housed with their foals in boxes provided with wide external paddocks, were fed medium quality meadow hay ad libitum and 1 kg of barley daily.
Measurement of T3 and T4 concentrations in blood and milk using ELISA
Total concentrations of T3 and T4 were assayed using commercially available enzyme immunoassay (EIA) kits for clinical use in humans (T3KT1EW and T4KT2EW; Radim, Rome, Italy), which are competitive-type ELISA. Hormone in the sample competes with hormone conjugated with horseradish peroxidase for binding to specific antibody sites coated to the wells. At the end of the incubation, all unbound material is removed by aspiration and washing. The enzyme activity which is bound to the solid phase will be inversely proportional to the concentration of hormone in calibrators and samples and is evidenced by incubating the wells with a chromogen solution (tetramethylbenzidine, TMB) in substrate-buffer. Absorbance was measured using the photometric microplate reader Multiskan Ascent (Labsystems Oy, Helsinki, Finland), at 450 and 405 nm wavelength.
All the samples were assayed at least in duplicate. Precision of the methods was evaluated by calculating the mean intra- and inter-assay coefficients of variation (CV=SD/mean×100) of different pooled blood and milk samples, replicated 8 times in the same assay for intra-assay CV, or 6 times in different assays for inter-assay CV. The inter-assay CVs were obtained from aliquots of the same samples throughout a time period of 6 months (about once monthly), beginning 3 d after sampling (samples stored at −20°C), therefore the stability of TH in the working conditions was assessed. Linearity and specificity were evaluated by serially diluting whole milk, milk extracts, blood plasma and blood serum pooled samples with buffer and comparing obtained-expected values and the parallelism of the resulting inhibition lines with the standard lines (non parallelism test). Accuracy was evaluated by calculating the recovery rates (RRs) of known quantities (three levels) of hormones (T3 and T4 free acid, T2877 and T2376, Sigma, USA, solubilised in 0·05 M NaOH) added to whole milk, blood serum and plasma pooled samples with low TH concentrations (observed/expected values×100). Sensitivity indicated by the manufacturer is 0·16 and 4·5 ng/ml for T3 and T4, respectively.
Milk and blood sample collection, post-collection handling and storage
Milk and blood samples were obtained 4 times (at 1–2 wk interval) from 4 jennies, therefore 16 individual samples were utilized for evaluation of sample collection, handling and storage. To perform all the validation assays, following a first assay (immediately after sampling) the whole milk, milk extract, blood plasma and blood serum samples were pooled to prepare tubes at different hormone concentrations (high, medium, low). Pooled samples were utilized for intra- and inter-assay CV determinations at different concentrations, parallelism test (high), recovery rate test (low).
Animals were manually milked after a 3 h-separation from their offspring. Aliquots of whole milk samples (n=16) were utilized for extraction of iodothyronines with alkaline ethanol at low temperature, as described by Slebodzinski et al. (Reference Slebodzinski, Brzezinska-Slebodzinska, Nowak and Kowalska1998). Briefly, 2 ml cold (−20°C) alkaline ethanol (pH 9·0 with NH4OH) were added to 1 ml whole donkey's milk, mixed thoroughly with a glass rod, vortexed and left overnight in the freezer (−20°C). After 24 h the milk-ethanol mixture was vortexed, left in the freezer for a further 24 h and then centrifuged at 3500 g for 30 min at 0°C. Supernatant was collected and stored at −20°C. Twenty-four h before the assay, these supernatant samples were diluted 1:1 with the assay buffer. Milk samples were either immediately processed with alkaline ethanol at −20°C and the extracts stored at −20°C until assayed, or immediately frozen at −20°C and then thawed and processed for iodothyronine extraction, starting 3 d before the assay. Further aliquots of whole milk samples were directly stored at −20°C, or+5°C for 72 h. Further milk aliquots were skimmed by centrifugation (2500 g, 15 min, 4°C), then stored at −20°C, or+5°C for 72 h. Finally, further skimmed milk aliquots were acidified with absolute acetic acid (to pH 4·6) for casein precipitation, then centrifuged (2500 g, 15 min, 0°C) and the supernatant stored at −20°C, or +5°C for 72 h.
Blood samples (n=16) were collected by jugular venipuncture in evacuated tubes (Venoject, Terumo Europe NV, Leuven, Belgium) either containing K3-EDTA or without additive. Tubes with anticoagulant were immediately centrifuged (2500 g for 15 min) and the plasma aliquoted. Plasma and milk samples were immediately refrigerated and kept at +5°C while shipped to the laboratory (within 1 h). Aliquots of plasma samples were stored at −20°C, or kept at +5°C for 72 h, until assayed. Tubes without additive were left to clot at room temperature for 24 h and the serum aliquots were then stored at either −20°C or +5°C for 48 h.
Statistical analysis
The Student's t-test (SPSS, 2003) was used to compare results from different matrices and storage conditions from the individual blood or milk sample. An ANOVA for repeated measures (SPSS, 2003) was performed in order to evaluate a potential time effect on the results obtained from the inter-assay CVs, and thus on the stability of TH in samples stored at −20°C. Pearson's coefficient was used to evaluate the correlation between obtained and expected values from serial dilution of the different matrix samples and regression analysis to calculate parallelism with the calibrator lines (non parallelism test, GraphPad Prism 4.00 for Windows, 2003). Values are expressed as mean±SEM.
Results
Validation of ELISA
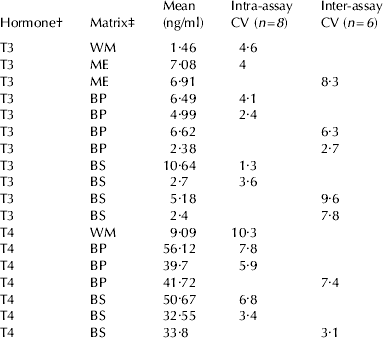
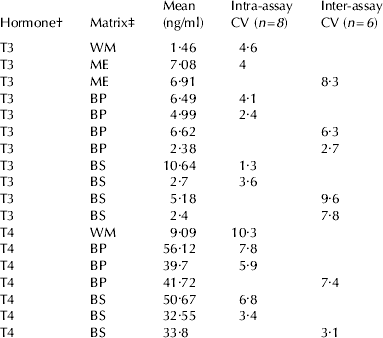
Regarding precision, intra- and inter-assay CVs of TH concentrations in different pooled blood and milk samples at different concentration are reported in Table 1.
Table 1. Precision: Coefficients of Variation (CV=SD/mean×100) of different pooled blood and milk samples, replicated 8 times in the same assay for intra-assay CV, or 6 times in different assays for inter-assay CV

† T3=3-3′-5-triiodothyronine. T4=3-3′-5-5′-tetraiodothyronine or thyroxine
‡ BP=blood plasma. BS=blood serum. WM=whole milk directly assayed. ME=milk extracted with alkaline ethanol
For T3 concentrations, serial dilutions of milk extracts, blood serum and blood plasma samples gave good correlation coefficients between expected and obtained values (r=0·99, P<0·01 for all three matrices) and displaced lines parallel to those of the calibrators (differences between the slopes not significant, P=0·61, 0·93 and 0·86 respectively), whereas whole milk did not: correlation between obtained-expected values was r=0·82, P>0·05 and regression line resulted different (P=0·03) from standards line (Fig 1A). For T4 concentrations, serial dilutions of blood serum and blood plasma gave good correlation coefficients between expected and obtained values (r=0·99, P<0·05 for both of the matrices) and regression lines parallel to those of the calibrators (differences between the slopes not significant, P=0·51 and 0·55 respectively) (Fig. 1B).

Fig. 1. Parallelism: displacement lines of milk extracts (ME, •), whole milk (WM, ○), blood plasma (BP, ▪) and blood serum (BS, ▴) samples serially diluted with buffer, and calibrator lines (STD, □), for assays of 3-3'-5-triiodothyronine (A) and 3-3'-5-5'-tetraiodothyronine or thyroxine (B) concentrations.
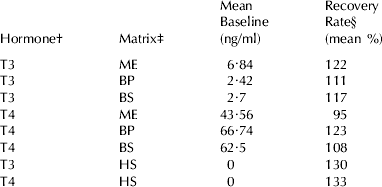
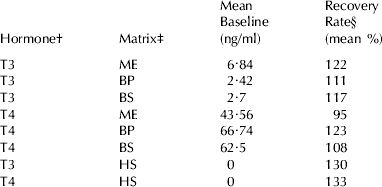
Accuracy values, as mean RR of known amounts of hormones added to different sample matrices, are summarized in Table 2. It can be seen that most of the mean RRs were above 100%. Such values were due to the highest amounts added: when the concentrations were around the middle of the calibration curves (1–4 ng/ml and 35–140 ng/ml for T3 and T4, respectively) the RR were always very near to 100%, whilst the highest values (4–8 ng/ml and 140–280 ng/ml, for T3 and T4, respectively) were always overestimated. This also occurred when hormones were added to human serum (zero calibrators provided with the kits). Recovery Rates of hormones added to whole milk directly assayed without extraction were inconsistent (data not shown).
Table 2. Accuracy: Recovery Rates of known quantities (three levels) of hormones added to whole milk, blood serum and plasma pooled samples with low TH concentrations

† T3=3-3′-5-triiodothyronine. T4=3-3′−5-5′-tetraiodothyronine or thyroxine
‡ BP=blood plasma. BS=blood serum. ME=milk extracted with alkaline ethanol. HS=human blood serum
§ Observed/expected values×100
Blood and Milk Samples Post-collection Handling and Storage
Triiodothyronine concentrations in individual samples (n=16) aliquots of whole milk (1·21±0·09 ng/ml), skimmed milk (1·2±0·05 ng/ml) and acidified milk (1·05±0·06 ng/ml) were not different, but they resulted always ca. six-fold lower than those in milk extracts (7·03±0·31 ng/ml). Storage of aliquots at +5°C for 72 h significantly lowered (P<0·01) T3 concentrations in whole, skimmed or acidified milk (overall mean 1·07±0·06 ng/ml, n=48) compared with the concentrations in the corresponding aliquots immediately frozen at −20°C (overall mean 1·24±0·08 ng/ml, n=48). In 4 pooled samples assayed 6 times during 6 months, the t-test revealed no difference of T3 concentrations in milk immediately processed with alkaline ethanol at −20°C and milk extracts stored at −20°C (6·65±0·13 ng/ml), or immediately frozen at −20°C and then thawed and processed for iodothyronine extraction, starting 3 d before the assay (6·67±0·13 ng/ml).
Most of the individual blood serum and plasma samples had T3 concentrations similar to or higher than the highest calibrator, therefore they were diluted 1:1 with buffer before further assays. For this purpose, BSA Tris buffer gave better results in terms of linearity (observed/expected values: 102±3%) than PBS Tween 20 buffer (76±2%) or distilled water (102±5%). Triiodothyronine concentrations were not different in blood plasma and serum individual samples (n=16) stored at −20°C (7·41±2·21 and 7·66±2·32 ng/ml, respectively) and in serum stored at +5°C for 48 h (7·57±2·36 ng/ml), but were lower (P<0·05) in plasma aliquots kept at +5°C for 72 h (6·77±2·09 ng/ml).
Triiodothyronine concentrations in 6 pooled samples of milk, blood serum and plasma did not significantly change during storage for up to 6 mo at −20°C (examples in Fig. 2A).

Fig. 2. Stability: 3-3'-5-triiodothyronine (A) and 3-3'-5-5'-tetraiodothyronine or thyroxine (B) concentrations in individual milk (•), blood plasma (▪) and blood serum (▴) samples stored at –20°C.
Mean T4 concentration (n=16) in whole milk directly assayed and stored for 72 h at −20°C was 7·34±0·8 ng/ml, but in whole milk stored at 5°C, skimmed and acidified milk at either storage temperature, very few samples showed concentrations above the sensitivity threshold (4·5 ng/ml), all others being below the detection limit of the assay. In most of the milk extract aliquots, T4 concentrations also resulted below the detection limit.
Thyroxine concentrations were not different in individual samples (n=16) of blood plasma (42·15±1·46 ng/ml) or serum (40·30±2·26 ng/ml) stored for 72 h at either storage temperature (41·34±2·32 and 41·11±1·58 ng/ml, at −20 and +5°C, respectively).
Thyroxine concentrations in 6 pooled samples of blood serum and plasma did not significantly change during storage for up to 6 months at −20°C (examples in Fig. 2B).
Discussion
There appears to be only one paper on TH in asinine species (Bugalia et al. Reference Bugalia, Sharma, Garg, Kumar and Chander2000), dealing with stallions whose blood TH concentrations were assayed by radioimmunoassay method (RIA) and results were much lower than in the jennies of the present study. On the other hand, in blood of one-year-old horses, assayed with the same ELISA kits, mean total T4 concentrations are similar and mean total T3 much lower than in lactating jennies of the present study (Fazio et al. Reference Fazio, Medica, Cravana, Messineo and Ferlazzo2007).
Both TH concentrations directly measured without previous extraction in whole, skimmed or acidified milk samples were repeatable, but the other validation parameters were absolutely inadequate. Dilution tests in milk directly assayed gave very poor results for T3 and, because of the low values, no linearity test for milk T4 concentrations was performed. On the other hand, good validation results were obtained for both TH concentrations in blood and T3 in milk samples extracted with alkaline ethanol. Following the dilution procedure of milk samples with alkaline ethanol for the extraction (1:2, plus 1:1 with buffer), T4 concentrations often fall below the sensitivity threshold. Low milk T4 levels are consistent with previous findings in different domestic mammals, showing milk T4 concentrations much lower (up to 30 times) than in blood (Slebodzinski et al. Reference Slebodzinski, Nowak, Gawecka and Sechman1986). The RRs of T4 added to milk samples and subsequently extracted indicated that the extraction procedure with ethanol was efficient, the assay method was accurate and, therefore, the values obtained were “true” low values. The RRs obtained for both the TH are acceptable for assay validations. Some reservations may arise for values approaching the highest levels of the calibration curves, which appeared to be overestimated by these assay systems. Because the same results occurred also with human serum, any specific matrix effect was clearly excluded. Therefore it is recommended to dilute samples with concentrations higher than or even approaching those of the highest calibrators, i.e. previously dilute plasma or serum samples for T3 assays.
Whether measuring blood TH concentrations in plasma immediately separated, refrigerated and frozen within one hour, or in serum separated and frozen after clotting for up to 24 hours at room temperature, results did not vary. It was previously reported that T4 concentrations are the same in dog plasma and serum (Behrend et al. Reference Behrend, Kemppainen and Young1998). In plasma kept 3 d at 5°C, T3 is lower than in aliquots immediately stored at −20°C. However, this did not occur in serum. In dog samples, T4 concentration increases after storage at 37°C for 5 d, compared with aliquots stored at −20°C (Behrend et al. Reference Behrend, Kemppainen and Young1998). In equine serum T4 increases after storage for 19–22 months at −20°C (Allen et al. Reference Allen, Scott, Cook, Fretz and Doige1997). In summary, following extreme storage conditions (high temperature or long time period) there is a tendency for T3 to decrease and for T4 to increase. The stability of TH in whole milk, alkaline ethanol-extracted milk, blood serum and blood plasma at −20°C was assessed by the good CVs obtained from assay sessions carried on during a six-month period.
The number of animals used in the present study was not large enough to make any general physiological assumptions. In most samples T3 concentrations in milk were similar to or slightly below those in blood, whereas in some cases milk concentrations were ca. three-fold higher than in blood, and data from other species are also contradictory (Slebodzinski & Gawecka, Reference Slebodzinski and Gawecka1983; Slebodzinski et al. Reference Slebodzinski, Nowak, Gawecka and Sechman1986). Bearing in mind that these methods measure total TH and the most part of blood TH is bound to plasma proteins which most likely do not cross the blood-mammary barrier, the high levels of T3 found in milk suggest that there is a very high T3 generation at mammary level. Further research should address the assay of the free fractions of TH in blood and the study of the mammary monodeiodinase activity.
In conclusion, the ELISA methods tested in the present study are suitable for determination of both TH concentrations in donkey blood plasma and serum samples obtained through the simplest and most common procedures. The results also validated the method for T3 measurement in milk after extraction with alkaline ethanol at −20°C. Further research will address physiological variations in blood and milk TH, and their potential biological actions, especially considering the marked and growing interest in donkey's milk as food for “sensitive” consumers, for example infant or elderly consumers and other individuals with food-related disorders. Dairy donkey breeding may have great potential as a tool for the sustainable development of marginalised areas.
The authors would like to thank Prof. Danilo Zampini and Prof. Luca Avellini (University of Perugia, Italy) for their useful advice; Dr. Pierluigi Mariani and Ms. Valeria Brunetti (University of Camerino, Italy) for their technical help; Mr. Davide Borghi and Mrs. Annunziata Reversi for the care of the animals. This study was partially supported by grants from the University of Camerino (FAR L. Todini).


