I. INTRODUCTION
Cobaltite perovskite oxides such as (La,Sr)CoO3−δ (LSC), (Sm,Sr)CoO3−δ (SSC), and (Ba,Sr) (Co,Fe)O3−δ (BSCF) are mixed ionic/electronic conductors with high electrocatalytic activity to promote oxygen reduction required for their use as cathodes in solid-oxide fuel cells (Sun et al., Reference Sun, Hui and Roller2009). Compared with LSC, SSC, with a smaller cation in the A site (Sm vs. La), has been demonstrated to show much better oxygen surface exchange kinetics (Fukunaga et al., Reference Fukunaga, Koyama, Takahashi, Wen and Yamada2000). Therefore, SSC has been extensively investigated as a promising cathode material for intermediate-temperature solid-oxide fuel cells (Tu et al., Reference Tu, Takeda, Imanishi and Yamamoto1997; Ishihara et al., Reference Ishihara, Honda, Shibayama, Minami, Nishiguchi and Takita1998; Xia et al., Reference Xia, Rauch, Chen and Liu2002; Yang et al., Reference Yang, Zuo, Wang, Cheng and Liu2008; Dong et al., Reference Dong, Chen, Ran, Park, Kwak and Shao2012).
The room-temperature structure of the SSC end-member, SmCoO3, has been studied previously in the context of solid-solution series with Ni (Pérez-Cacho et al., Reference Pérez-Cacho, Blasco, García and Sanchez2000), Fe (Kharko et al., Reference Kharko, Vasylechko, Ubizskii, Pashuk and Prots2014), and Sr (Tu et al., Reference Tu, Takeda, Imanishi and Yamamoto1997), which, in all cases, was reported as the orthorhombic Pbnm space-group [standard setting Pnma, no. 62 (Hahn, Reference Hahn1995)]. Tu et al. (Reference Tu, Takeda, Imanishi and Yamamoto1997) do report the rate of SmCoO3 thermal expansion up to 1000 °C; however, this was measured on bulk, polycrystalline specimens, and reveals no information about any thermal expansion dependence on crystallographic parameters.
The aim of our research programme is to investigate the atomic structure, thermal expansion behaviour, and electrochemical properties of various perovskites in order to correlate their structural parameters and behaviour as a solid-oxide fuel cell cathode. This work reports the temperature-dependent structure of SmCoO3 from room temperature to 1245 K.
II. EXPERIMENTAL
A. Sample preparation
SmCoO3−δ powder was synthesised by the combined citrate and ethylenediaminetetraacetic acid (EDTA) complexing method (Wang et al., Reference Wang, Tao, Shao and Wang2009; Shao et al., Reference Shao, Zhou and Zhu2012; Chen et al., Reference Chen, Li, Ai, Cheng, Rickard and Jiang2016). The raw chemicals were Sm(NO3)3·6H2O (99%, Sigma-Aldrich), Co(NO3)2·6H2O (98.0–102.0%, Alfa-Aesar), citric acid (99.5%, Chem Supply), EDTA (99%, Acros Organics), and ammonia (28%, Ajax Finechem). The molar ratio of metal ions/citric acid/EDTA was 1:1.5:1. The resultant powder was calcined at 900 °C in air for 2 h.
B. In situ synchrotron X-ray powder diffraction
High-resolution X-ray powder diffraction patterns were collected using the Powder Diffraction beamline (Wallwork et al., Reference Wallwork, Kennedy and Wang2007) at the Australian Synchrotron. A monochromatic X-ray beam with an energy of 15.5108 keV [determined from LaB6 (NIST SRM 660b)] was used in order to keep away from the Sm L absorption edge to avoid spurious detector effects arising from specimen fluorescence. Data were collected over the angular range 3–83°2θ using an array of Mythen position sensitive detector modules (Schmitt et al., Reference Schmitt, Brönnimann, Eikenberry, Gozzo, Hörmann, Horisberger and Patterson2003). To eliminate the gaps between the individual Mythen modules, the diffraction patterns were acquired in pairs with a goniometer rotation of 0.5°2θ between each pattern, and merged using the program CONVAS2 (Rowles, Reference Rowles2012). The SmCoO3 powder was loaded in a 0.5 mm quartz capillary and mounted in Debye–Scherrer geometry. The capillary was continuously rotated about its long axis at ~1 Hz in order to provide even heating, improve particle statistics, and ensure accurate relative peak intensities.
The specimen was heated using a hot-air blower at a constant rate of 8 K min−1 from room temperature up to 1245 K before cooling as rapidly as possible. The temperature was controlled by a thermocouple placed between the nozzle of the hot-air blower and the capillary. The specimen temperature was calibrated (Stinton and Evans, Reference Stinton and Evans2007) using the known thermal expansion coefficients (TECs) of corundum (Taylor, Reference Taylor1984) applied to NIST SRM 676a. In situ diffraction patterns were collected for 45 s in each goniometer position, with approximately 13 s between each diffraction pattern for goniometer movement, for the duration of the experiment.
III. RESULTS AND DISCUSSION
Select diffraction patterns over the entire temperature range were indexed by the SVDIndex algorithm (Coelho, Reference Coelho2003) in TOPAS (Bruker AXS, 2014) and were all found to be consistent with the orthorhombic space-group Pnma, as has been found in previous room-temperature studies (Tu et al., Reference Tu, Takeda, Imanishi and Yamamoto1997; Pérez-Cacho et al., Reference Pérez-Cacho, Blasco, García and Sanchez2000; Kharko et al., Reference Kharko, Vasylechko, Ubizskii, Pashuk and Prots2014). There were several unidentified minor impurity peaks present, but they were able to be discounted, as their thermal expansion behaviour was markedly different to that of the main perovskite phase.
All diffraction data were analysed by the Rietveld method (Rietveld, Reference Rietveld1969) as implemented in TOPAS. Refined parameters included background coefficients, specimen displacement (Scarlett et al., Reference Scarlett, Rowles, Wallwork and Madsen2011), lattice parameters, profile coefficients, atomic position coordinates, and isotropic atomic displacement parameters. The zero offset was constrained to be the same over all patterns. The effect of specimen absorption and capillary geometry on peak intensities and profiles was modelled using a capillary aberration function based on the work of Sabine et al. (Reference Sabine, Hunter, Sabine and Ball1998). The temperature calibration data were parametrically refined (Stinton and Evans, Reference Stinton and Evans2007) to give the actual specimen temperature, which was then used unchanged. The isotropic displacement parameters of all atoms were found to vary quadratically with temperature, and were so constrained to this in the refinement, with only the coefficients of the quadratic being refined. Refinement of anisotropic displacement parameters was attempted, but was not found to be supported by the data.
The atomic positions were refined as distortion modes of a parent
 $ Pm{\bar 3}m $
phase as given by the ISODISTORT suite (Campbell et al., Reference Campbell, Stokes, Tanner and Hatch2006). The Pnma supercell is related to its parent by the transformation matrix [[1 0 1], [0 2 0], [−1 0 1]], with its origin at (0, 0, 0). This structural transformation replaces the seven independent atomic position parameters of the Pnma space-group with seven distortion modes corresponding to two A-site cation displacements [R+
5 (A) and X+
5 (A)], two octahedral tilt/rotations about the b- and a-axes [M+
3 (O) and R+
4 (O)], and three octahedral distortions [M+
2 (O), R+
5 (O), and X+
5 (O)], where X+
5 (O) corresponds to a shear along the a-axis.
$ Pm{\bar 3}m $
phase as given by the ISODISTORT suite (Campbell et al., Reference Campbell, Stokes, Tanner and Hatch2006). The Pnma supercell is related to its parent by the transformation matrix [[1 0 1], [0 2 0], [−1 0 1]], with its origin at (0, 0, 0). This structural transformation replaces the seven independent atomic position parameters of the Pnma space-group with seven distortion modes corresponding to two A-site cation displacements [R+
5 (A) and X+
5 (A)], two octahedral tilt/rotations about the b- and a-axes [M+
3 (O) and R+
4 (O)], and three octahedral distortions [M+
2 (O), R+
5 (O), and X+
5 (O)], where X+
5 (O) corresponds to a shear along the a-axis.
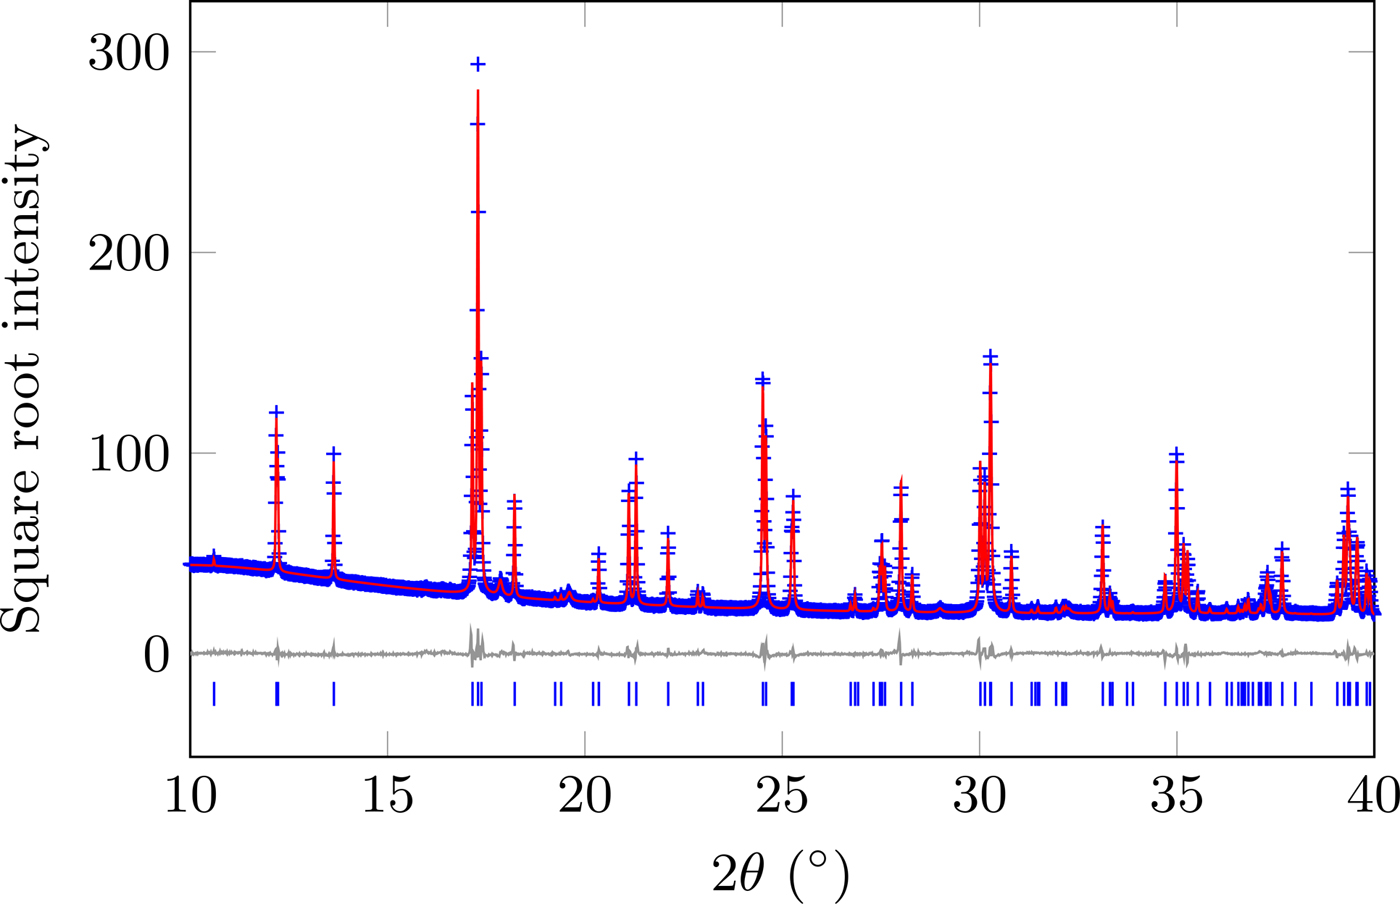
The diffraction pattern and resultant Rietveld model for the data at 295 K are shown in Figure 1, with the refined structure shown in Figure 2. A summary of the structural parameters is given in Table I, showing that this material is isostructural with GdFeO3 (Geller, Reference Geller1956). The supplemental information contains tables all of the structural data and the values in Figures 3–7. To account for the contribution of the impurity phase, it was modelled as a set of peaks constrained by cubic
 $ Pm{\bar 4}3n $
symmetry, with changes in peak positions, intensity, and width with changes in temperature accommodated by refining a cell parameter, scale factor, and crystallite size parameter. The relative peak intensities of the impurity phase were fixed from refinement of the room-temperature model.
$ Pm{\bar 4}3n $
symmetry, with changes in peak positions, intensity, and width with changes in temperature accommodated by refining a cell parameter, scale factor, and crystallite size parameter. The relative peak intensities of the impurity phase were fixed from refinement of the room-temperature model.

Figure 1. (Colour online) Diffraction data and Rietveld model of SmCoO3 at 295 K. Data were collected over the range 3–83°2θ.

Figure 2. (Colour online) The structure of SmCoO3 at 295 K. The images clearly show the tilt and rotation of the CoO6 corner-sharing octahedra, as well as the offset of the Sm atoms from the face of the unit cell. Distortion of the octahedra is minimal.

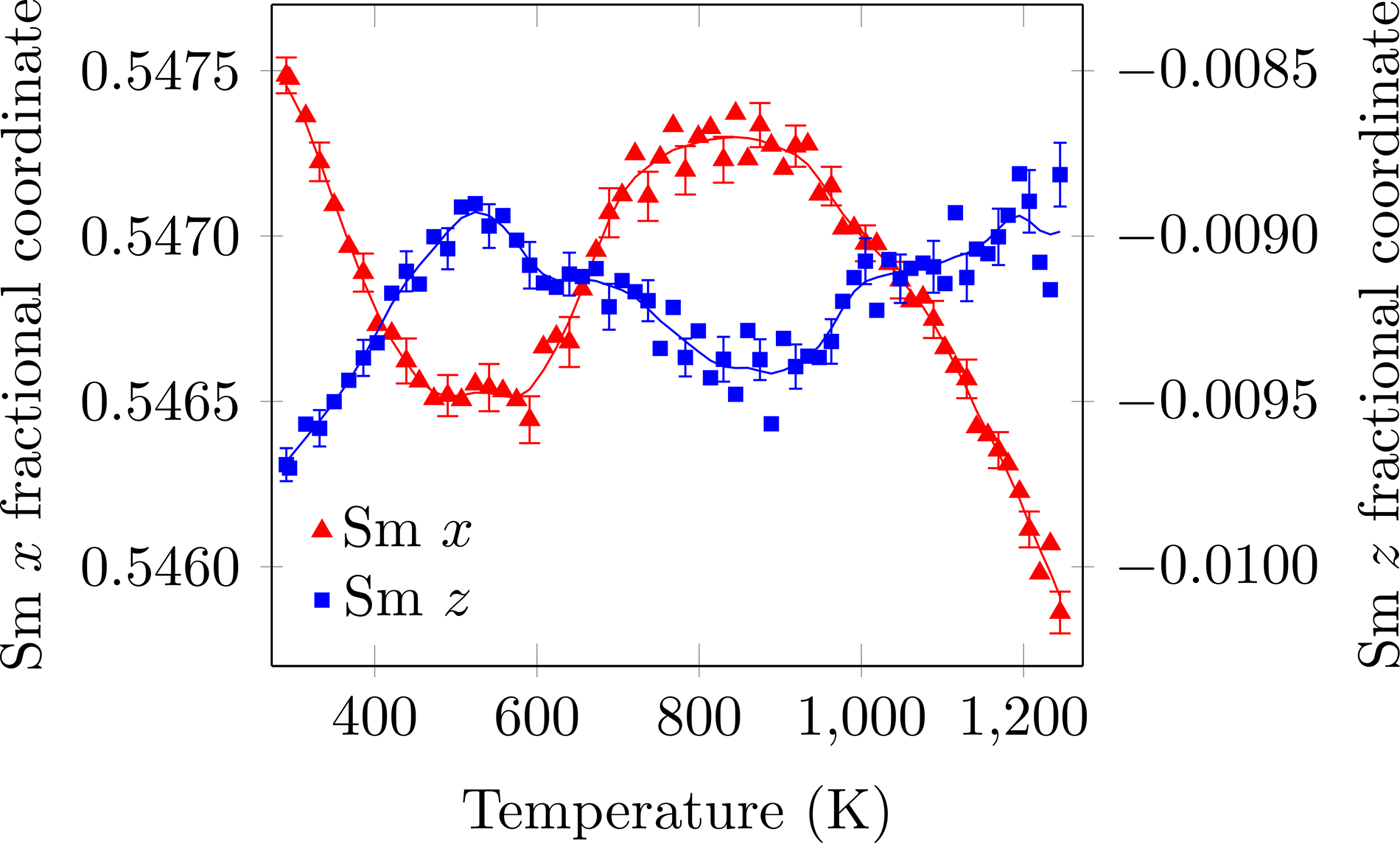
Figure 3. (Colour online) Sm fractional x- and z-coordinates as a function of temperature. The R+ 5 and X+ 5 distortions correspond to translations of the Sm atom in the z- and x-directions, respectively. The solid line is the denoised data. Error bars are given for every third data point and represent one estimated standard deviation.
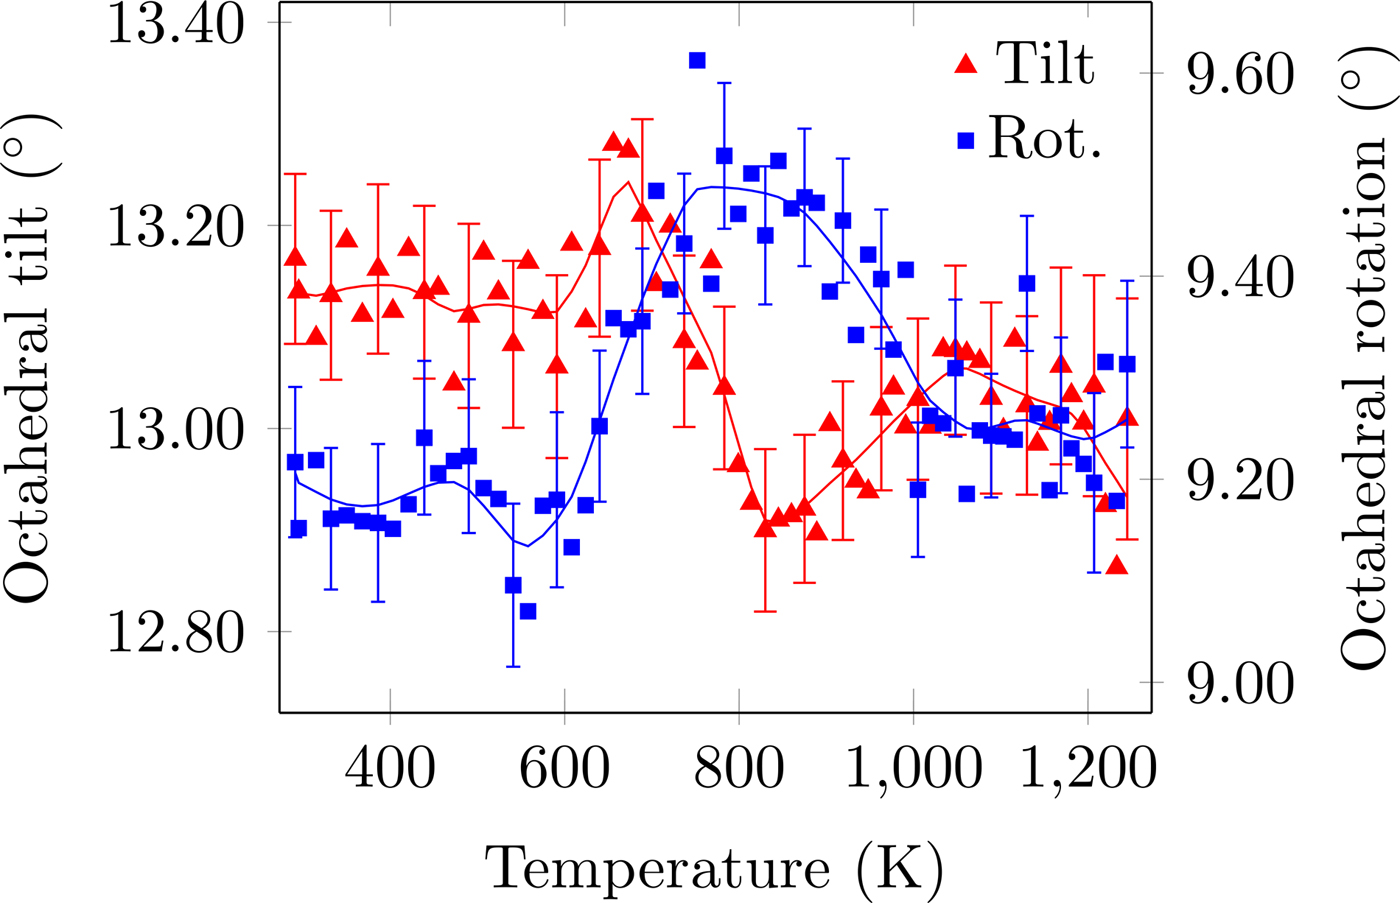
Figure 4. (Colour online) CoO6 octahedral tilt and rotation distortion as a function of temperature. The solid line is the denoised data. Error bars are given for every third data point and represent one estimated standard deviation.

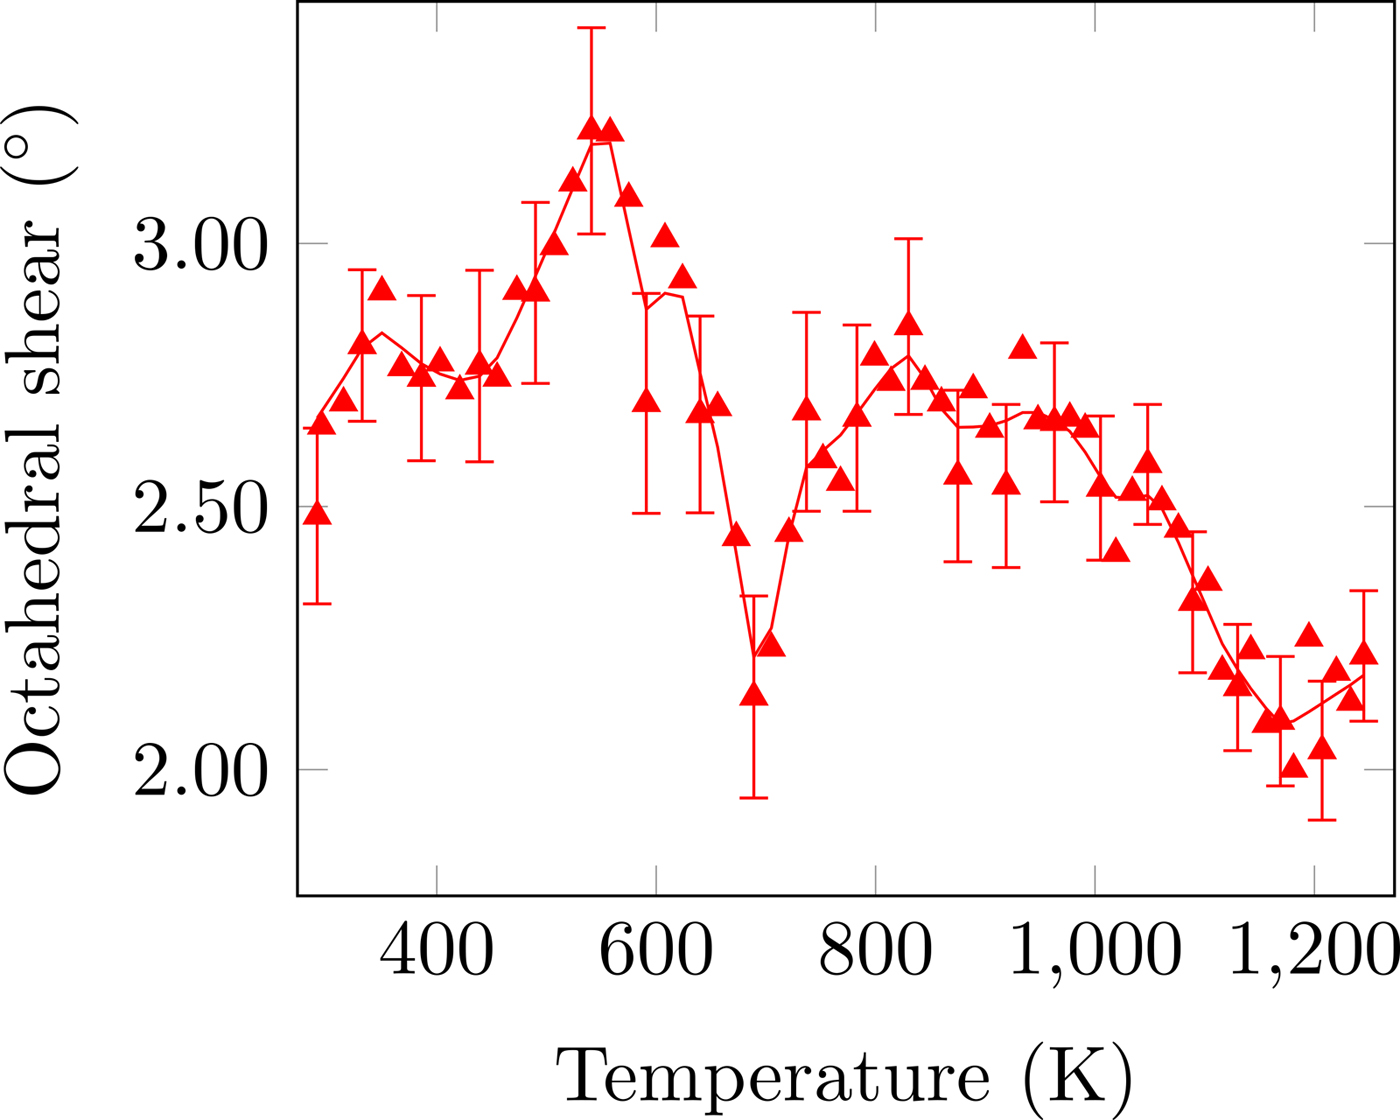
Figure 5. (Colour online) CoO6 octahedral shear distortion as a function of temperature. The solid line is the denoised data. Error bars are given for every third data point and represent one estimated standard deviation.

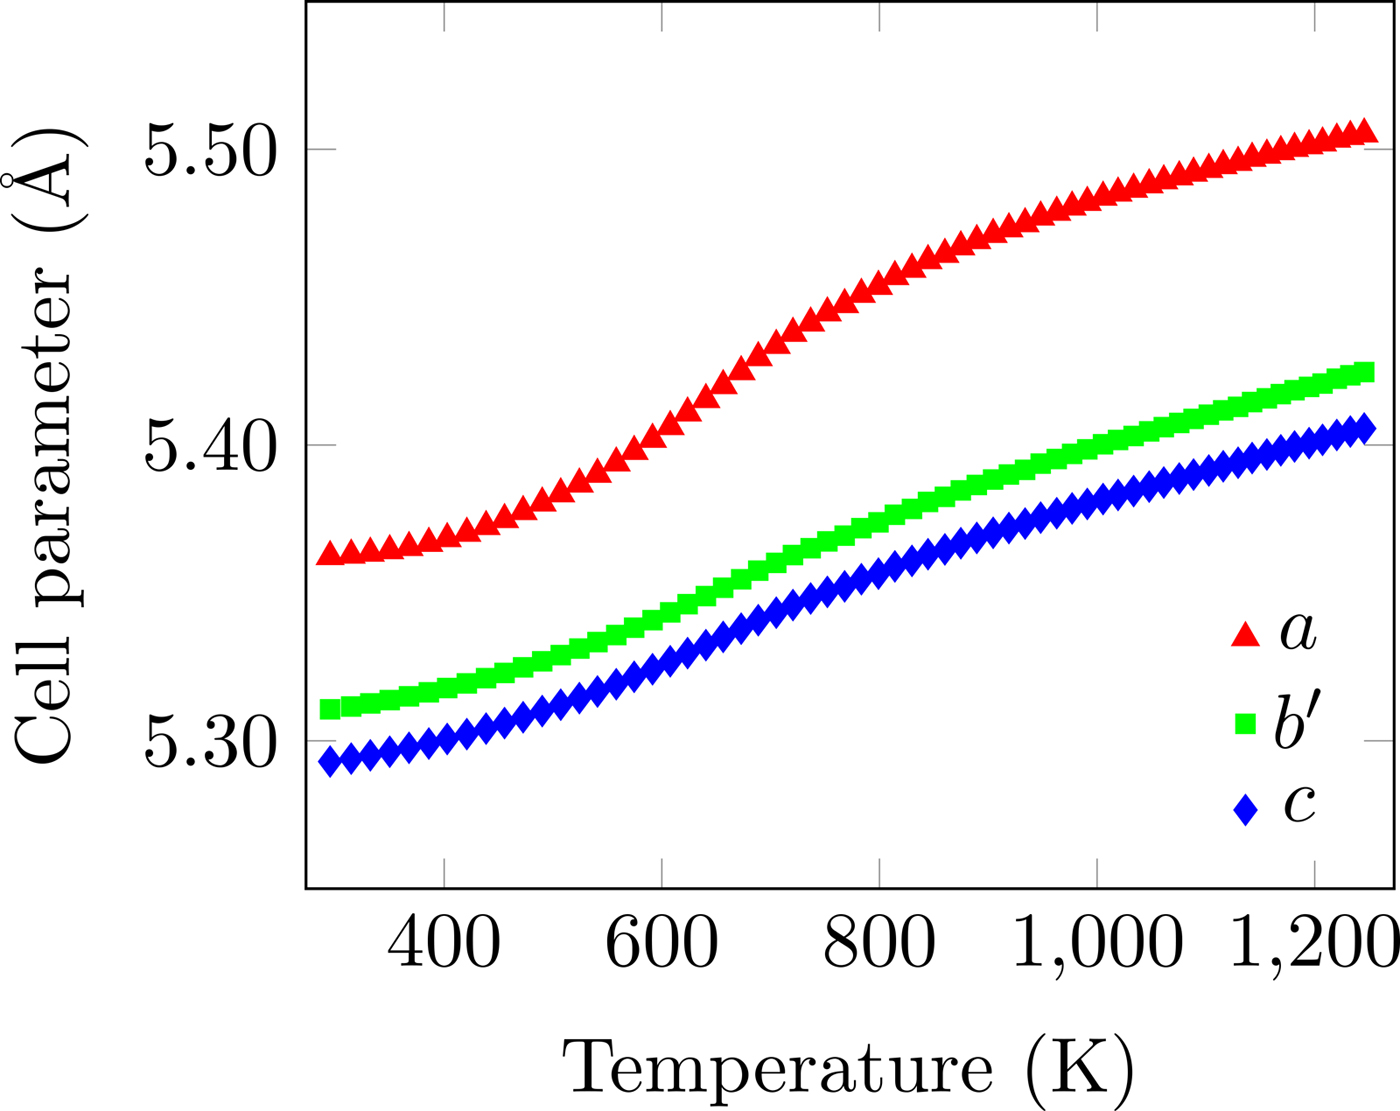
Figure 6. (Colour online) Unit-cell parameters as a function of temperature. The non-linear expansion behaviour of all three axes is clear. The error bars are smaller than the data points. b′ = b/√2.

Figure 7. (Colour online) Instantaneous (I) and average (A) linear thermal expansion coefficients (TECs) for the three cell parameters showing the expansion anisotropy. The open circles are bulk TECs calculated from the results of Tu et al. (Reference Tu, Takeda, Imanishi and Yamamoto1997). The point of maximum orthorhombic distortion occurs at the high-temperature crossover of the instantaneous coefficients at ~1000 K.
TABLE I. Crystal data for SmCoO3 at selected temperatures. Space-group Pnma, Z = 4. Molar mass = 257:29 g mol−1. By space-group symmetry, Sm y & O2 y = ¼, and Co x; y; z = 0; 0; 0. The structure data for the remaining temperatures are available in the supplemental information.
The orthorhombic symmetry of this perovskite can be explained as a distortion from the parent cubic perovskite phase (a p ≈ 3.76 Å) with tilts, rotations, and shears in the CoO6 octahedra and translations of the Sm atom (Glazer, Reference Glazer1975). The orthorhombic lattice parameters are given by a ≈ c ≈ (√2)a p and b ≈ 2a p. No evidence was found for site occupancies of less than 100%, with all changes in intensity and peak position able to be described by changes in atom positions, unit-cell parameters, and isotropic displacement parameters. There was no evidence of preferred orientation.
The temperature dependence of the distortion modes, as it influenced the Sm position and CoO6 octahedral tilt, rotation, and shear are given in Figures 3–5. The data were denoised by numerical differentiation and antidifferentiation (Chartrand, Reference Chartrand2011), with α = 0.01 for the translations and 0.05 for the octahedral distortions. Both the A-site translational distortions, R+ 5 (A) and X+ 5 (A), were found to be significant. Only the octahedral M+ 3 (O), R+ 4 (O), and X+ 5 (O) distortions were found to be significant, with the negligible M+ 2 (O) and R+ 5 (O) distortions fixed at zero. The R+ 4 (O) distortion is a tilting of the CoO6 octahedra about the a-direction, and the M+ 3 (O) distortion is a rotation of the octahedra about the b-direction. The X+ 5 (O) distortion is a shearing of the apical oxygen of the CoO6 octahedra in the a-direction. The distortion magnitudes were converted to fractional coordinates and tilt/rotation/shear angles by the following formulae:
 $${\rm Sm}\;x = \displaystyle{1 \over 2} + 0.093\,99X_5^ +, $$
 $${\rm Sm}\;z = 0.093\,99R_5^ +, $$
 $${\rm Oct}{\rm. rot}{\rm.} = {\rm arctan}\left[ {\displaystyle{{0.066\,46R_4^ + c} \over {(1/4)b}}} \right],$$
 $${\rm Oct}{\rm. tilt} = \arctan \left[ {\displaystyle{{a( - [1/4] - 0.046\,99M_3^ + )} \over {c([1/4] - 0.046\,99M_3^ + )}}} \right],$$
 $${\rm Oct}{\rm. shear} = \arctan \left[ {\displaystyle{{0.093\,99X_5^ + a} \over {(1/4)b}}} \right],$$
where the decimal values were given by the output of the ISODISTORT suite (Campbell et al., Reference Campbell, Stokes, Tanner and Hatch2006).
The A-site translational distortions are anticorrelated, with the Sm atom moving diagonally in the xz-plane with changes in temperature. The octahedral tilt and rotation also tend to occur in opposite directions; as the tilt increases, the rotation decreases. The octahedral shear appears to follow the same behaviour as the octahedral tilt, but leading those changes by about 140 K.
The temperature dependence of the unit-cell parameters is shown in Figure 6. Both the instantaneous and average linear TECs are shown in Figure 7, clearly showing both their non-linearity and anisotropy. The instantaneous and average TECs were calculated as
 $${\rm TEC}_{{\rm inst}{\rm.}} = \displaystyle{1 \over l}\displaystyle{{{\rm d}l} \over {{\rm d}T}},$$
 $${\rm TEC}_{{\rm ave}} = \displaystyle{1 \over {l_0}} \displaystyle{{\Delta l} \over {\Delta T}},$$
where l and l 0 are the current and initial cell parameters, respectively, and Δ represents the difference between the current value of the cell parameter or temperature and its initial value. The derivative was calculated numerically (Chartrand, Reference Chartrand2011). The bulk TECs calculated from the data of Tu et al. (Reference Tu, Takeda, Imanishi and Yamamoto1997) are also given for the comparison. The maximum instantaneous and average TECs are given in Table II.
TABLE II. Maximum instantaneous and average thermal expansion coefficients (TECs) and their respective temperatures and crystallographic direction. The uncertainties incorporate a coverage factor of 2 and the uncertainties were estimated from the magnitudes of the average uncertainties.
Overall, the unit cell expands much more in the a-direction than the b- and c-directions, where the expansion is essentially equal. The peak average TEC in the a-direction occurs at approximately 800 K, which is well within the operating range of intermediate-temperature solid-oxide fuel cells (Brett et al., Reference Brett, Atkinson, Brandon and Skinner2008), and is much greater than any of the values given by (Sun et al., Reference Sun, Hui and Roller2009). Above this temperature, the thermal expansion is still non-linear, but to a greatly reduced degree. Comparison of the average TECs with the bulk TECs of Tu et al. (Reference Tu, Takeda, Imanishi and Yamamoto1997) shows that a simple average of the TECs of the three crystallographic directions can explain the bulk measurements.
The large anisotropy and non-linearity in the TECs below 900 K has implications for the structural integrity of polycrystalline monoliths and for joints between different solid-oxide fuel cell components, as repeated temperature cycling may induce cracking and delamination. The point of greatest orthorhombic distortion occurs at ~1000 K, where the instantaneous TECs crossover. The maximum of the instantaneous TEC for all three axes occurs at ~640 K, showing that the gross relative changes in the average TEC for all three axes are the same.
IV. CONCLUSIONS
The crystal structure and thermal expansion of the perovskite SmCoO3 have been determined over the temperature range 295–1245 K. The structure was found to be orthorhombic (Pnma) and isostructural with GdFeO3 over the entire temperature range. The thermal expansion is both non-linear and anisotropic with a maximum average linear TEC of 34.0(3) × 10−6, 24.05(17) × 10−6, and 24.10(18) × 10−6 K−1 along the a-, b-, and c-axes, respectively, between 814 and 875 K. Structural information is available in the supplemental information and select temperatures have been uploaded to the Crystallography Online Database.
SUPPLEMENTARY MATERIAL
The supplementary material for this article can be found at https://doi.org/10.1017/S0885715617000872.
ACKNOWLEDGEMENTS
This research was undertaken on the Powder Diffraction beamline at the Australian Synchrotron, Victoria, Australia.