I. INTRODUCTION
Ivermectin (a type of avermectin; brand names Ivomec, Mectizan, Noromectin, Equivalan, and Stromectol) is a macrocyclic lactone derived from Streptomyces avermitilis with antiparasitic activity. It is used to treat head lice, scabies, river blindness, and other parasitic infections. Recently Ivermectin has been reviewed for application as a potential antiviral drug (Heidary and Gharebaghi, Reference Heidary and Gharebaghi2020). It is on the World Health Organization's List of Essential Medicines, which includes the most effective and safe medicines needed in a health system. It consists of not less than 80% of component B1a and not more than 20% of component B1b (Figure 1). In component B1a, R = ethyl, and in component B1b, R = methyl. In this study, the molecule is assumed to be component B1a, as the smaller methyl group should fit into the crystallographic position of an ethyl group. The IUPAC name (CAS Registry number 70288-86-7) is (1R,4S,5′S,6R,6′R,8R,10E,12S,13S,14E,16E,20R,21R,24S)-6′-[(2S)-butan-2-yl]-21,24 -dihydroxy-12-[(2R,4S,5S,6S)-5-[(2S,4S,5S,6S)-5-hydroxy-4-methoxy-6-methyloxan-2 -yl]oxy-4-methoxy-6-methyloxan-2-yl]oxy-5′,11,13,22-tetramethylspiro[3,7,19-trioxatetracyclo[15.6.1.14,8.020,24]pentacosa-10,14,16,22-tetraene-6,2′-oxane]-2-one. The asymmetric unit of this structure is illustrated in Figure 2.
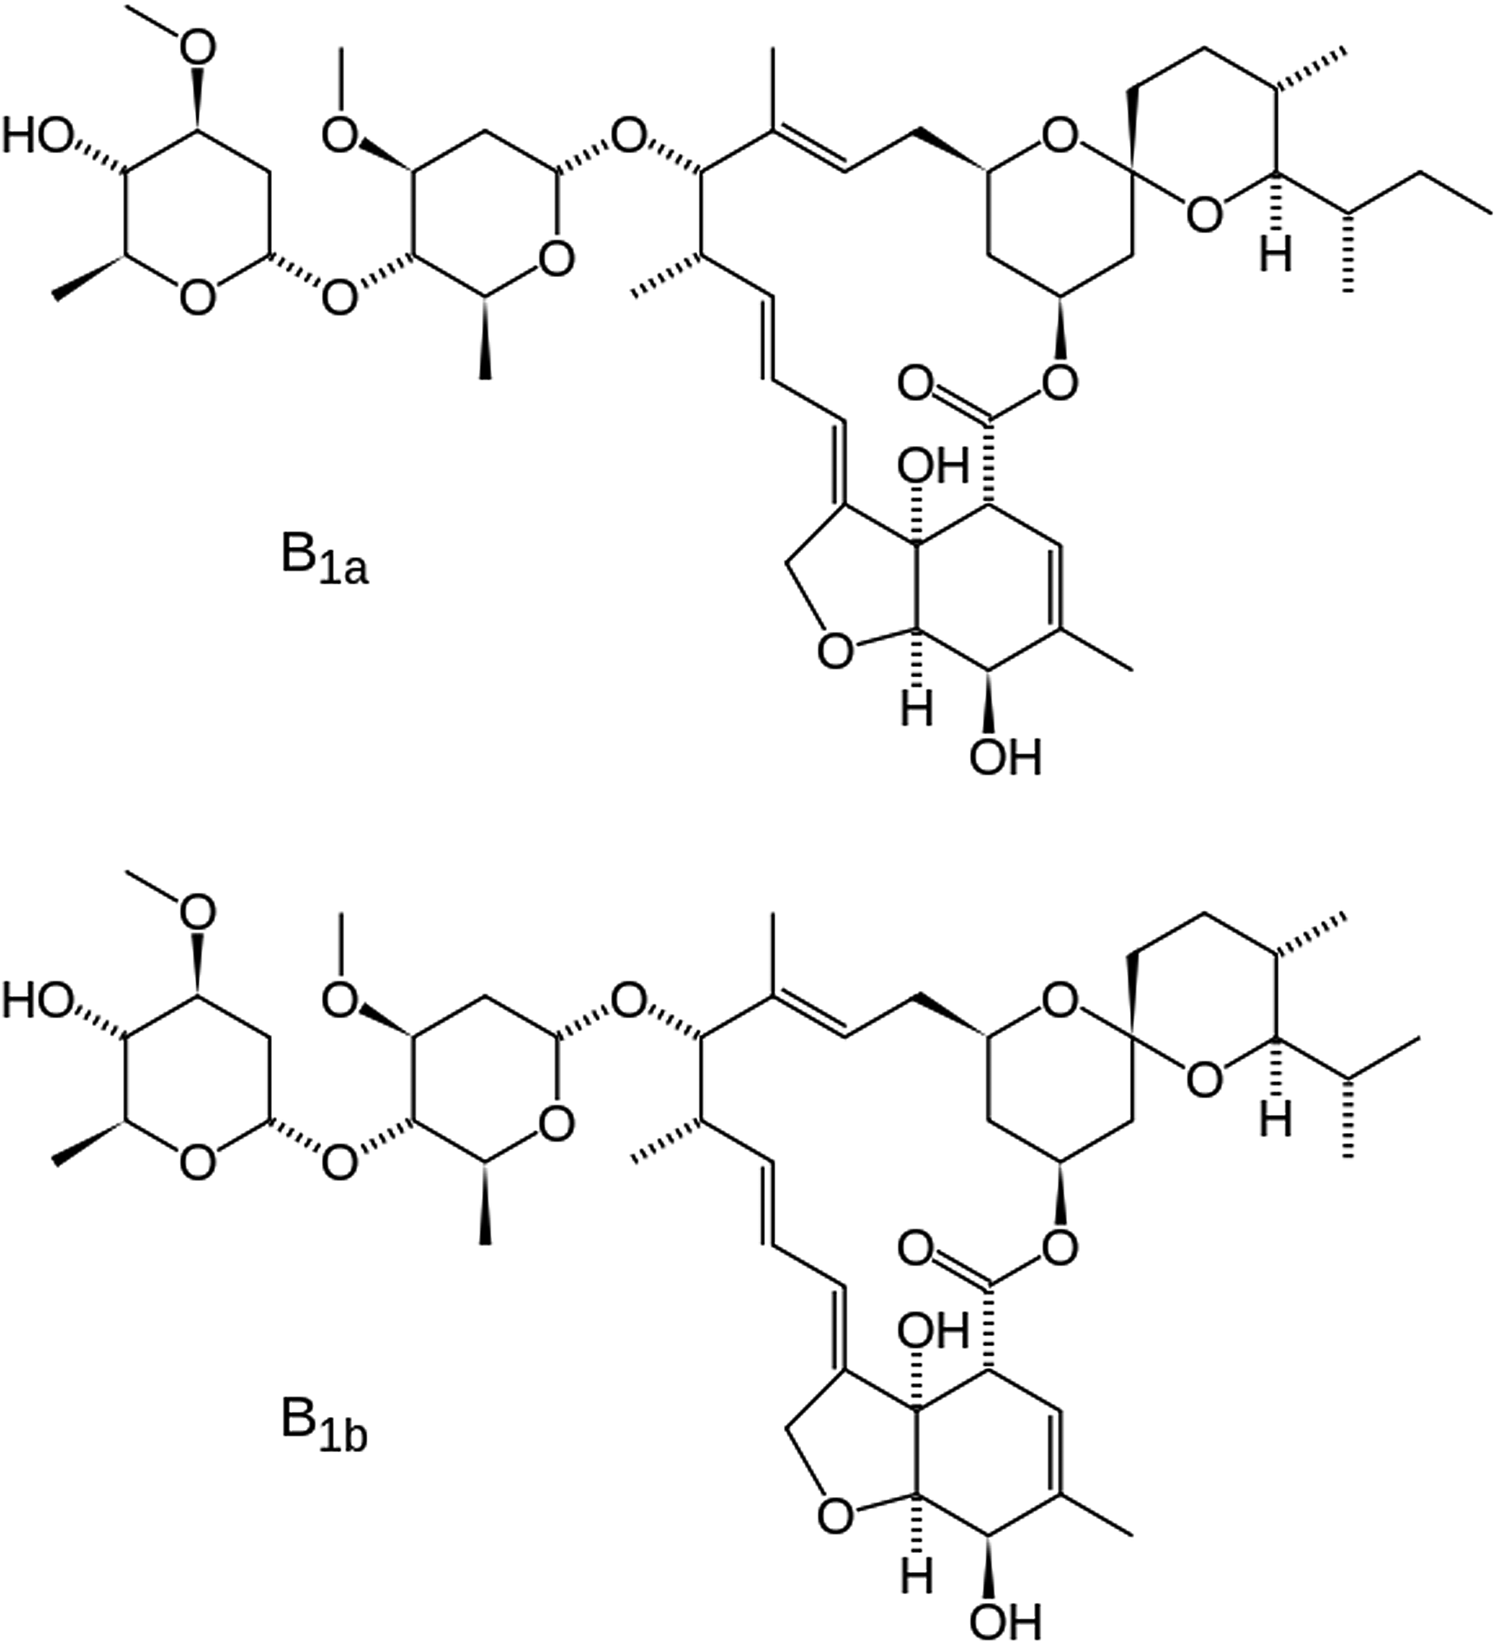
Figure 1. The molecular structures of forms B1a and B1b of ivermectin. The difference is an extra methyl group (C39 in our numbering) in form B1a.
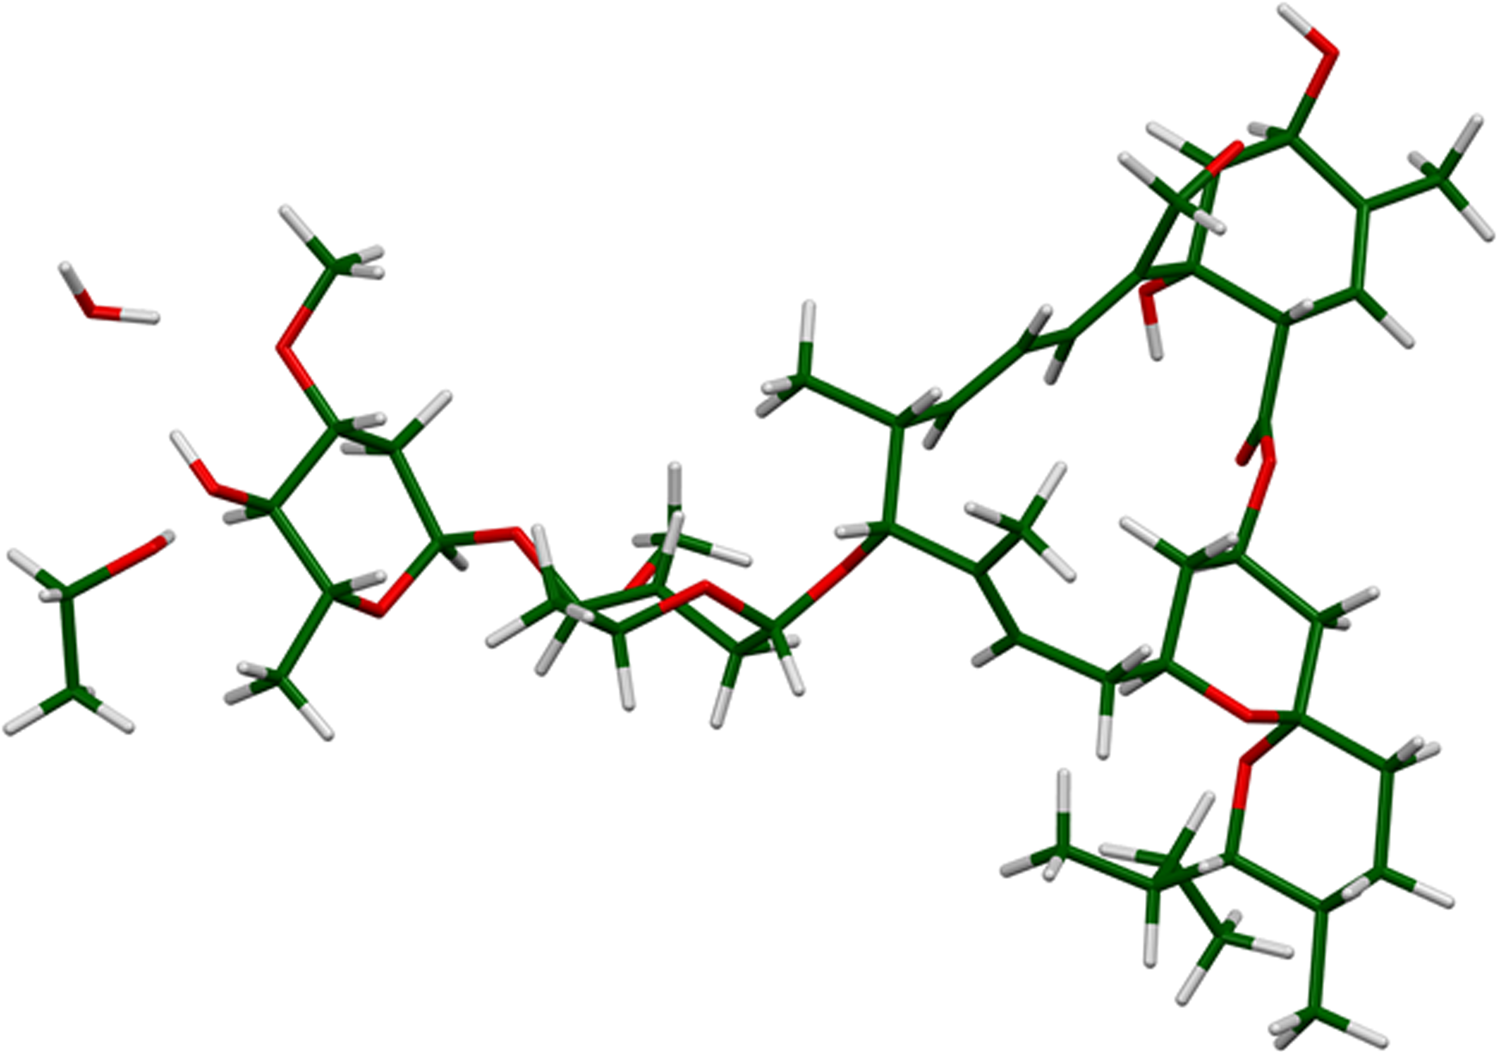
Figure 2. The asymmetric unit of ivermectin hemihydrate ethanolate.
A powder pattern of ivermectin is reported in Rolim et al. (Reference Rolim, do Santos, Chaves, Goncalves, Freitas-Neto, do Nascimento, Soares-Sobrinho, de Albuquerque, de Lima and Rolim-Neto2014). Several apparent polymorphs of ivermectin have been characterized by X-ray powder diffraction and other analytical techniques, as reported in Grobler (Reference Grobler2016).
This work was carried out as part of a project (Kaduk et al., Reference Kaduk, Crowder, Zhong, Fawcett and Suchomel2014) to determine the crystal structures of large-volume commercial pharmaceuticals and include high-quality powder diffraction data for these pharmaceuticals in the Powder Diffraction File (Gates-Rector and Blanton, Reference Gates-Rector and Blanton2019).
II. EXPERIMENTAL
The sample was a commercial reagent, purchased from United States Pharmacopeial Convention (USP) (Lot #R091C0), and was used as-received. The white powder was packed into a 1.5 mm diameter Kapton capillary and rotated during the measurement at ~50 Hz. The powder pattern was measured at 295 K at beamline 11-BM (Lee et al., Reference Lee, Shu, Ramanathan, Preissner, Wang, Beno, Von Dreele, Ribaud, Kurtz, Antao, Jiao and Toby2008; Wang et al., Reference Wang, Toby, Lee, Ribaud, Antao, Kurtz, Ramanathan, Von Dreele and Beno2008) of the Advanced Photon Source at Argonne National Laboratory using a wavelength of 0.412826 Å from 0.5° to 50° 2θ with a step size of 0.001° and a counting time of 0.1 s per step.
The pattern was indexed on a monoclinic unit cell with a = 14.9487, b = 9.2704, c = 39.2623 Å, β = 94.379°, and V = 5425.08 Å3 using DICVOL14 (Louër and Boultif, Reference Louër and Boultif2014). Analysis of the systematic absences using EXPO2014 (Altomare et al., Reference Altomare, Cuocci, Giacovazzo, Moliterni, Rizzi, Corriero and Falcicchio2013) suggested the space group I2. A reduced cell search in the Cambridge Structural Database (Groom et al., Reference Groom, Bruno, Lightfoot and Ward2016) yielded three hits, including Refcode BIFYOF (Seppala et al., Reference Seppala, Kolehmainen, Osmialowski and Gawinecki2014), ivermectin acetone chloroform solvate, C48H74O14(C3H6O)0.5(CHCl3).
Refinement was carried out using GSAS-II (Toby and Von Dreele, Reference Toby and Von Dreele2013). Only the 1.0–20.0° portion of the pattern was included in the refinement (d min = 1.189 Å). An initial refinement using the BIFYOF model did not fit the intensities particularly well, so the solvent molecules were removed from the model. A difference Fourier calculation yielded a peak at ½, −0.1619,0, which was attributed to O147, the oxygen atom of a water molecule on a twofold axis.
Analysis of voids using Mercury (Macrae et al., Reference Macrae, Sovago, Cottrell, Galek, McCabe, Pidcock, Platings, Shields, Stevens, Towler and Wood2020) indicated the presence of a significant void, which was presumably occupied by some other solvated species.
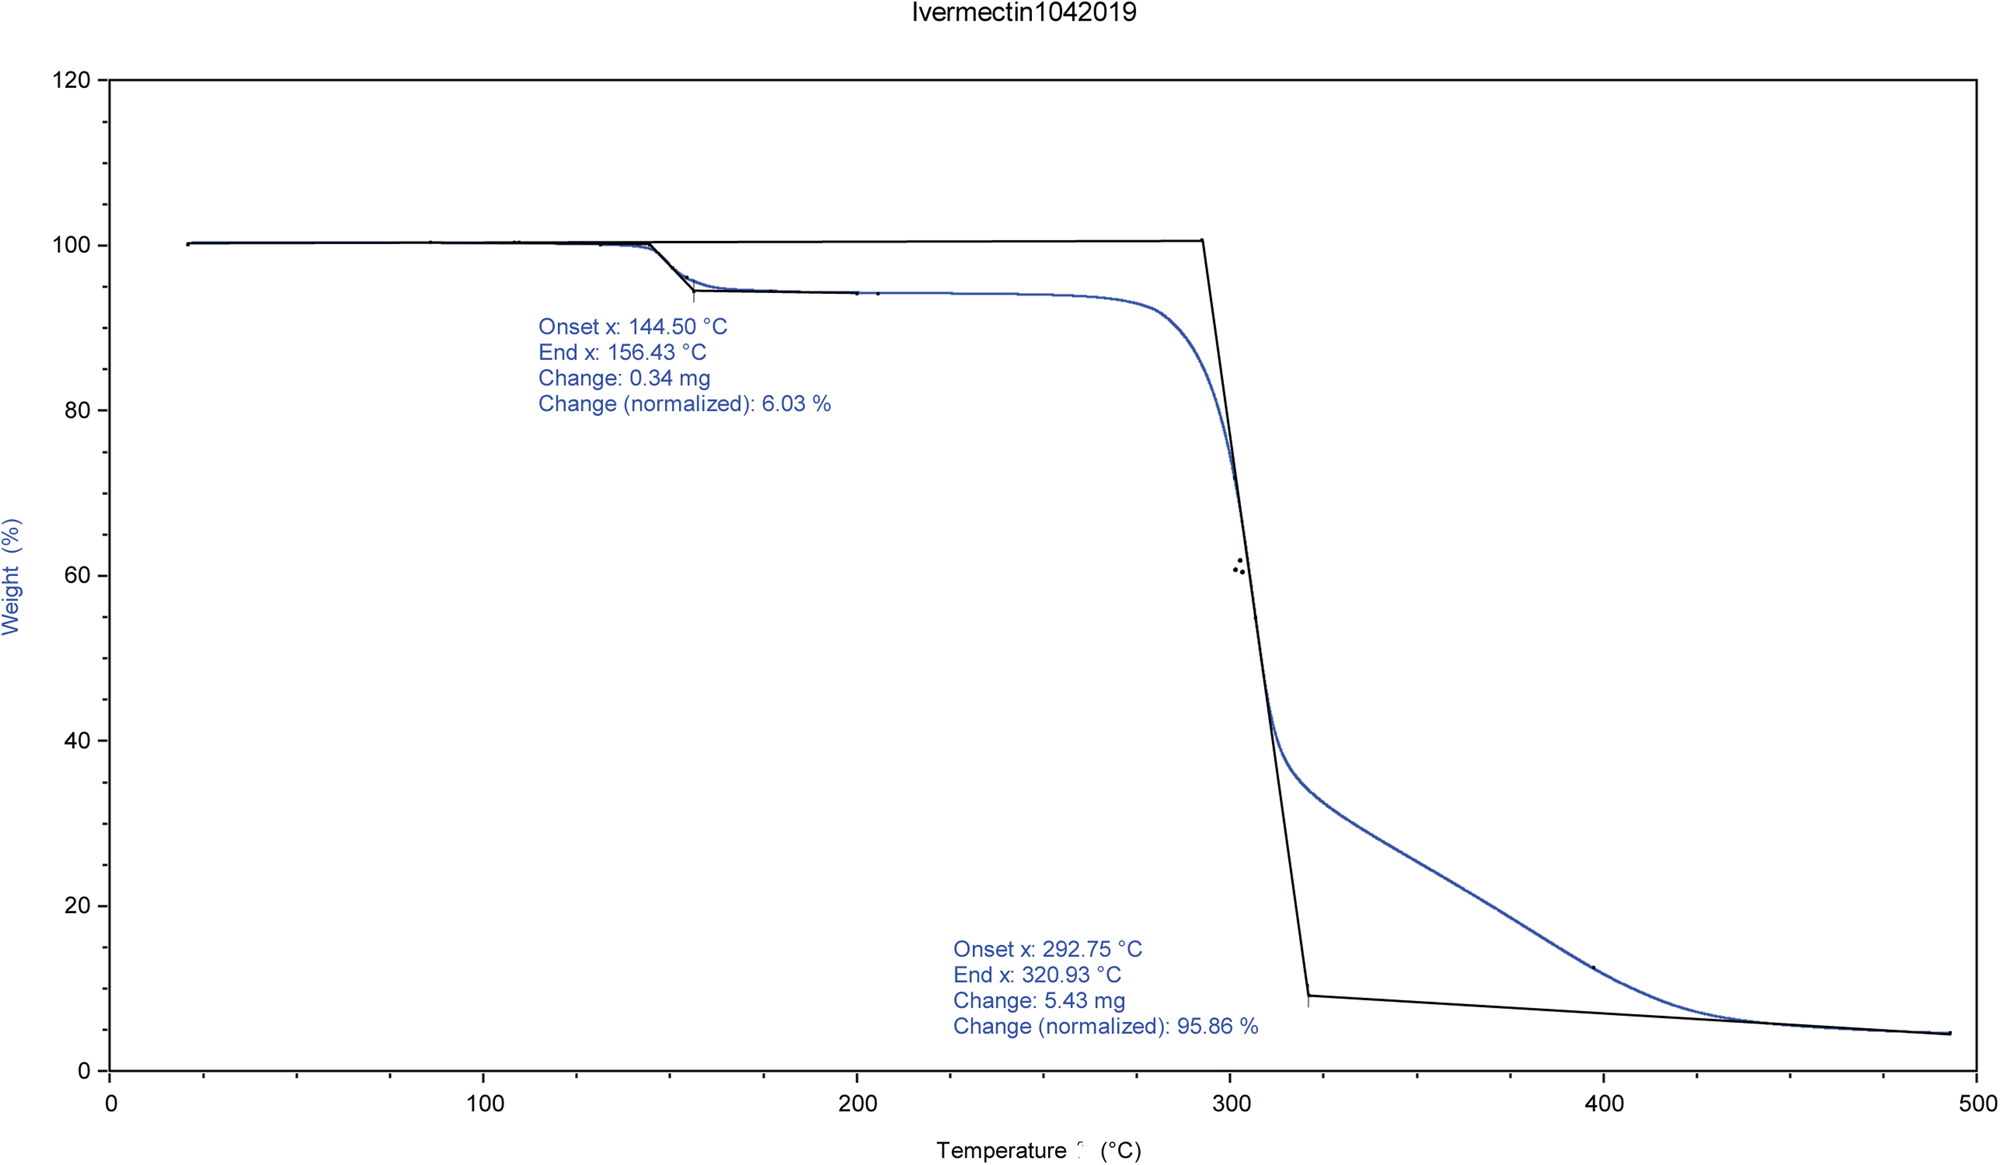
The identity and amount of the solvated species occupying the void were shown to be ethanol using TGA and NMR spectroscopy. NMR spectroscopy was performed on a 400 MHz Bruker Avance Spectrometer equipped with a multi-nuclear probe. As shown in Figure 3, the NMR spectrum of the ivermectin sample in d6-DMSO (10 mg in 0.5 ml of deutero solvent) indicates the presence of the methylene protons of ethanol at 3.34 ppm and the methyl protons of ethanol at 1.06 ppm. In both of these cases, the signals of the ethanol solvate are partially obscured by resonances from the pharmaceutical. Two-dimensional COSY NMR (1H-1H) of this sample indicate that the two putative ethanol signals are spin-correlated (Supplementary Figure S1). The addition of a small amount of pure ethanol led to an increase in intensity of both the methylene and methyl signals attributed to an ethanol solvate (Supplementary Figure S2). The 13C NMR spectrum (Figure 4) of the ivermectin sample also indicated the presence of ethanol with the methyl and methylene group of this species exhibiting resonances at 57.12 and 19.05 ppm, respectively. The shifts in both the carbon and proton NMR spectra are consistent with literature values of ethanol in d6DMSO (Gottlieb et al., Reference Gottlieb, Kotlyar and Nudelman1997). Moreover, an HSQC NMR spectrum indicates that the 1H and 13C NMR signals proposed to arise from ethanol are correlated (Supplementary Figure S3). The TGA analysis indicates a 6.03% weight loss from 144 to 156°C (Figure 5). The refined water/ethanol content corresponds to 5.07%. Since a real sample will contain some additional adsorbed surface species, the agreement is reasonable.
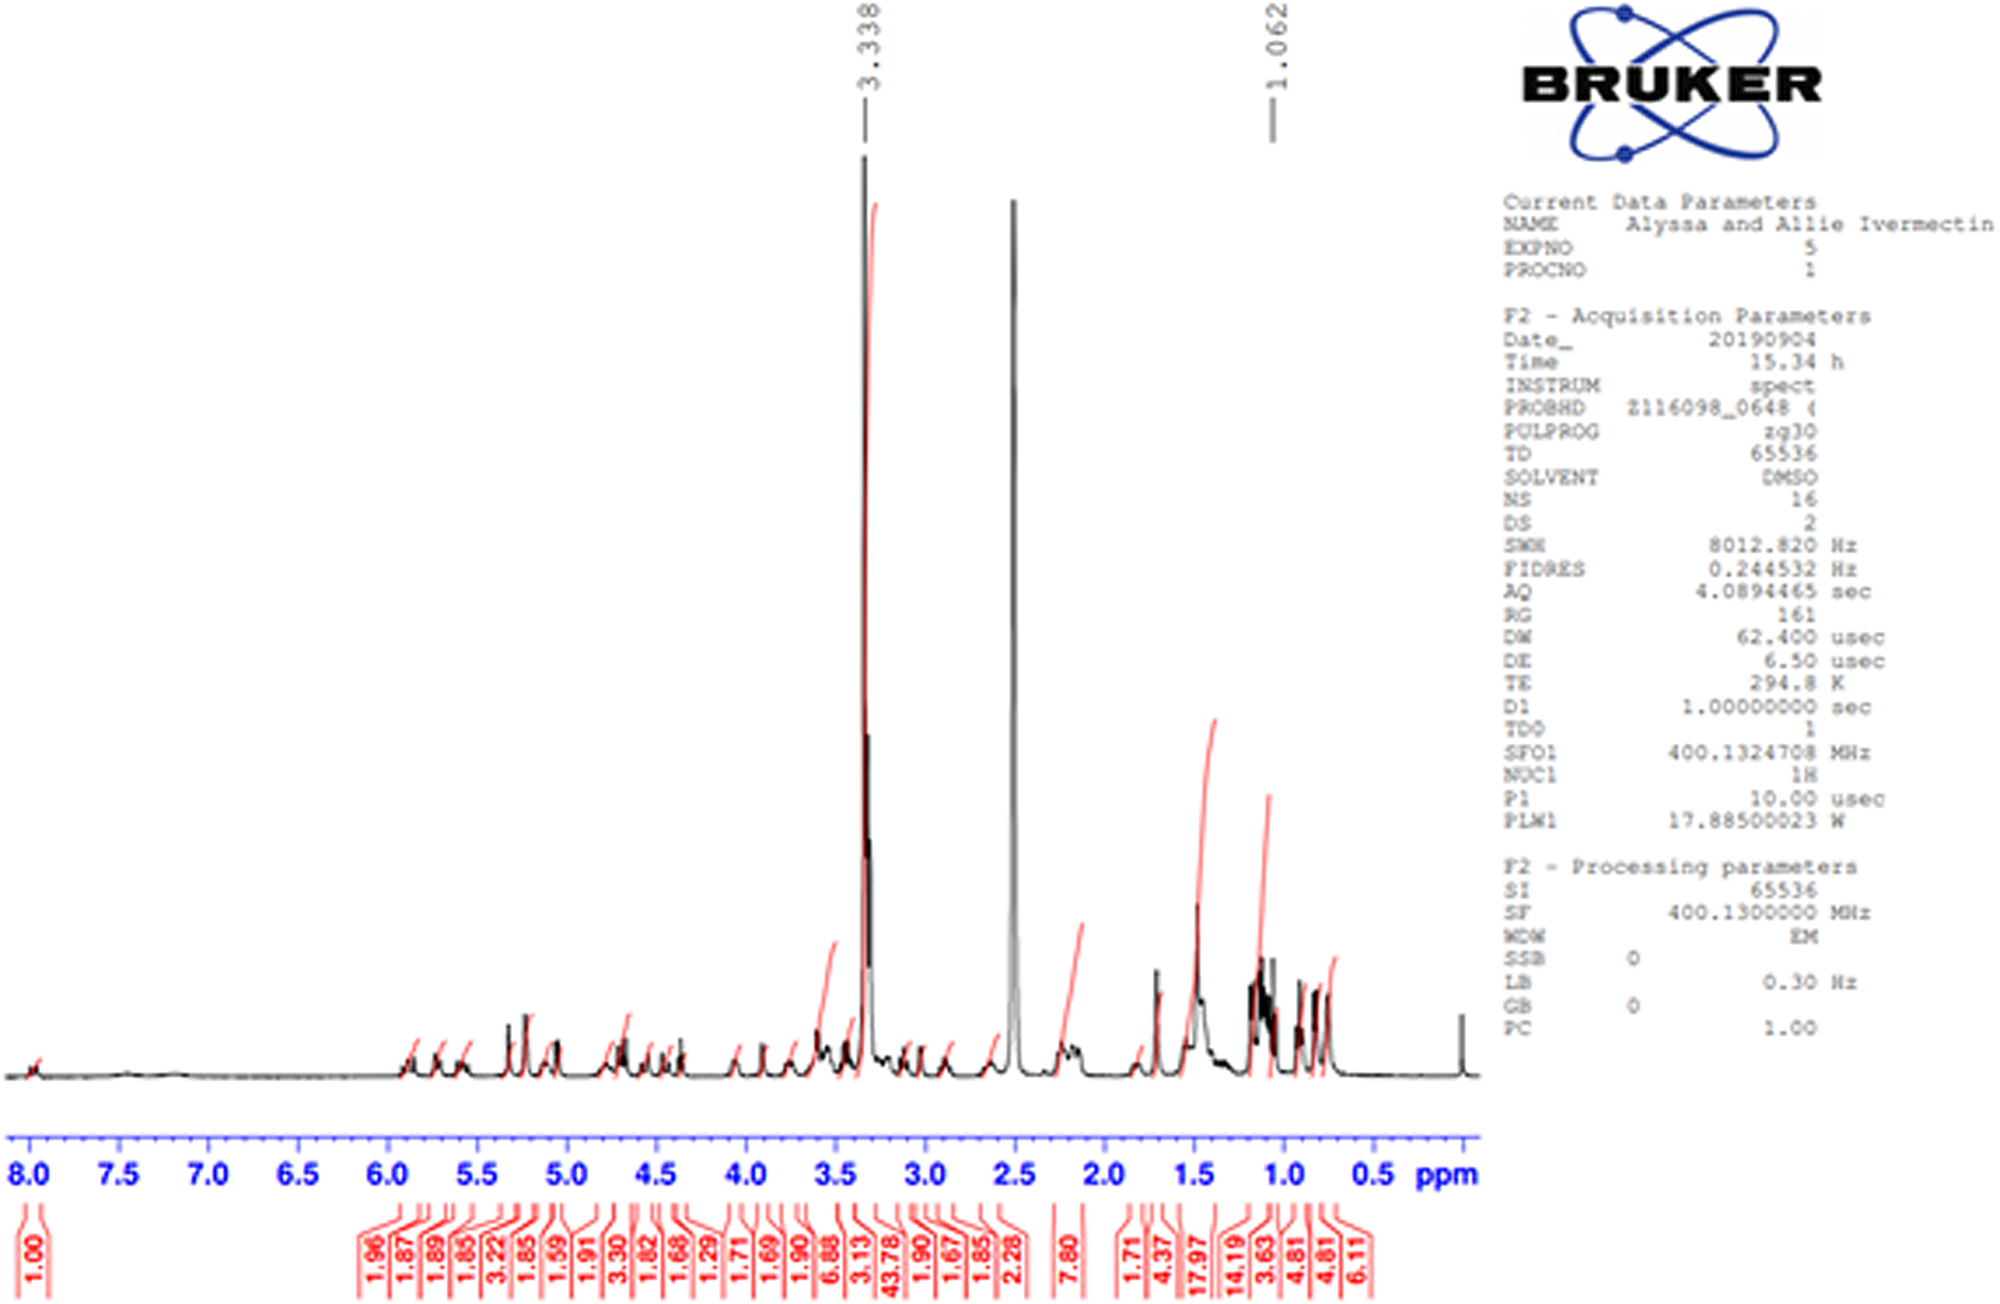
Figure 3. Proton NMR spectrum of ivermectin in d6DMSO. Two signals from ethanol are found at 1.06 and 3.34 ppm. Note that the signal for the methylene at 3.34 ppm is overlapping with residual water and the methyl group at 1.06 ppm is overlapping with the pharmaceutical.

Figure 4. 13C NMR spectrum of ivermectin in deuterated DMSO. The methyl and methylene group from ethanol gives rise to signals at 57.12 and 19.05 ppm, respectively.

Figure 5. TGA analysis of ivermectin.
An ethanol molecule was inserted into the void using Materials Studio (Dassault, 2019), and the structure was optimized using the Forcite module. Refinement was re-started from this model. The y-coordinate of C2 was fixed to define the origin. All non-H bond distances and angles were subjected to restraints, based on a Mercury/Mogul Geometry Check (Bruno et al., Reference Bruno, Cole, Kessler, Luo, Motherwell, Purkis, Smith, Taylor, Cooper, Harris and Orpen2004; Sykes et al., Reference Sykes, McCabe, Allen, Battle, Bruno and Wood2011) of the molecule. The results were exported to a .csv file. The Mogul average and standard deviation for each quantity were used as the restraint parameters, and were incorporated using the new feature Restraints/Edit Restraints/Add MOGUL Restraints, which reads the bond distance and angle restraints from the .csv file. The restraints contributed 11.2% to the final χ 2. The hydrogen atoms were included in calculated positions, which were recalculated during the refinement using Materials Studio (Dassault, 2019). Positions of the active hydrogens were derived by analysis of potential hydrogen bonding patterns. We did not attempt to refine the displacement coefficients in this very large structure. The U iso of the heavy atoms were fixed at 0.05 Å2, and those of the H atoms at 0.065 Å2. It proved impossible to refine the generalize microstrain model and the atoms coordinates simultaneously, so the profile terms were fixed in the final refinement. The background was modeled using a 3-term shifted Chebyshev polynomial and a 6-term diffuse scattering function, to describe the Kapton capillary and any amorphous component.
The model was converted from I2 to C2, because VASP is not able to work with I2. The final refinement (started from the result of the DFT calculation) of 204 variables using 19 031 observations and 173 restraints yielded the residuals R wp = 0.1595 and GOF = 2.59. The largest peak (1.28 Å from C49) and hole (3.95 Å from C1) in the difference Fourier map were 0.40 and −0.40(10) eÅ−3, respectively. The Rietveld plot is included as Figure 6. The largest errors in the fit are in the shapes and positions of some of the strong peaks, and may indicate subtle changes in the beam during the measurement. A Le Bail fit of the data yielded R wp = 0.1208 and GOF = 1.95; the errors in the fit persist even in the absence of a structure model, indicating that the changes are real.
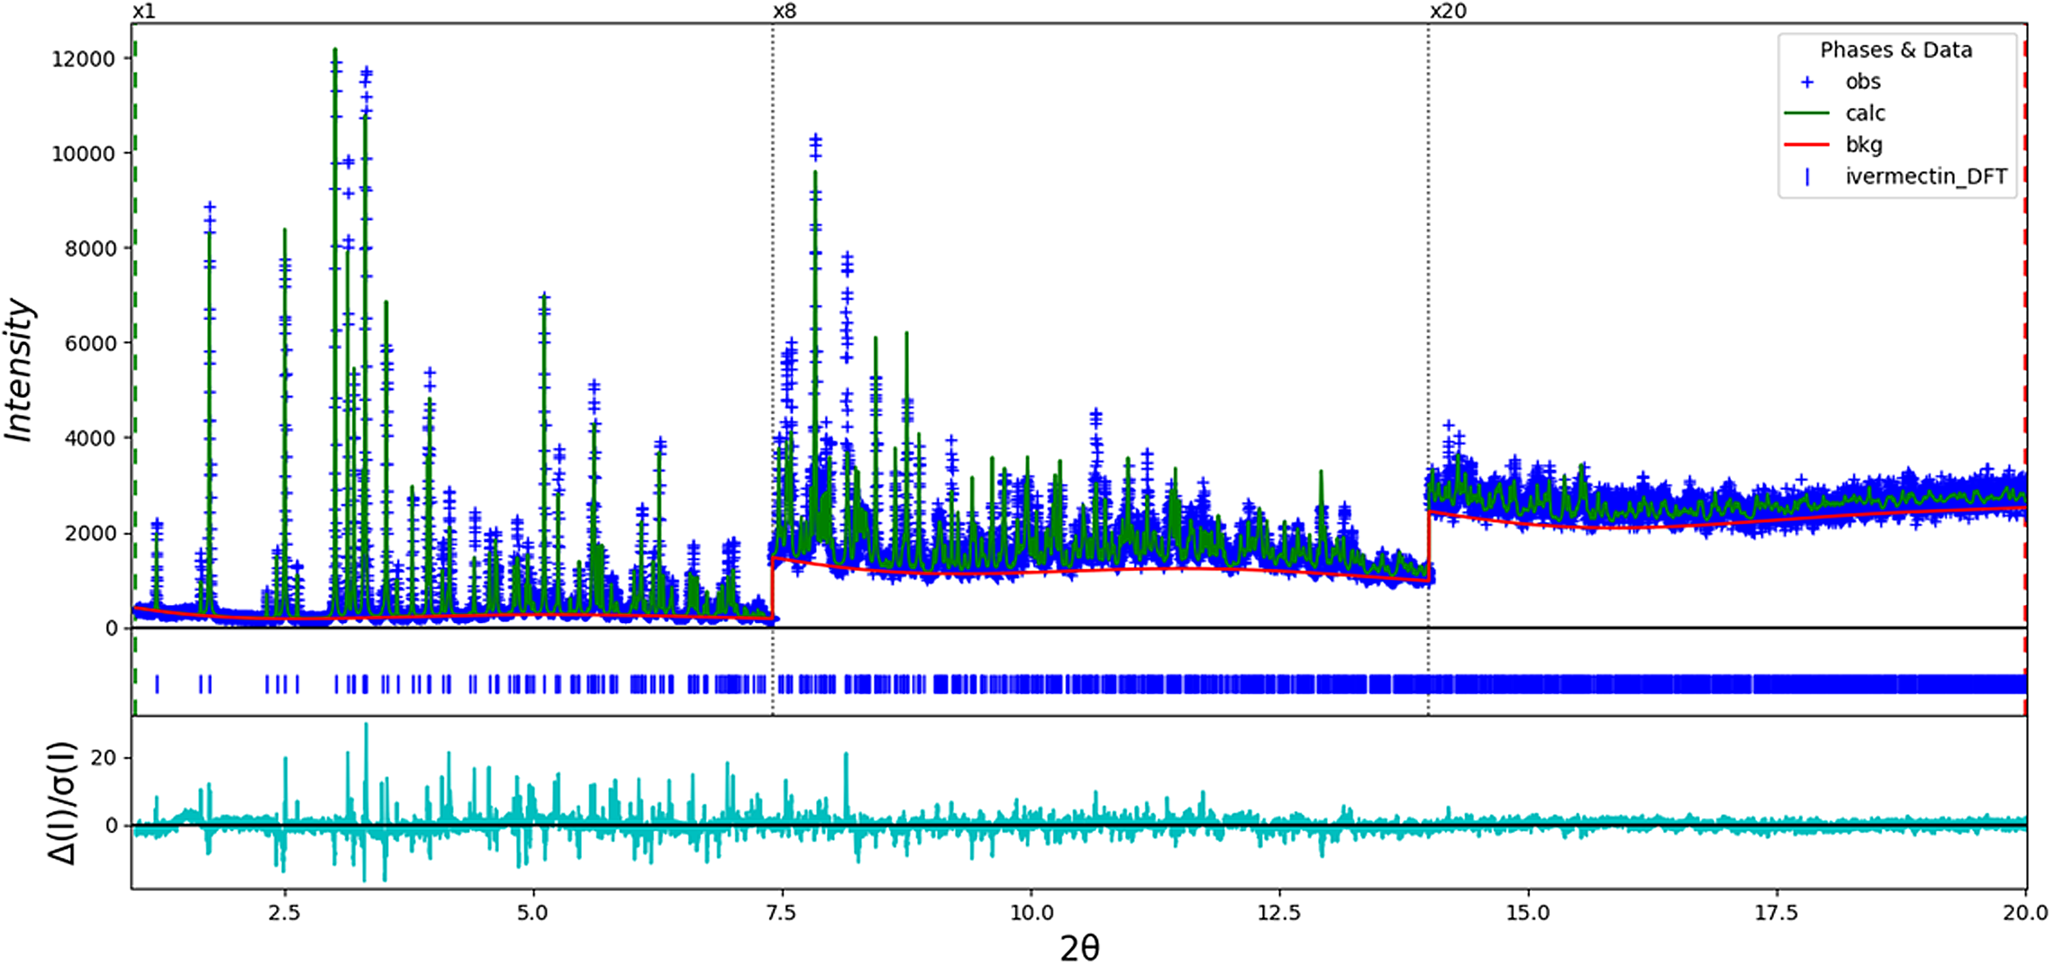
Figure 6. The Rietveld plot for the refinement of ivermectin hemihydrate ethanolate. The blue crosses represent the observed data points, and the green line is the calculated pattern. The cyan curve is the normalized error plot. The vertical scale has been multiplied by a factor of 8× for 2θ > 7.4°, and by a factor of 20× for 2θ > 14.0°.
A density functional geometry optimization (fixed experimental unit cell) was started using VASP (Kresse and Furthmüller, Reference Kresse and Furthmüller1996) through the MedeA graphical interface (Materials Design, 2016). The calculation was carried out on 16 2.4 GHz processors (each with 4 GB RAM) of a 64-processor HP Proliant DL580 Generation 7 Linux cluster at North Central College. The calculation used the GGA-PBE functional, a plane wave cutoff energy of 400.0 eV, and a k-point spacing of 0.5 Å−1 leading to a 3 × 3 × 1 mesh, and took ~12.7 days. The DFT optimization was finished using CRYSTAL14 (Dovesi et al., Reference Dovesi, Orlando, Erba, Zicovich-Wilson, Civalleri, Casassa, Maschio, Ferrabone, De La Pierre, D-Arco, Noël, Causà and Kirtman2014). The basis sets for the H, C, and O atoms were those of Gatti et al. (Reference Gatti, Saunders and Roetti1994). The calculation was run on eight 2.1 GHz Xeon cores (each with 6 GB RAM) of a 304-core Dell Linux cluster at IIT, using 8 k-points and the B3LYP functional, and took ~8 days.
III. RESULTS AND DISCUSSION
The refined atom coordinates of ivermectin hemihydrate ethanolate and the coordinates from the DFT optimization are reported in the CIFs deposited with ICDD. The powder pattern of this study and that of Rolim et al. (Reference Rolim, do Santos, Chaves, Goncalves, Freitas-Neto, do Nascimento, Soares-Sobrinho, de Albuquerque, de Lima and Rolim-Neto2014) exhibit some similarities (Figure 7), but it is difficult to conclude that they represent the same material. Our pattern exhibits similarities to both Grobler's ivermectin starting material MG1 and his material crystallized from ethanol (MG6; Figure 8). The root-mean-square Cartesian displacement of the non-hydrogen atoms in the Rietveld-refined and DFT-optimized structures is 0.289 Å (Figure 9), within the range expected for correct structures (van de Streek and Neumann, Reference van de Streek and Neumann2014). This discussion concentrates on the DFT-optimized structure. The asymmetric unit (with atom numbering) is illustrated in Figure 10, and the crystal structure is presented in Figure 11.
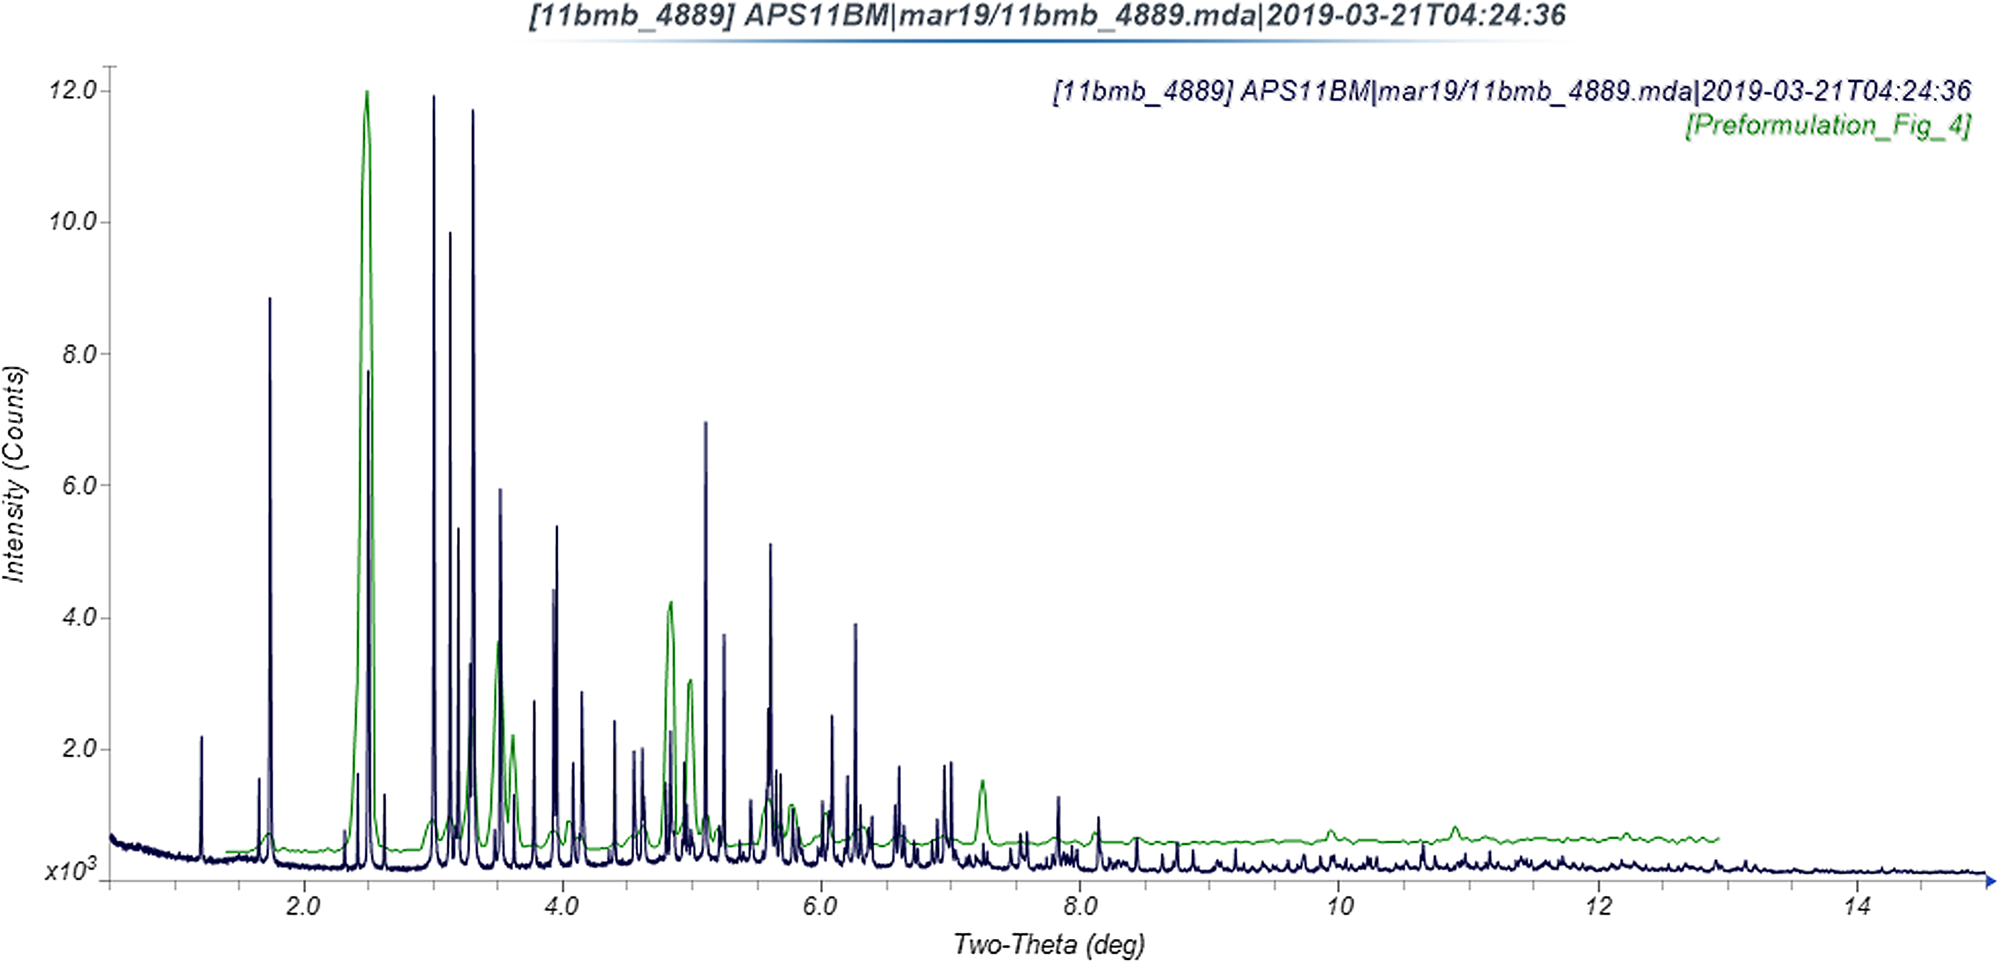
Figure 7. Comparison of the synchrotron pattern of ivermectin hemihydrate ethanolate to the diffraction pattern reported by Rolim et al. (Reference Rolim, do Santos, Chaves, Goncalves, Freitas-Neto, do Nascimento, Soares-Sobrinho, de Albuquerque, de Lima and Rolim-Neto2014). The published pattern was digitized using UN-SCAN-IT (Silk Scientific, 2013) and scaled to the synchrotron wavelength of 0.412826 Å using MDI JADE Pro (MDI, 2019).
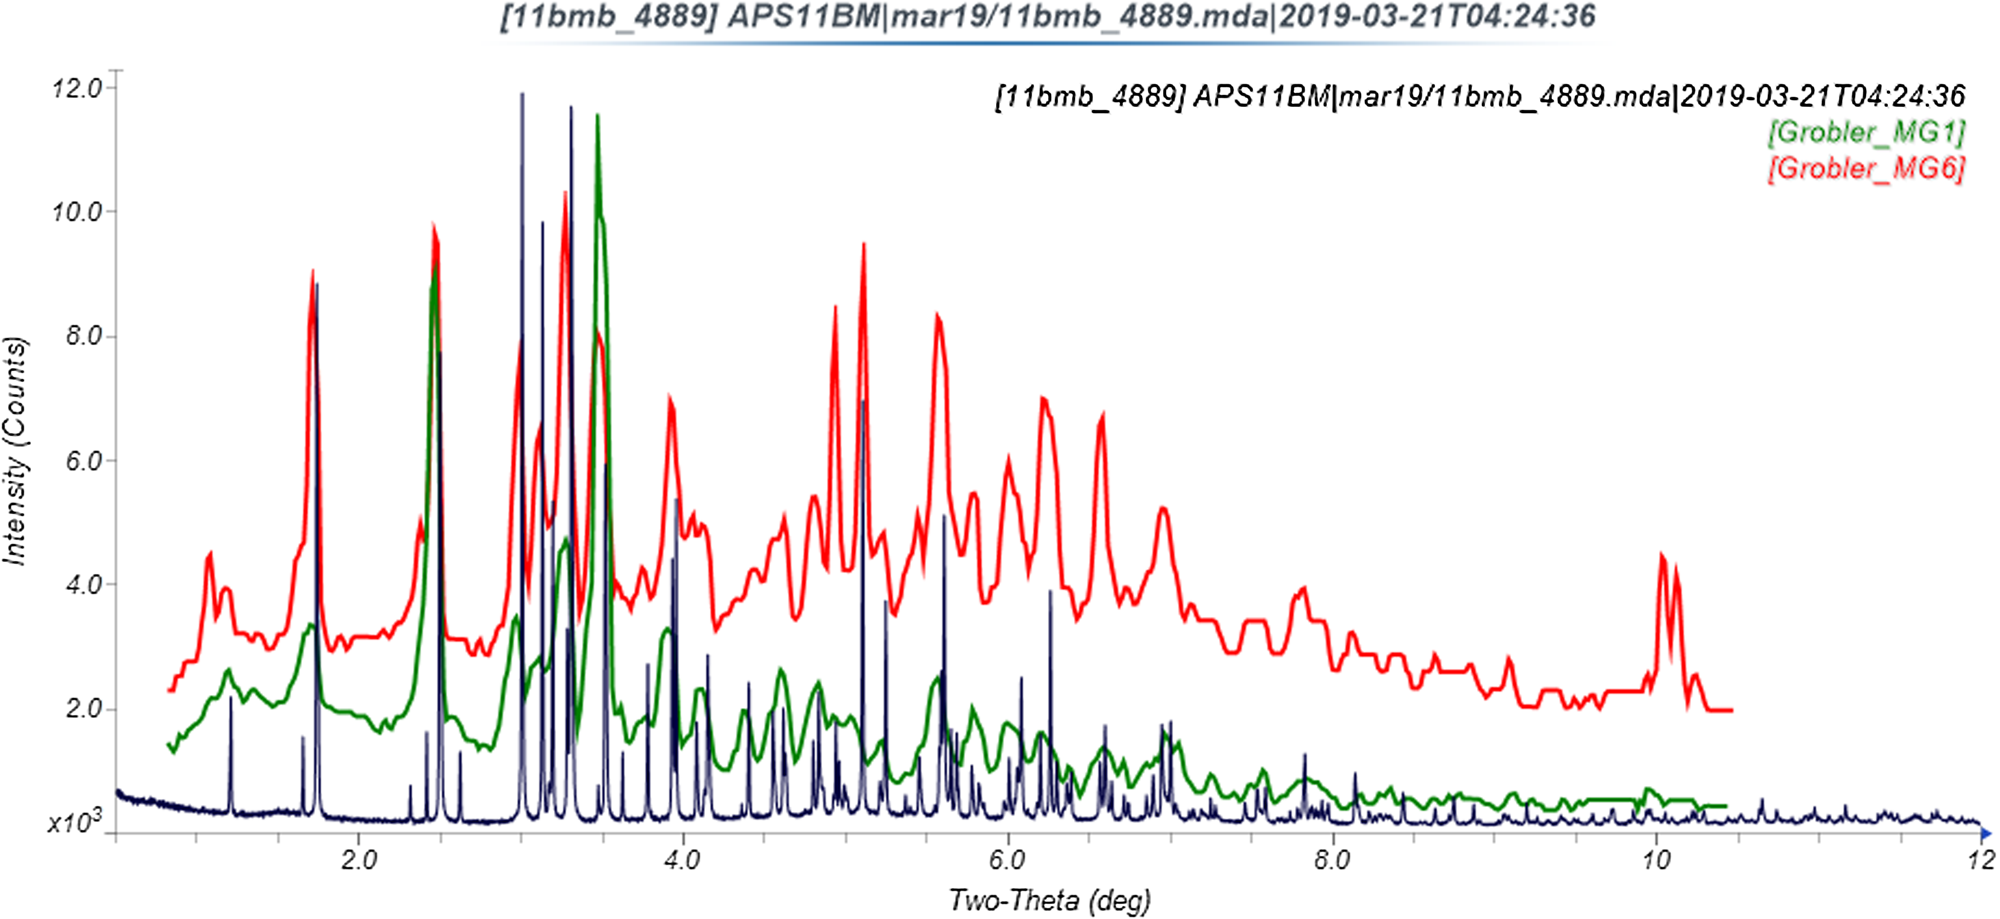
Figure 8. Comparison of the synchrotron pattern of ivermectin hemihydrate ethanolate to diffraction patterns of Forms MG1 and MG6 reported by Grobler (Reference Grobler2016). The published patterns were digitized using UN-SCAN-IT (Silk Scientific, 2013) and scaled to the synchrotron wavelength of 0.412826 Å Using MDI JADE Pro (MDI, 2019).

Figure 9. Comparison of the Rietveld-refined (red) and VASP-optimized (blue) structures of ivermectin. The rms Cartesian displacement is 0.298 Å.
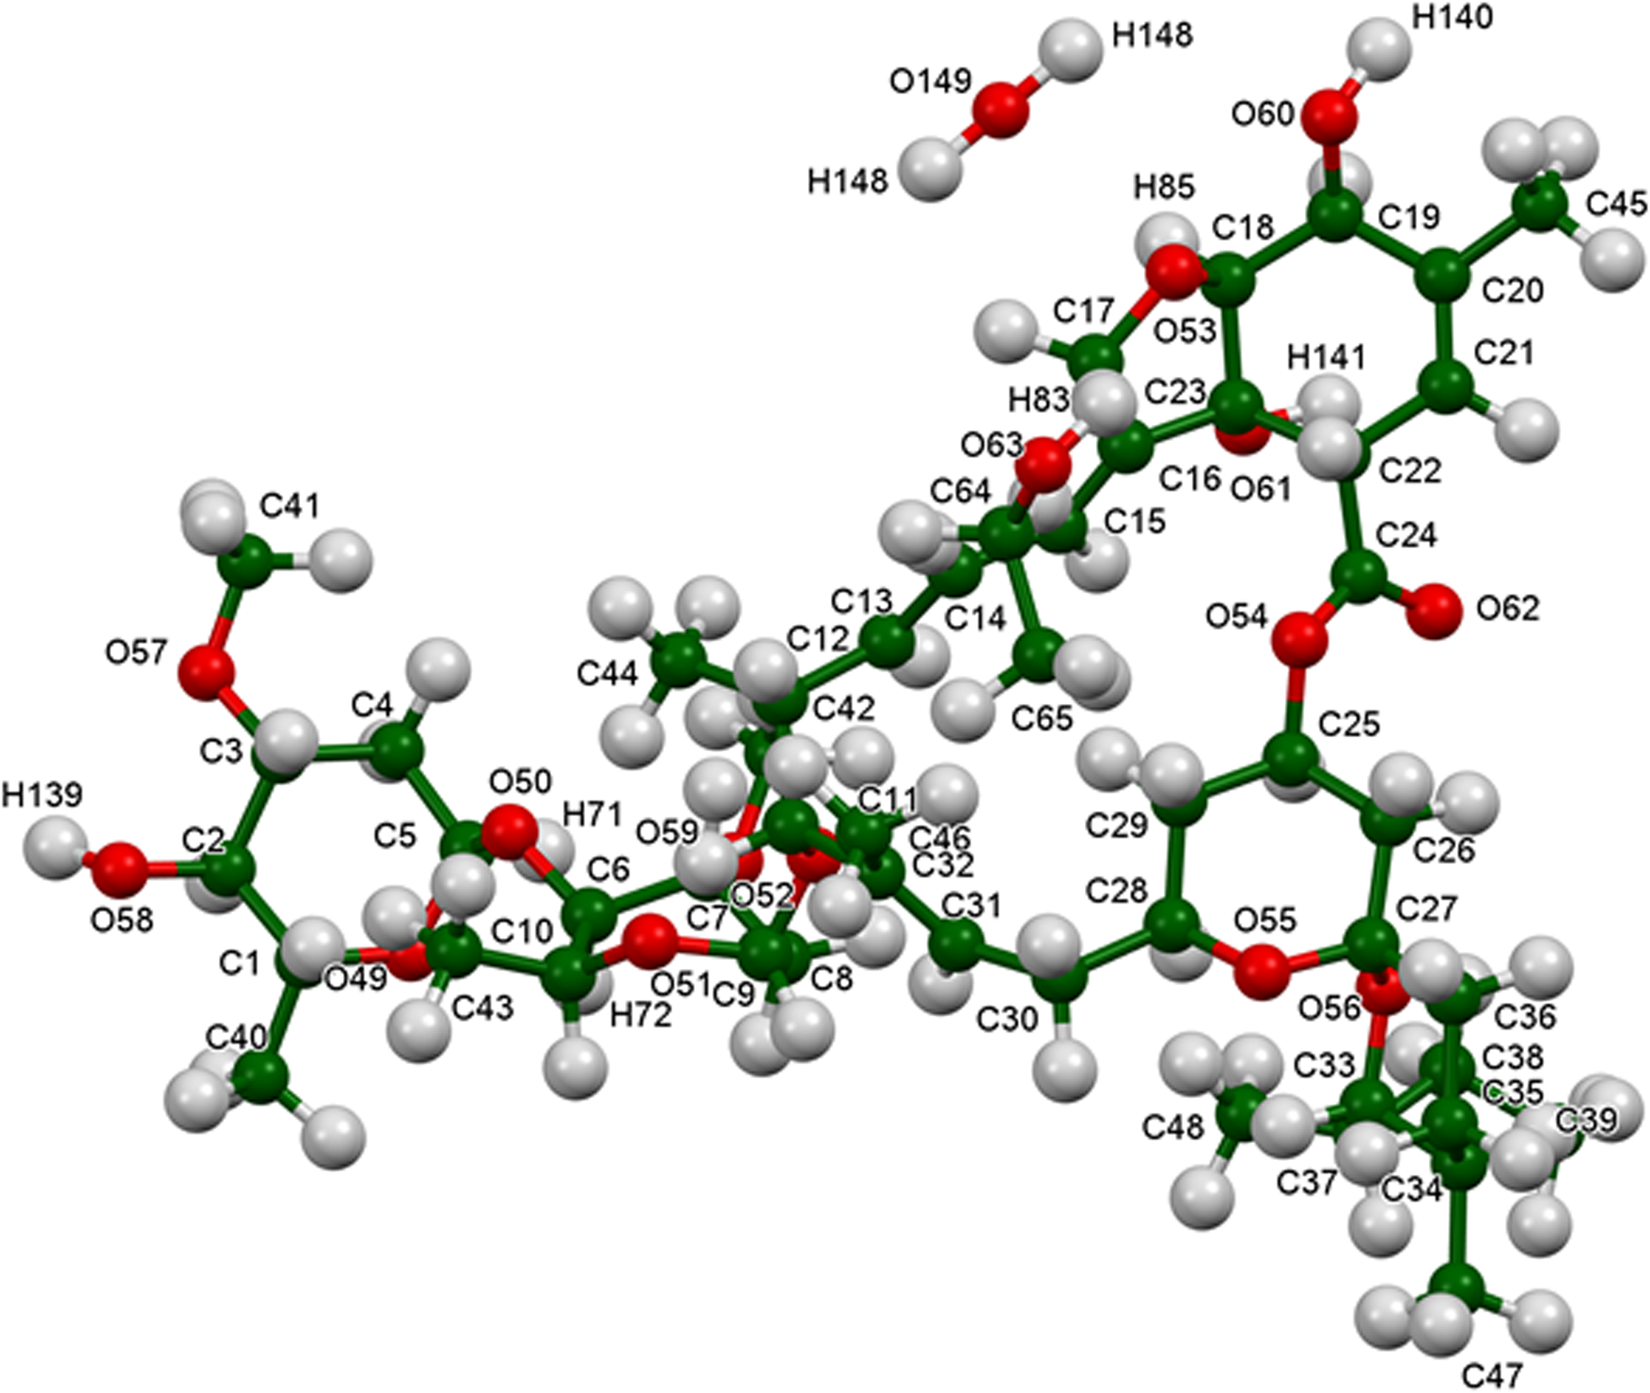
Figure 10. The asymmetric unit of ivermectin hemihydrate ethanolate, with the atom numbering. The atoms are represented by 50% probability spheroids. The U iso were not refined, but assigned as the “reasonable” values of 0.05 Å2 for the heavy atoms and 0.065 Å2 for the hydrogen atoms.

Figure 11. The crystal structure of ivermectin hemihydrate ethanolate, viewed down the b-axis.
The crystal structure is best viewed down the relatively-short b-axis (Figure 11). There are layers of ivermectin molecules parallel to the bc-plane. The water and ethanol molecules reside in small voids in the structure (Figure 12; probe radius = 1.0 Å). One of the voids in Figure 12 appears to be empty; an attempt was made to place a water molecule in the void, but the occupancy refined to a negative value.
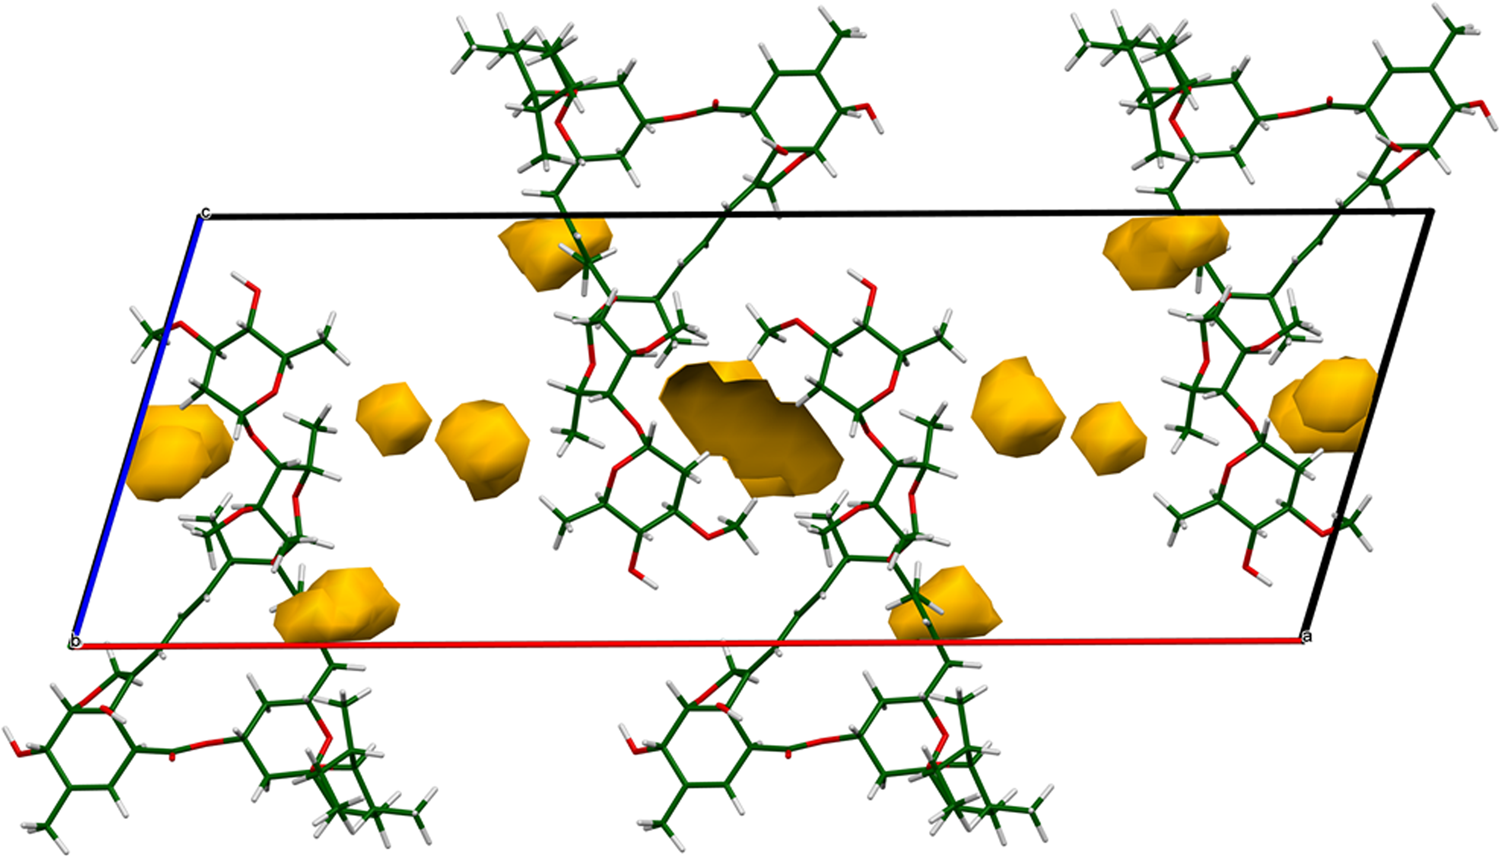
Figure 12. The voids (probe radius = 1.0 Å) in the structure of ivermectin hemihydrate ethanolate. The water and ethanol molecules reside in these voids.
Almost all of the bond distances, angles, and torsion angles fall within the normal ranges indicated by a Mercury/Mogul Geometry check (Macrae et al., Reference Macrae, Sovago, Cottrell, Galek, McCabe, Pidcock, Platings, Shields, Stevens, Towler and Wood2020). The O57–C28–C30 angle of 109.3° (average = 105.8(10)°, Z-score = 3.6) is flagged as unusual. This angle lies slightly outside a narrow distribution of a few similar angles. The torsion angle C9–O54–C11–C12 is flagged as unusual; this represents the linking of the two portions of the molecule, and it is likely that crystal packing forces influence the molecular conformation. The torsion angles involving rotation around the C37–C38 bond (such as C33–C37–C38–C39) are flagged as unusual. This angle lies near a minor gauche population of mainly trans angles.
Quantum chemical geometry optimization of the ivermectin molecule (DFT/B3LYP/6-31G*/water) using Spartan ‘18 (Wavefunction, 2019) indicated that the observed solid-state conformation is 12.9 kcal mol−1 higher in energy than the local minimum (Figure 13). The rms Cartesian displacement between the two structures is 0.547 Å, and the displacements are spread throughout the molecule. Molecular mechanics conformational analysis (MMFF) indicated that the observed conformation is essentially the global minimum-energy conformation.
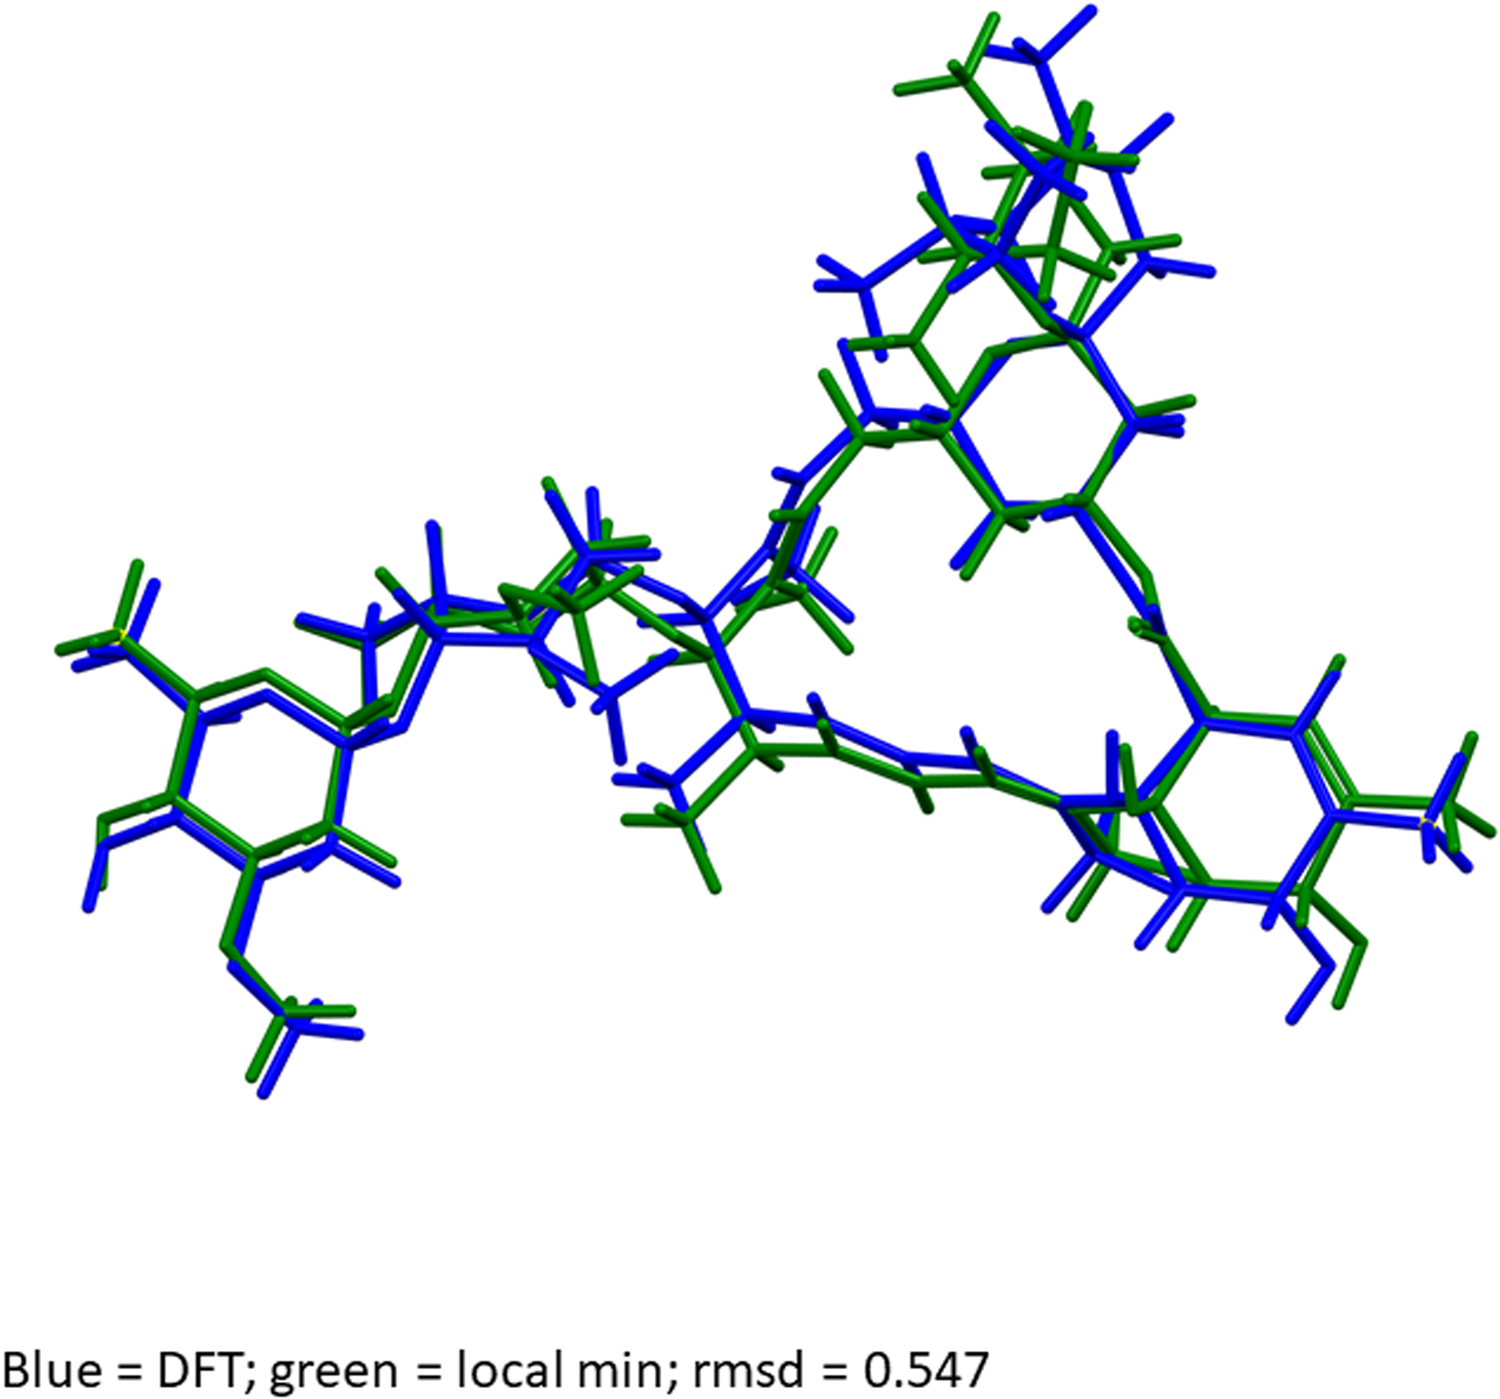
Figure 13. Comparison of the observed solid-state ivermectin conformation (blue) to the local minimum-energy conformation. The rms Cartesian displacement is 0.547 Å, and the energy difference is 12.9 kcal mol−1.
Analysis of the contributions to the total crystal energy using the Forcite module of Materials Studio (Dassault, 2019) suggests that bond, angle, and torsion contributions to the intramolecular deformation energy are significant. The intermolecular energy is dominated by electrostatic attractions, which in this force-field-based analysis include cation coordination and hydrogen bonds. The hydrogen bonds are better analyzed using the results of the DFT calculation.
Hydrogen bonds are significant in the crystal structure (Table I). The water molecule O147–H146 acts as a donor to the hydroxyl group O63. The ethanol molecule acts as a donor to the hydroxyl group O60. The hydroxyl group O63–H138 makes bifurcated hydrogen bonds to the ketone O64 and the hydroxyl group O60. The hydroxyl group O62–H137 acts as a donor to the ether oxygen O55. The hydroxyl group O60–H136 acts as a donor to the ether oxygen O59. Some of these H-bonds are intramolecular. The energies of the O–H⋯O hydrogen bonds were calculated from the correlation of Rammohan and Kaduk (Reference Rammohan and Kaduk2018). Several C–H⋯O hydrogen bonds were detected. Although weak, their number means that they probably contribute significantly to the crystal energy.
TABLE I. Hydrogen bonds (CRYSTAL14) in ivermectin hemihydrate ethanolate.
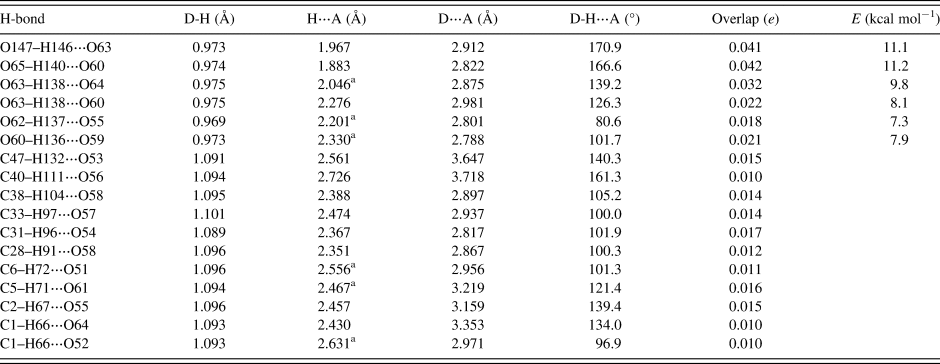
a Intramolecular.
The volume enclosed by the Hirshfeld surface (Figure 14; Hirshfeld, Reference Hirshfeld1977; Turner et al., Reference Turner, McKinnon, Wolff, Grimwood, Spackman, Jayatilaka and Spackman2017) is 1359.03 Å3, 100.19% of one-fourth the unit cell volume. The molecules are thus tightly packed. All of the significant close contacts (red in Figure 14) involve the hydrogen bonds. The volume/non-hydrogen atom is 19.2 Å3.
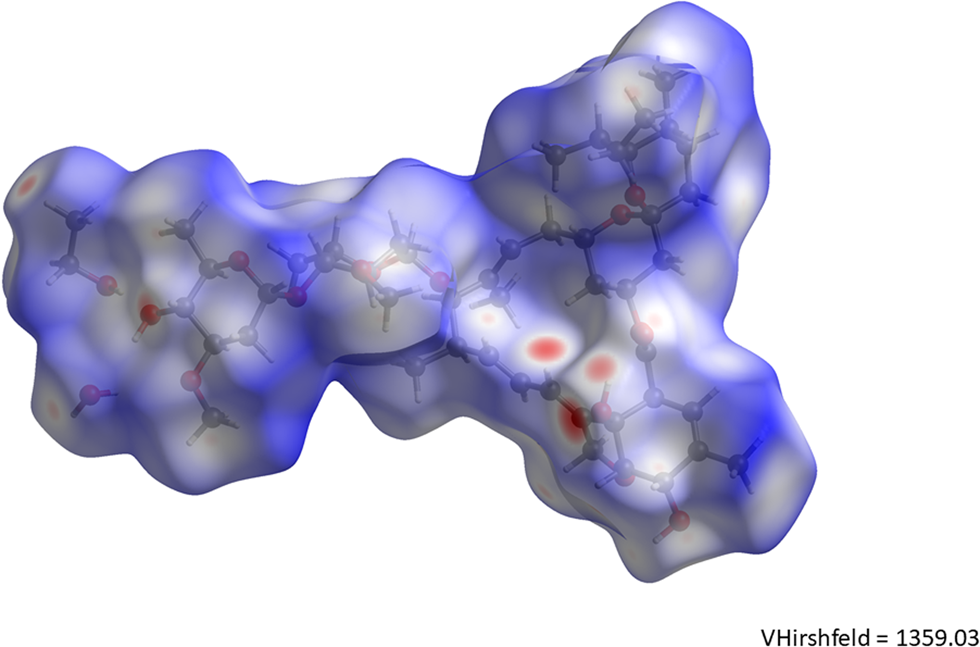
Figure 14. The Hirshfeld surface of ivermectin hemihydrate ethanolate. Intermolecular contacts longer than the sums of the van der Waals radii are colored blue, and contacts shorter than the sums of the radii are colored red. Contacts equal to the sums of radii are white.
The Bravais–Friedel–Donnay–Harker (Bravais, Reference Bravais1866; Friedel, Reference Friedel1907; Donnay and Harker, Reference Donnay and Harker1937) morphology suggests that we might expect platy morphology for ivermectin hemihydrate ethanolate, with {100} as the principal faces. A second-order spherical harmonic model for preferred orientation was incorporated into the refinement. The texture index was only 1.007, indicating that preferred orientation was not significant in this rotated capillary specimen. The powder pattern of ivermectin hemihydrate ethanolate from this synchrotron data set has been submitted to ICDD for inclusion in the Powder Diffraction File™.
IV. DEPOSITED DATA
The Crystallographic Information Framework (CIF) files containing the results of the Rietveld refinement (including the raw data) and the DFT geometry optimization were deposited with the ICDD. The data can be requested at info@icdd.com. The three Supplementary Figures have been deposited with Cambridge University Press.
SUPPLEMENTARY MATERIAL
The supplementary material for this article can be found at https://doi.org/10.1017/S0885715621000488.
ACKNOWLEDGEMENTS
The use of the Advanced Photon Source at Argonne National Laboratory was supported by the U.S. Department of Energy, Office of Science, Office of Basic Energy Sciences, under Contract No. DE-AC02-06CH11357. This work was partially supported by the International Centre for Diffraction Data. We thank Lynn Ribaud and Saul Lapidus for their assistance in the data collection, and Andrey Rogachev for the use of computing resources at IIT.
CONFLICTS OF INTEREST
The authors have no conflicts of interest to declare.