NOMENCLATURE
- aδ
mean speed of sound in the boundary layer, m/s
- C
Chapman-Rubesin constant
- h
specific enthalpy of flow, MJ/kg
- L
characteristic length, m
- Lsep
separation length, mm
- M
Mach number
- p
pressure, Pa
- ps
pressure inside separation bubble, Pa
- Re
Reynolds number
- t
time, μs
- T
temperature, ∘K
- T*
Eckeret reference temperature, ∘K
- U
velocity, m/s
- x
distance in streamwise direction along the flat plate, mm
- y
distance perpendicular to the streamwise direction, mm
- Δtfp
time for establishment of attached flow on flat plate, μs
- Δtsep
time for establishment of separated flow on flat plate, μs
- θ
separation angle, radians
Common subscripts
- 0
stagnation conditions
- i
conditions at shock impingement location
- r
conditions at reattachment
- ∞
freestream conditions
1.0 INTRODUCTION
Interactions between shock waves and boundary layers (SBLI) are of fundamental and practical importance since they often occur in high-speed flow fields; the shock essentially imposes a (sharp) adverse pressure gradient on the boundary layer, whose response may have consequence for the entire flow field, especially when the boundary layer separates owing to sufficient shock strength (termed strong interaction)(Reference Delery and Marvin1). The interaction and its control in variety of scenarios have been extensively studied and reported in the literature. The parameters governing the interaction are related to the imposed adverse pressure by the shock; and are also related to the resistance of the boundary layer to the adverse pressure, which is determined by the skin friction and upstream communication of the adverse pressure- this in turn depends on the velocity and Mach number profiles of the boundary layer. Concerning the separation length for strong interactions, its increase with the shock strength and decrease with the freestream Mach number are well understood from experiments as well as computations; the effect of Reynolds numbers at various flow regimes has also been also widely reported(Reference Gadd, Holder and Regan2-Reference Settles and Bogdonoff9). Recent developments in flow diagnostics – especially high-speed Particle Image Velocimetry (PIV) and anemometry, as well as advances in computations such as DNS and LES and computational facilities – have enhanced the understanding of such complex aspects as three-dimensionality and unsteadiness associated with turbulent supersonic interactions(Reference Humble, Elsinga, Scarano and van Oudheusden10-Reference Wu and Pino Martin13). There are, however, relatively fewer studies on the thermal aspects of the interaction which are prominent at hypersonic speeds. Considering the role of wall temperature on the interaction, it is understood that for fully laminar or turbulent interactions, wall cooling leads to a reduction in the size of the separation bubble(Reference Bray, Gadd and Woodger14-Reference Bleilebens and Olivier17). However, for transitional interactions, the trend is reversed owing to the stabilisation of the flow due to wall cooling(Reference Delery and Coet18). Most of these reports are at supersonic speeds. The experiments by Lewis et al(Reference Kubota, Lees and Lewis15) at Mach 6 were performed in hypersonic wind tunnel, which however does not simulate the high enthalpies (or equivalently flow kinetic energy) associated with hypersonic flows.
The simulation of moderate- to high-flow total enthalpies requires impulse facilities such as shock tunnels. There are, however, very few shock-tunnel studies on the interaction. Though the impulse facilities simulate the required high enthalpies, their test time is a major concern, especially when flow separation is involved. The evolution of separation takes more time than the evolution of attached boundary layer and inviscid flow. Thus, for any experiment involving flow separation in shock tunnels, it must be ensured that a statistically steady flow field with separation is established within the tunnel test time(Reference Holden19-Reference Swantek and Austin21). The experiments by Bleilebens and Olivier(Reference Bleilebens and Olivier17) are perhaps the first shock-tunnel demonstration of the increase in separation bubble size with increase in wall temperature for a compression corner flow. Few experimental studies have addressed the role of total enthalpy and real gas effects on the interaction. For compression corner flows, it was reported from shock tunnel experiments at total enthalpies of up to 19MJ/kg that the real gas effects played a little role for small compression ramp angles(Reference Mallinson, Gai and Mudford22). Davis and Sturtevant(Reference Davis and Sturtevant23) reported extensive shock-tunnel study with a double wedge configuration at various high freestream (total) enthalpies from 4MJ/kg to 23MJ/kg and with large wedge angles, giving important insights on the real gas effects on SBLI; a similarity law for separation length with the inclusion of real gas effects was obtained. However, comparison of the experimental data on the interaction at moderate enthalpies (when real gas effects are not prominent) and at high enthalpies is required in order to highlight the role of real gas effects.
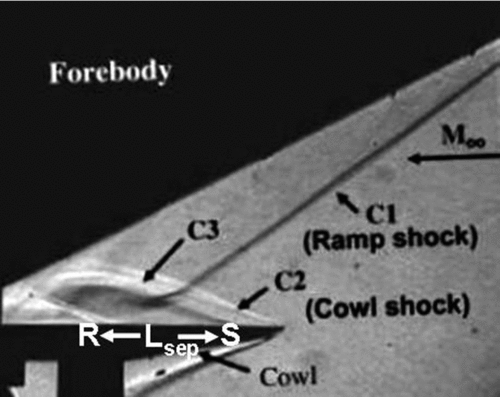
Shock-tunnel experiments on impinging shock boundary-layer interactions are even more complicated in terms of flow evolution than SBLI on compression corners, since they also involve the evolution of the impinging shock which precedes the issue of evolution of separation. The study of the impinging shock boundary-layer interaction at hypersonic speeds is in part motivated by its occurrence in scramjet intakes operating at off-design (high Mach number) conditions. This is when the ramp shock hits the cowl plate at some distance downstream of the leading edge. It is possible that the flow separates and the separation bubble is as large as the distance of the shock impingement location from the leading edge, as shown in Fig. 1, which is the Schlieren image of the intake flow field at Mach 8 (which is off-design)(Reference Mahapatra and Jagadeesh24). It may be noted from Fig. 1 that the distance Lsep from the separation point S to the reattachment point R is almost the same as the distance from the leading edge of the projected location of impingement of the ramp shock on the cowl plate. In fact, it is impossible to distinguish the separation shock which is very close to the cowl leading-edge shock since the separation occurs very close to the leading edge.

Figure 1. A Schlieren image of intake flow field at off-design Mach number of 8 (Mahapatra and Jagadeesh(Reference Mahapatra and Jagadeesh24)).
Such a separation bubble of a length comparable to the distance of inviscid shock impingement location from the leading edge is said to be large in the present study. The above figure is a special case even for a large separation bubble, with the separation happening close to leading edge where the boundary layer is insignificantly thin. Hypervelocity separation near the leading edge (called zero boundary-layer thickness separation) have been addressed only recently in the literature(Reference Moss, O'Byrne, Deepak and Gai25). It is against this backdrop that the present study was initiated to understand hypersonic impinging shock wave boundary-layer interactions accompanied by large separation bubbles at moderate to high flow total enthalpies typical of hypersonic flows. The simulation of the hypersonic flows of moderate to high enthalpies are achieved in IISc hypersonic shock tunnels. To ensure that the various features of the interaction are resolved better with the diagnostics, the large separation bubbles are to be at least a few centimetres in size. The evolution of separation bubbles of such sizes, along with the evolution of the impinging shock within the short run time of the shock tunnels, is a preliminary concern addressed in the present study. On ensuring the establishment of statistically steady flow field within the test time, the spatial organisation of the large separation bubble near the leading edge is analysed from the Schlieren flow visualisations and surface pressure measurements. With a vanishing boundary-layer thickness near the leading edge in comparison to the separation length and with strong impinging shock with a pressure jump much greater than that required for incipient separation, the effect of various parameters on the separation length are studied. The qualitative differences in the interaction between enthalpies of very different ranges are also explored.
2.0 EXPERIMENTAL FACILITIES AND TEST MODEL
Experiments are performed in IISc hypersonic shock tunnels HST-2 and FPST (Free Piston-driven Shock Tunnels, also called HST-3). In shock tunnels, a shock propagating through a shock tube reflects at the end of the shock tube. On reflection, the test gas (air in the present study) is compressed to high pressure and temperature (thus simulating the required high enthalpy), which serves as the reservoir from which the test gas expands through a nozzle to the required hypersonic Mach number (based on the area ratio of the nozzle) into the test section. HST-2(Reference Mahapatra and Jagadeesh24) is a conventional shock-tunnel facility where the high pressure in the driver section, which is filled with the driver gas He, ruptures a metal diaphragm (whose thickness determines rupture pressure), due to which a shock propagates through the driven section with test gas (air). The shock strength, which determines the total pressure and temperature of the flow to be simulated in the test section, is dependent on the state of the driver and driven gasses during the diaphragm rupture. The tunnel has a test section of 300mm × 300mm in cross section and a length of 450mm. For air, the facility can simulate Mach numbers ranging from 6 to 12 by varying the nozzle throat and a maximum enthalpy of 3MJ/kg. The Reynolds number ranges from 1 × 10⁶/m to 5 × 10⁶/m with air as the test gas. Higher enthalpies are simulated in FPST(Reference Kumar and Reddy26), where the driver gas is compressed to a higher pressure and temperature by means of a piston, which ruptures the diaphragm and creates a shock that propagates through the driven gas. While the thicker tunnel walls allow higher compression in FPST, the high temperature of the driver gas due to compression also contributes significantly in simulating higher enthalpies. The test section in FPST is of same cross sectional area as HST-2.
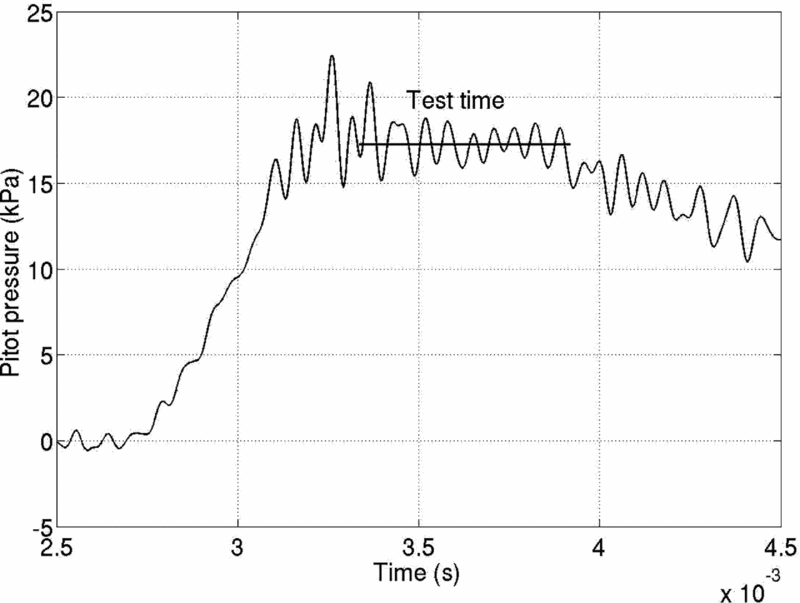
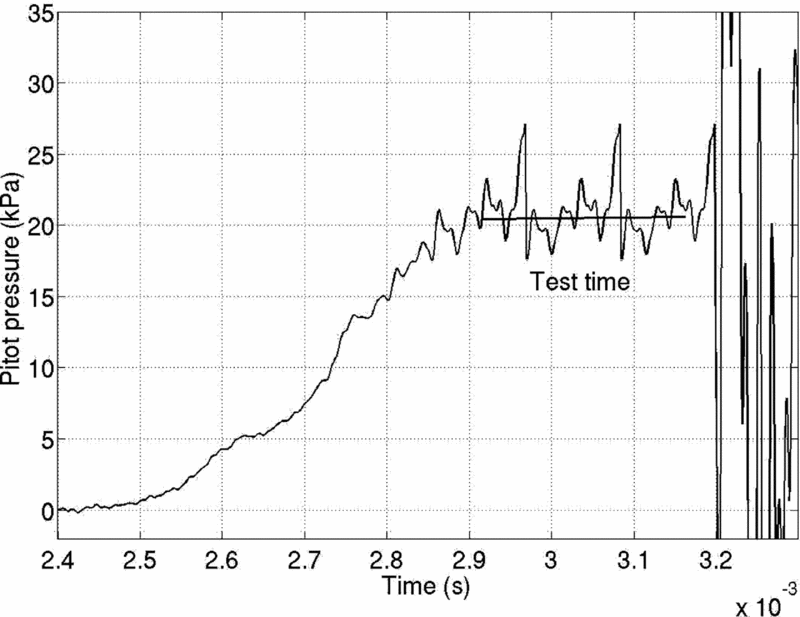
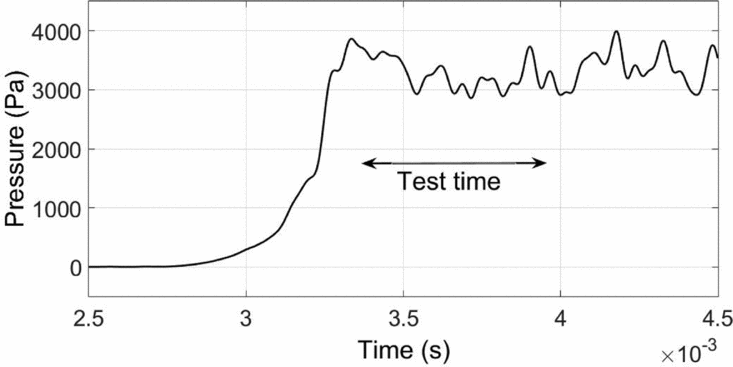
The end of the shock tube portion in the tunnels (the driven section) is equipped with two PCB pressure sensors which are used to measure the shock speed (knowing the distance between the sensors) as well as the reservoir pressure for the tunnel at the nozzle entry after the shock reflects at the shock tube end. From the shock speed obtained from the signals and from the initial driven section conditions, the reservoir conditions (total temperature and also total pressure) can be estimated. The establishment of steady freestream in the test section can be ensured from the measured pitot pressure signals (stagnation pressure after a normal shock in the freestream) as shown in Fig. 2 (HST-2) and Fig. 3 (FPST) for comparable Mach numbers. The test times are also indicated in the figures, during which the value of the pitot pressure is measured as the time average. It may be noted that the test time in FPST (~250-300μs) for the high-enthalpy simulation is much lower than that in HST-2 (~600μs for all cases).

Figure 2. Typical pitot signal in HST-2 (for M∞ = 8.67, Re∞ = 1.67 × 10⁶/m, h0 = 1.6MJ/kg).

Figure 3. Typical pitot signal in FPST (for M∞ = 8.61, Re∞ = 0.3 × 10⁶/m, h0 = 6MJ/kg).
The freestream conditions are estimated from the calculated reservoir conditions and from the measured pitot pressure using normal shock relations using STN code(Reference Krek and Jacobs27) and are tabulated in Table. 1. Since the minimum Mach number that can be simulated in FPST with air is ~8.5 due to geometric considerations, the experiments addressing the role of freestream enthalpy are performed at the same range of the nominal Mach number of ~8.5 even in HST-2, although at lower Mach numbers (due to higher densities and static pressure), the quality of measurements and visualisations are usually better.
Table 1 Freestream conditions

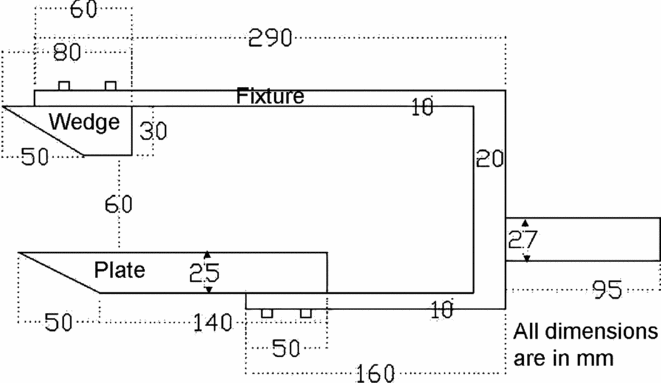
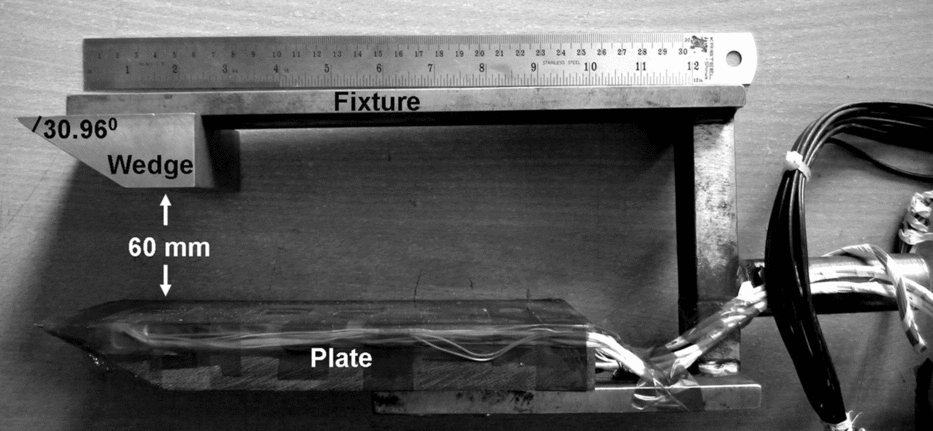
The experiments are performed with flat plate as the test model over which the impinging shock is generated by means of a wedge (or shock generator) at the large angle of 30.96° to the freestream. The flat plate and the wedge are held in their positions by a fixture whose other end is fastened to the holding sting in the shock tunnel. A two-dimensional schematic of the test model with a flat plate and wedge held by the fixture is shown in Fig. 4, and a photograph of the model is shown in Fig. 5. The flat plate with an 80mm span can be moved back and forth on the fixture and held in the required position such that the location of the inviscid shock impingement relative to the leading edge can be varied. The large angle was chosen to generate a strong but attached oblique shock for which ideally (i.e. for the inviscid case) the Mach reflection is supposed to occur at the flat plate even for the highest Mach number of 8.67 in the absence of boundary layer, as well as the absence of expansion fan from the rear end of the wedge.

Figure 4. Schematic of the complete test model and arrangement used in the experiments.

Figure 5. Photograph of the test model.
The test model dimensions were chosen by considering tunnel blockage issues (which dictate the maximum cross-sectional dimensions) and the issue of internal blockage between the plate and shock generator, mainly due to the interaction of expectedly strong separation shock from the plate and the impinging shock(Reference Sriram28). In fact, it is due to concerns about internal blockage that the wedge is cut short in length. This generates expansion waves at the end of the wedge (the straight portion in the model) which slightly curves the impinging shock and makes it a little weaker. Due to the curving of the shock by the expansion fan, the shock impinges on the plate slightly downstream of the expected location without the presence of expansion fan; further, the weakening of the shock is found to result in regular reflection rather than Mach reflection, as was seen from the two-dimensional Euler simulations (using the commercial finite volume code FLUENT)(Reference Sriram28) for the present experimental cases.
For the Mach number of 5.96, the shock generated by the wedge is estimated from inviscid oblique shock calculations to be at 42.16° with the freestream. Thus, the shock is expected to impinge on the flat plate at 90mm from the leading edge if the leading edge of the plate is 10mm behind (in downstream direction) the leading edge of the shock generator. However, the Euler computations predicted the impingement to be 5mm downstream of the estimate from oblique shock calculation (i.e. 95mm from the leading edge)(Reference Sriram28). Thus, the inviscid shock impingement on the plate is located in the present study by accounting for the interaction of the expansion waves from the rear end of the wedge with the impinging shock. For the same relative position of the plate at a nominal Mach number of 8.5, the inviscid shock impingement was 100mm from the leading edge. It must however be admitted that the boundary-layer displacement at the wedge leads to a relatively larger shock angle than the inviscid predictions, and thus the actual location of impingement should be slightly upstream of the inviscid predictions.
Different flat plate models made of Hylem with provisions for accommodating different pressure sensors (along the span-wise centre line) are used in the study. Kulite sensors were initially used for the pressure measurements for a few cases, but over the course of experiments, a few sensors (especially the ones around the re-attachment) ceased to respond, due probably to the high temperatures. Since experiments at much higher enthalpies were to be performed, a flat plate model accommodating PCB sensors was subsequently used in the study, since PCBs can withstand higher temperatures, even though Kulite sensors have a better signal-to-noise ratio and are not affected by structural vibrations as PCBs are. There were also few measurements using MEMS-based pressure sensors, developed in-house(Reference Ram29), which can be closely spaced (3mm being the distance between two sensors). Using MEMS sensors, it was possible to closely resolve the surface pressures, especially in the reattachment zone at Mach 5.96, and also the separation location at Mach 8.67 (it was not possible to mount a pressure sensor very close to the leading edge due to the lesser model thickness, and at Mach 5.96 the separation was always close to the leading edge).
Time-resolved Schlieren visualisations with z-type arrangements(Reference Satheesh30) of the flow field are obtained using a high-speed Phantom V-310 camera in HST-2. The visualisations are acquired at 10,000 frames per second with a spatial resolution of 640 × 480 pixels. However, with the same camera and light source, it was not possible to capture the interactions in FPST due to intense light emissions from the flow field itself. To overcome the emissions, a powerful light source (a Cavitar red light-emitting diode) of 400W operating at 20ns per pulse is used for Schlieren (the short pulses of light also ensure crisp images). The images are obtained at a frame rate of 100,000fps with a 100ns exposure using an ultra high speed camera, named Kirana, developed by Specialised Imaging Ltd, which can offer a maximum spatial resolution of 924 × 768px even at its maximum time resolution of 2 million frames per second. The light source is synchronised with the camera. The knife edge is oriented horizontally so that the density gradients in the lateral direction (which are expected to be higher than in the axial direction, particularly in the separation zone) are resolved. The focussed light is cut from above by the knife edge such that the increasing density from top to bottom is brightened and vice versa; thus, the shocks from the wedge would be dark and the shocks emanating from the plate would be white. The time-resolved Schlieren visualisations of the interaction and the surface pressure measurements are used to understand the evolution and the morphology of the interaction as discussed subsequently.
2.1 Measurement uncertainties
The uncertainties in freestream conditions are obtained from the uncertainties in measured shock tube conditions and pitot pressure from the method of uncertainty analysis described by Moffat(Reference Moffat31). For freestream conditions in HST-2, the uncertainty in freestream Mach number is ±3.2%, in freestream pressure and temperature it is ±4.4%, in total enthalpy it is ±3%, and in freestream Reynolds numbers it is ±8.3%. In FPST, the corresponding uncertainties are ±7.5%, ±10.6%, ±7.4% and ±19.8%, respectively. The Mach number of 5.96 was established from 24 shock-tunnel runs (the conditions in 16 of them are listed in Ref. 28), with a standard deviation of just 1% of the average Mach number; the standard deviation in enthalpy is 2% and in Reynolds number it is 2.3%. For the higher Mach number of 8.67 at 1.6MJ/kg in HST-2, 15 experiments are performed; the standard deviations in Mach number, enthalpy and Reynolds number are 1.8%, 3.1% and 3.5%, respectively. At Mach 8.21 and a flow enthalpy of 2.4MJ/kg, four experiments are performed with very small variations in freestream conditions. In FPS, six experiments are performed with standard deviations in Mach number, enthalpy and Reynolds numbers of 0.5%, 4.5% and 4%, respectively. Concerning surface pressure measurements, the Kulite sensors used in the present study have an uncertainty of ±0.5% and the PCB sensors have an uncertainty of ±1%. In the plots comparing the pressure data at different conditions, the error bars for the normalised surface pressure (by freestream pressure) for each condition indicate the maximum and minimum measured values over the number of runs at the specific condition. The scatter in separation length is very small, especially when compared with the uncertainty that shall be established subsequently.
3.0 FLOW MORPHOLOGY AND EVOLUTION
3.1 Morphology of the established steady flow field
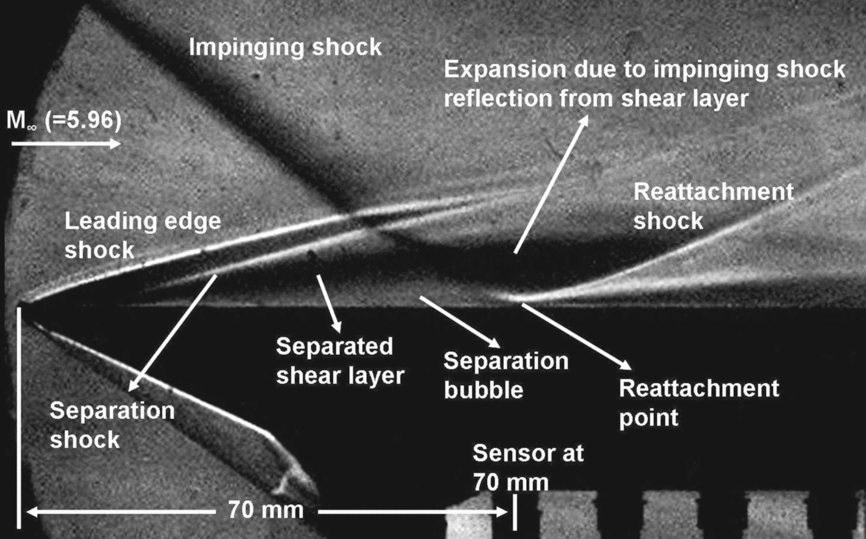
At the outset, it is useful to look at the Schlieren image of the interaction after a statistically steady flow field with the separation bubble has evolved, since the various features of the interaction identified from the image shall be referred in subsequent discussions. A Schlieren image of the interaction at Mach 5.96 with an inviscid shock impingement location of 75mm from the leading edge is shown in Fig. 6. It can be seen clearly that the separation bubble is almost the same length as the distance of the shock impingement location, with the separation apparently very close to the leading edge. It must also be noted that the separation bubble is skewed upstream – i.e. a disproportionately large streamwise distance from separation to the shock impingement on the shear layer, compared to the distance from shock impingement on shear layer to the reattachment – as suggested by the numerical simulations of Krishnan et al (2006)(Reference Krishnan, Yao, Sandham and Roberts32) for strong shocks with larger pressure jump across impinging shock, much higher than what is required for incipient separation.

Figure 6. The typical Schlieren image of the interaction with the indication of the various visible features (M∞ = 5.96, Re∞ = 4 × 10⁶/m, h0 = 1.3MJ/kg).
That the reattachment happens almost normal to the surface of the plate is another noteworthy feature. It may be seen that the reattachment shock is almost parallel to the surface at the point of reattachment and is slightly detached from the surface. Away from the surface, the reattachment shock rapidly curves and becomes oblique to the surface. A magnified view of only the region of interaction (the separation bubble and reattachment) is shown in Fig. 7, where it is clear that the reattachment shock is almost parallel to the plate surface at reattachment location.

Figure 7. Magnified view of separation bubble and reattachment (M∞ = 5.96, Re∞ = 4 × 10⁶/m, h0 = 1.3MJ/kg).
The above figure shows the cropped Schlieren image from the leading edge to a distance of 90mm from the leading edge as indicated in the left and right ends of the figure; the bottom of the image is the plate surface and the top of the image is 20mm above the surface of the plate. Most of subsequent Schlieren images shall thus be cropped and presented to show only the important portions of the image in the zone of interaction. The features are common to almost all the cases at lower enthalpies, even as the separation occurs considerably downstream at a nominal Mach number of 8.5 compared to the corresponding cases at a nominal Mach number of 6. However, with the considerably short separation bubble observed for the case at 6MJ/kg, similarities with the lower enthalpy cases cannot be clearly identified, especially as the clarity of the Schlieren images in FPST were affected by the illumination in the flow itself, as well as due to the low densities in the flow field as shown in Fig. 8.

Figure 8. Comparison of the Schlieren images (when the flow field is steady) in FPST obtained using different light sources and cameras (M∞ = 8.61, Re∞ = 0.3 × 10⁶/m, h0 = 6MJ/kg).
The features of the interaction are not clearly visible in the image obtained using the Phantom camera, but the emissions do make certain features visible. The emission from the flow field is the evidence of dissociated gas at high enthalpies, with different colours at different regions possibly due to differences in species (a discussion on the species shall be presented later). However, with the intense light source and the Kirana camera, the adverse effects of the emission on the Schlieren visualisation are overcome and the various features of the interaction are made visible and are labelled accordingly in the figure, though not so clearly as those in HST-2. The separation shock is clearly visible only as it interacts with the impinging shock. As it would later be shown, the conversion of the above Schlieren image into a ‘binary image’ leads to better identification of the features, where it shall become apparent that the upstream skewing of the separation bubble for the FPST case is not as prominent as in the cases at lower enthalpies in HST-2, despite the strong impinging shock.
3.2 Separation length
Even as the flow evolves, once the flow separates, the separation length is the estimated distance between the locations of separation and reattachment from the visualisations. Since the Mach numbers are high, the distance upstream of separation until which the influence of the adverse pressure gradient due to separation is felt in the boundary layer (called the upstream influence length) is less. Further, the upstream influence lengths are also expected to be lower when the separation occurs close to the leading edge, since the upstream influence is on the order of few displacement thicknesses at the location of the onset of the interaction as suggested by the free interaction theory(Reference Chapman, Kuhen and Larson33). It is also apparent from the visualisations that the separation shock almost emanates from the surface of the flat plate (except for the case in FPST), rather than being seen as formed due to the coalescing of compression waves from upstream of separation due to boundary-layer thickening. Since the upstream influence lengths are much smaller than the apparent separation bubble sizes from the visualisation, the intercept of (extended) separation shock on the flat plate surface can be taken as the location of separation for estimating the separation length. It must however be admitted that the precise location of separation would be a few displacement thicknesses downstream of the intercept of separation shock on the flat plate surface.
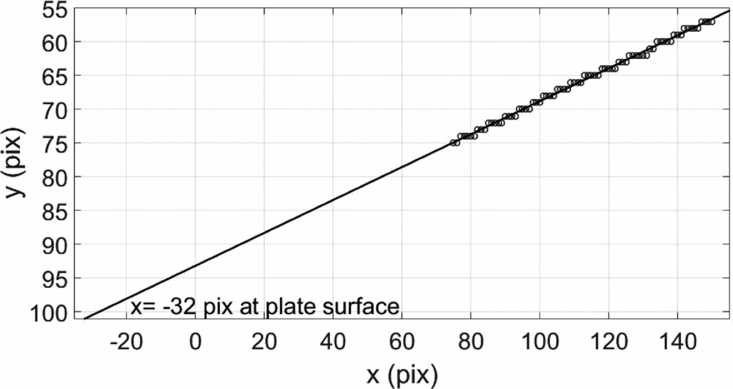
Two vertical lines crossing the separation shock may be seen in the Schlieren image, as shown in Fig. 9 (for steady flow field at Mach 5.96 with inviscid shock impingement at 95mm from the leading edge). The coordinates in the image are given in terms of pixels, with x coordinates from left to right and y coordinates from top to bottom. The coordinate directions and the length scales are also indicated in the figure. Along the vertical lines, the intensity variation may be plotted as shown in Fig. 10. There are two notable local peaks along each line, one corresponding to the leading-edge shock and the other corresponding to the separation shock. The y-location of the second peak in terms of pixels may be noted for each line. For better precision, many such vertical lines crossing the separation shock may be considered, from which many coordinate points of maximum intensity on the separation shock may be obtained. By fitting a line over the coordinates and extending it to the surface of the plate, the location of separation (to be precise, the foot of separation shock) is obtained as shown in Fig. 11.

Figure 9. The Schlieren image marked with references for locating the separation point; the line joining the points (100, 70) and (75, 76) is the separation shock (M∞ = 5.96, Re∞ = 4 × 10⁶/m, h0 = 1.3MJ/kg).

Figure 10. Intensity variations along the lines x = 100 and x = 75 (shown in Fig. 30).

Figure 11. The line fit representing separation shock along the points of maximum local intensity on the separation shock.
Thus, for the case shown in the above figure (Fig. 9), the separation point is located at 16mm from the leading edge (converting from pixels to mm) with an uncertainty of ±0.05mm based on the point at maximum distance from line fit, which is negligible in comparison with the size of the separation bubble. Similarly, for the case of Mach 8.67 (at 1.6MJ/kg in HST-2) with shock impingement at 100mm from the leading edge, the separation was identified at 38mm from the leading edge, considerably downstream of the Mach 5.96 case.
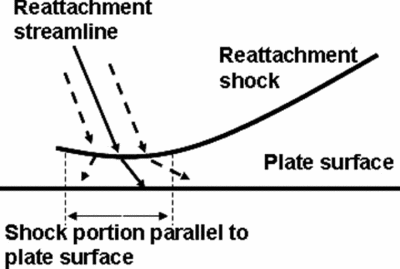
Locating the reattachment from the visualisations is not as simple. It was mentioned that at the reattachment, there is a detached shock running almost parallel to the flat plate surface for a short distance; the reattachment streamline passes through this portion of the reattachment shock, somewhere in the middle, as depicted schematically in Fig. 12. This poses challenges in locating the precise point of reattachment.

Figure 12. Schematic of reattachment.
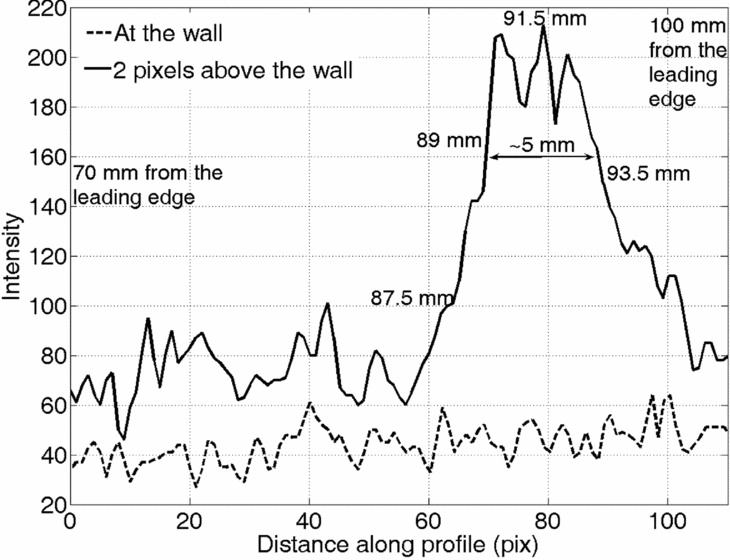
Figure 13 presents the variation of intensities along two horizontal lines for the case of Mach 5.96 with shock impingement at 95mm from the leading edge (i.e. the case shown in Fig. 9): one along the plate surface; the other one two pixels away, resolving the portion of the detached reattachment shock running parallel to the plate. It can be seen that in the horizontal line above the plate surface, high intensities are observed over a distance of 5mm (converting pixels to millimetres). The middle of this portion is taken as the location of reattachment, which is around 91mm from the leading edge, thus with an error of ±2.5mm. It is this particular case that is found to have the maximum extent for the portion of the shock running parallel to the surface. It is considerably shorter for the higher Mach number cases (~3-4mm); even for other cases at Mach 5.96 it is relatively shorter. Considering that for the above case the separation is at 16mm and reattachment at 91mm, the separation length is around 75mm for the steady flow field, for which the error of ±2.5mm is just ±3.33%.

Figure 13. Comparison of intensity variations along the plate and along a parallel line above the plate.
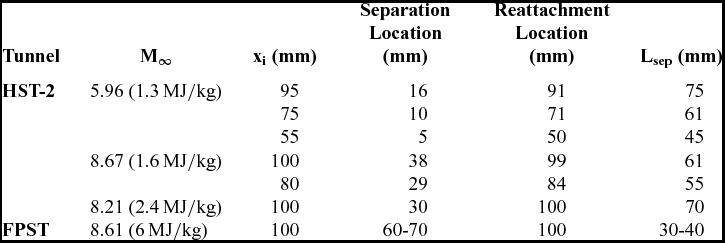
For the same Mach number with the inviscid shock impingement locations of 75mm and 55mm from the leading edge, the separation lengths were similarly estimated to be 60mm and 45mm, respectively, for the steady flow field. For Mach 8.67 at 1.6MJ/kg with the inviscid shock impingement locations of 100mm and 80mm from the leading edge, the separation lengths were estimated to be 60mm and 55mm, respectively. At the higher enthalpy of 2.4MJ/kg (Mach 8.21), the separation length was found to be 70mm with s separation located 30mm from the leading edge. However, at enthalpy of 6MJ/kg simulated in FPST, the separation was located approximately 60mm from the leading edge. In the raw Schlieren image, however, the separation shock is only vaguely seen before interacting with the impinging shock. Thus the separation length is approximately 40mm as inferred from the Schlieren images, while the few pressure signals from the sensor at 70mm reading a relatively low pressure hints that the separation length can be as low as 30mm in those experiments. This inference shall be better qualified by the subsequent discussion on the pattern of surface pressures at various regions of the flow field. The separation and reattachment locations (distances measured from the leading edge) and the separation length for the different cases are listed in Table 2.
Table 2 Separation length

3.3 Surface pressure distribution along the plate surface
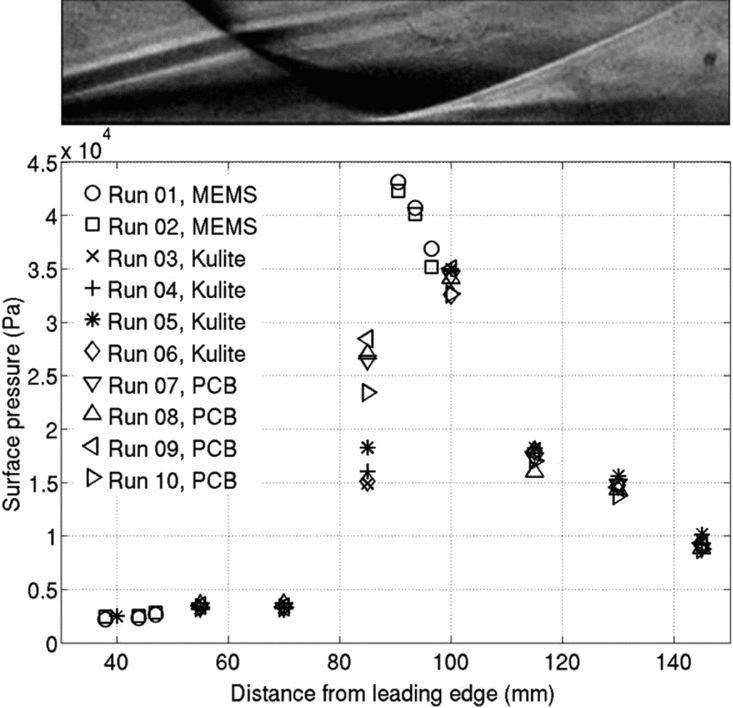
The surface pressures are measured along the centreline of the interaction. Typically, from the onset of the interaction (from the point upstream of separation until which the effect of the interaction is felt) the surface pressure increases, reaches a plateau pressure inside the separation bubble, after which it reaches a peak pressure on reattachment(Reference Delery and Marvin1). The surface pressure distributions during the steady flow time (time averaged from pressure signals after the establishment of steady separated flow field) for the cases of Mach 5.96 with shock impingement at 95mm from the leading edge and of Mach 8.67 (1.6MJ/kg) with shock impingement at 100mm from the leading edge are shown in Fig. 14, also presented in(Reference Sriram and Jagadeesh34) and Fig. 15, respectively.

Figure 14. Surface pressure distribution along the flat plate (M∞ = 5.96, Re∞ = 4 × 10⁶/m, h0 = 1.3MJ/kg, inviscid shock impingement at 95mm from the leading edge)(Reference Sriram and Jagadeesh34).

Figure 15. Surface pressure distribution along the flat plate (M∞ = 8.67, Re∞ = 1.67 × 10⁶/m, h0 = 1.6MJ/kg, inviscid shock impingement at 100mm from the leading edge).
Schlieren images cropped to scale are also juxtaposed above these figures for reference. Good correspondence of surface pressure distributions with the Schlieren images is clearly seen; plateau pressures are significantly greater than the freestream pressure inside the separation bubble, and the peak pressure at reattachment zone can be identified. However, downstream of reattachment, the surface pressure drops due the expansion waves from the rear end of the shock generator. It is noteworthy that the pressure inside the large separation bubble is not strictly a constant, but is found to increase gradually downstream; the reasons for this behaviour cannot, however, be understood from the present investigations. Since the separation in most cases was close to the leading edge, it was not possible to measure the pressure at separation location or upstream for those cases. For the Mach 8.67 case shown above, it was possible to have a MEMS sensor close to the separation location at 38mm from the leading edge, measuring a pressure of around 600Pa at around three times the freestream pressure, which is however substantially lower than the plateau pressure (about 1,200-1,700Pa) downstream. However, in FPST experiments, since the separation bubble was smaller, the PCB sensor at 55mm from the leading edge (well upstream of separation) measured pressures comparable to the freestream pressures. The PCB sensor at 70mm measured pressures in the range of freestream pressures in few experiments, while in few others measured pressures in the range of plateau pressures (around 1,700Pa, or eight times the freestream pressure), as mentioned in the previous section, suggesting the possibility of separation downstream of the sensor at 70mm in few experiments while upstream of the sensor in others. The measured separation length and surface pressures are used to compare and study the role of various parameters on the interaction, which shall be presented after the subsequent discussion on the flow field evolution within the short shock-tunnel run time.
Note on flow regime:
For the Reynolds numbers based on the distance of shock impingement location from leading edge ranging from 3 × 10⁴ to 3.8 × 10⁵ for all the cases, the boundary layer over the flat plate without shock impingement is expected to be laminar(Reference Simeonides35). However, after the separation, the flow can be transitional or turbulent, especially as the separated shear layer travels a good distance.
3.4 Flow evolution
Separation bubbles as large as 75mm for shock impingement at 95mm from the leading edge at Mach 5.96 are observed in the present study. The establishment of such large separation bubbles within the short shock-tunnel run time is a concern that must be addressed first. In order to arrive at a conservative estimate for the time taken for the separated flow to establish, it may thus be assumed that the separation length is the same as the distance of shock impingement from the leading edge. The maximum distance of shock impingement from the leading edge is 100mm in the present study; hence, the time estimated for this case should be the conservative estimate.
For compression corner flows with separation bubbles with lengths one order more than the boundary-layer thickness, Mallinson et al(Reference Mallinson, Gai and Mudford20) investigated the flow establishment in a free-piston shock tunnel with a run time of ~1ms. Recently, the evolution of the flow field over double cone and double wedge configurations in a hypervelocity expansion tube facility of a shorter test time of around 300μs was studied by Swantek and Austin(Reference Swantek and Austin21). While the tunnel run times are of the same order in the present study, unlike the compression corner/double wedge cases, the location of shock origin on the surface where the interaction occurs is not fixed during the evolution. As the impinging shock evolves, it starts impinging from a downstream location, subsequently propagating upstream towards its position during the steady flow time. The flow starts to separate after the start of the establishment of the inviscid flow field as well as the boundary layer. The establishment of the inviscid flow field may directly be ascertained from the pitot pressure signal. It may be recalled that the pitot takes 500-600μs (called rise time) to reach a steady value in HST-2, while in FPST it takes 300-400μs (the time scales may be read from the furnished pitot signals in the previous section). This must also be the time taken for the impinging shock to evolve. Along with the inviscid flow, the viscous boundary layer starts developing. The time Δtfp, taken for the establishment of steady (attached) boundary layer over a flat plate of length L at freestream velocity U∞ is given by Davies and Bernstein(Reference Davies and Bernstein36) as:
Accordingly, for a flat plate with a length of 190mm, it takes ~420μs in the Mach 5.96 flow condition for the steady boundary layer to establish (Table 1). For the Mach 8.67 flow in HST-2, it is ~350μs – as expected, faster than at Mach 5.96 due to the higher flow velocity. In FPST, since the freestream velocity is very high (~3300m/s), Δtfp is only ~200μs. In any case, it is clear that the evolution of the boundary layer falls within the pitot rise time.
Over and above the time taken for the establishment of impinging shock (the inviscid flow) and the attached boundary layer is the time taken for the establishment of the separated flow. It may be assumed conservatively that the establishment of the separated flow starts from the location of the shock impingement after the establishment of a steady impinging shock, though it must be admitted that the separation starts even before. The point of separation traverses upstream until it reaches its location when the whole flow field is steady. For a compression corner flow, Holden(Reference Holden19) suggested that the time Δtsep required for the establishment of a steady separated flow can be estimated by assuming the propagation of acoustic disturbance outwards from the corner after the establishment of the steady boundary layer. Accordingly, Δtsep for a separation length of Lsep is given as:
where aδ is the mean speed of sound in the boundary layer evaluated using an intermediate reference temperature T* given by Eckeret(Reference Eckert37). Considering that the compression ramp is only the source of the shock, a similar estimation can also be made of the impinging shock interaction by assuming that the acoustic wave propagates upstream from the location of impingement. By assuming adiabatic wall temperature (the highest temperature that the wall can reach; used for estimating T*), it is estimated that for a separation length of 100mm, the time taken for the establishment of separated flow for Mach 5.96 flow conditions is ~175μs after the establishment of boundary layer and impinging shock, i.e. after pitot rise time; for Mach 8.67 flow conditions it is ~150μs, and for the conditions in FPST it is only ~90μs. Thus, based on these estimates, it is expected that within the test time of the shock tunnel, a steady separation bubble is established. However, it seems that the separated flow is established considerably later than the predictions in the experiments for the cases at Mach 5.96, though within the test time.
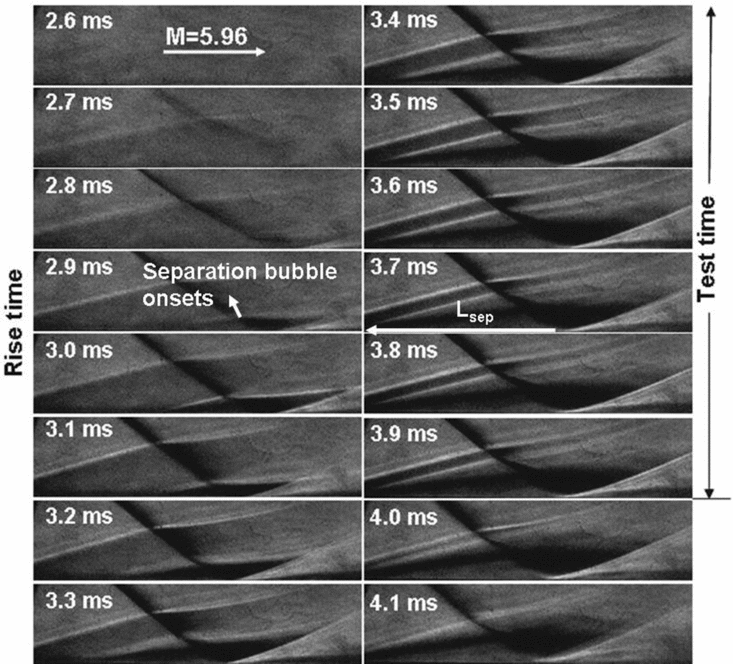
Figure 16 shows the evolution of the flow field (in HST-2) at Mach 5.96 with an inviscid shock impingement location of 95mm from the leading edge. The time-resolved Schlieren images acquired at intervals of 100μs between the frames showing the evolution from 2.6ms to 4.1ms are cropped from 20mm from the leading edge to 130mm from the leading edge, and from the bottom of the plate to 30mm above the bottom of the plate.

Figure 16. Evolution of flow field with impinging shock wave at Mach 5.96 (Re∞ = 4 × 10⁶/m, h0 = 1.3MJ/kg, with inviscid shock impingement at 95mm from the leading edge).
The time frame noted in each image may be compared with the pitot signal (the rise and test times of pitot are nearly the same for all freestream conditions in HST-2). The flow starts at 2.7ms, after which the pitot rises until 3.3ms; after that, the pitot pressure remains steady until 3.9ms. It is apparent that the flow starts to separate at around 2.8-2.9ms, some 200μs after the flow starts, when the boundary layer is sufficiently thick and the impinging shock is sufficiently strong. After the 3ms frame, the separation and reattachment shocks move upstream. Though the reattachment location is nearly established by the start of the test time at 3.4-3.5ms, the separation shock may still be seen propagating upstream (although not as rapidly as during the rise time) until 3.7ms, some 300-400μs into the test time; it remains steady for the last three frames from 3.7 to 3.9ms during the test time. It may be recalled that the theoretical estimations from Equation (2) predicted an establishment time of ~175μs (even if it is taken after the pitot rise time) for the separation bubble of ~100mm length at Mach 5.96. However, the establishment in the experiments seems to be approximately 125μs later that the predictions. Thus, although the pitot remains steady for 600μs, the steady flow field with impinging shock seems established over the entire domain only for the last 300μs of the test time. At 4ms, the flow terminates, with the separation shock eventually merging with the leading-edge shock at 4.1ms.
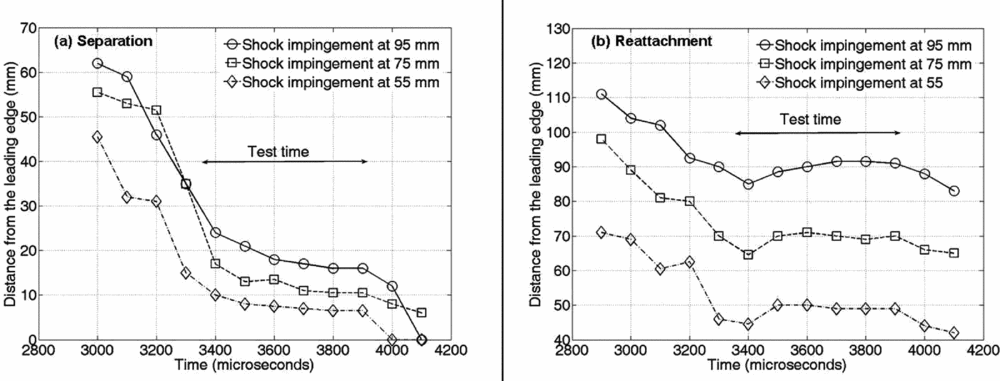
Figure 17 shows a comparison of the progress of separation and reattachment locations with time for the cases of different shock impingement locations at Mach 5.96. These locations are found based on the procedures detailed in Section 3.2 as the separation bubble is just forming. In all the cases, the separation length is steady only over the last three frames, with the separation location reaching a steady value only after 3,600μs. It is interesting to note that in all the cases, the reattachment location reaches a location around 5mm upstream of the steady location at around 3,400μs, after which it moves back. The steady reattachment location is reached at about 3,500μs, though there are one- or two-millimetre differences in the location between the frames. This behaviour can also be seen reflected in the pressure signals. The sensors well inside the separation bubble and those downstream of the reattachment location (which can be identified from visualisations) show a steady pressure signal from the very beginning of the test time; the higher pressure is sensed by the sensors even before, as the shock propagates over them. At points well upstream near the steady separation location yet within the separation bubble during the test time, the pressure reaches the steady value only by the middle of test time. Figure 18 shows the comparison of pressure signals at 40mm from the leading edge, with and without the impinging shock of an inviscid location 95mm at Mach 5.96.

Figure 17. Evolution of separation and reattachment locations on the plate surface for the cases of different shock impingement locations at Mach 5.96 in HST-2.

Figure 18. Comparison of Kulite signals with and without impinging shock at 40mm from the leading edge (for M∞ = 5.96, Re∞ = 4 × 10⁶/m, h0 = 1.3MJ/kg).
It may be observed that during the first part of evolution (the rise time) from around 2,700μs to 3,300μs, the signals are nearly the same. After that, the signal for the case without impinging shock reaches a steady value of around 1,600Pa, which is around 1.25 times the freestream pressure. However, the signal for the case with impinging shock continues to increase towards a higher steady pressure value, comparable to the measurements in other sensors well inside the separation bubble – the plateau pressure, which it reaches only somewhere by the middle of the test time at around 3,700μs. A similar trend was also observed with the MEMS sensor placed at 38mm from the leading edge.
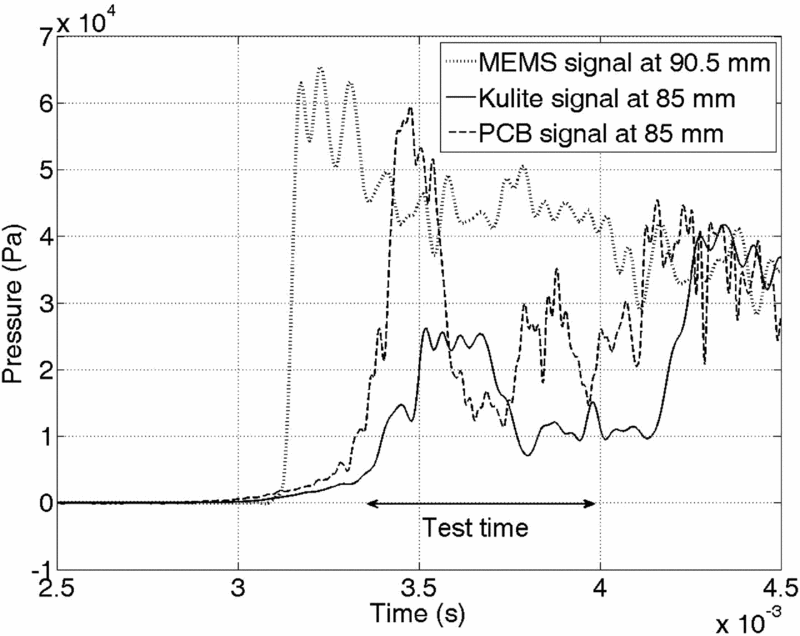
The signals in the reattachment region are even more interesting. With the reattachment shock reaching a upstream point 85mm from the leading edge at 3,400μs for the case of shock impingement at 95mm, the signals measured at 85mm for different experiments using Kulite and PCB sensors show highly unsteady pressure as shown in Fig. 19. This can be contrasted with the pressure signal at 90.5mm around the steady reattachment location, which is steady throughout the test time. The differences in the magnitude of unsteady pressure between the Kulite and PCB sensors could be due to the differences in area of sensing of the two sensors, since the PCB sensor is considerably larger in diameter has more probability of contact with the moving reattachment shock at the location. However, the trend in the unsteadiness is qualitatively similar between the sensors, with high initial pressure for around 200-300μs at the beginning of tunnel test time due to the closeness of the reattachment shock, which subsequently drops as the shock has retreated downstream. Further downstream the signals are qualitatively similar to that at 90.5mm, but with diminishing pressure value.

Figure 19. Comparison of MEMS signal at 90.5mm with Kulite and PCB signals at 85mm (for M∞ = 5.96, Re∞ = 4 × 10⁶/m, h0 = 1.3MJ/kg).
The unsteadiness may be the case of shock oscillations inherent in SBLI as pointed out by Dupont et al(Reference Dupont, Haddad and Debieve11). In recent years, the understanding of the unsteadiness in supersonic turbulent SBLI has significantly advanced by means of advanced flow diagnostics and computations. These advancements reported in the literature are reviewed in detail by Clemens and Narayanaswamy(Reference Clemens and Narayanaswamy38). The current consensus for supersonic turbulent SBLI is that the cause of the unsteadiness when the flow separates is largely the downstream mechanisms from within the interaction itself rather than the upstream turbulent boundary layer, though the turbulent boundary layer can have second-order effects. If this is the case, the unsteadiness is expected of laminar/transitional SBLI such as those near the leading edge as well. The unsteadiness observed in the present work may be compared and contrasted with those reported in the literature in terms of the differences in length and time scales.
Firstly, and yet without losing generality by not distinguishing hypersonic flows from supersonic flows, it is readily seen that the relevant scale for separation length in the reports on unsteady (turbulent) SBLI is the boundary-layer thickness, whereas in the present study the boundary-layer thickness is negligibly small compared to the separation length. Secondly, the reported Strouhal numbers defined based on the separation length (and the incoming stream velocity) are typically very low (~0.01). In the present case, however, the shock motion within the limited test time of pitot is rather short in length when compared with separation length and of apparently higher frequency than those reported in the literature. There is just a cycle of a forward, backward and again forward motion of the reattachment shock as evidenced in Fig. 18. This is also substantiated by the pressure signals at 85mm as seen in Fig. 20. Thus, a cycle has a time period of the order of roughly 500μs, and correspondingly the Strouhal number is estimated (based on separation length of ~0.1m) to be ~0.1, an order more than that reported for turbulent supersonic SBLI. Although no experimental studies concerning unsteadiness in laminar/turbulent SBLI are reported, finite element computations of two-dimensional impinging shock-induced separation at low laminar Reynolds numbers at Mach 2 by Loth and Matthys(Reference Loth and Matthys39) resulted in a very high Strouhal number of 1.3.

Figure 20. Pressure signal at 70mm from the leading edge, well inside the separation bubble (for M∞ = 5.96, Re∞ = 4 × 10⁶/m, h0 = 1.3MJ/kg).
Despite the higher value of the estimated Strouhal number, the frequency of the shock oscillations (if present) is still much lower for the short shock-tunnel run time. This could be due to the short run time that only one cycle is observed, apparent as unsteadiness without repetitive pattern. Thus, with this observed unsteady pattern within the short run time (with only one possible cycle), it is not possible to ascertain the presence and nature of any oscillatory behaviour from the present study. Other studies on unsteady SBLI report oscillatory pressure signals inside the separation bubble. However, well within the separation bubble, the pressure signal is steady throughout the pitot test time as shown in Fig. 20, even as the signals near separation and re-attachment location are not steady for part or all of the test time. The peak pressure near the reattachment (the MEMS signal in Fig. 19) and the pressures further downstream were also found to be statistically steady; the small amplitude fluctuations cannot be distinguished from the signal noise as also seen in pitot signals, and hence the study does not address these fluctuations.
The speculations regarding unsteadiness in the present cases is further disputed by the fact that no such unsteadiness was observed in all the higher Mach number cases in both HST-2 and FPST, though it is nevertheless expected theoretically that the flow establishment is quicker for the higher Mach number case. The flow seems to have evolved for the higher Mach number cases, with the separation and reattachment reaching a steady location at the beginning of the test time itself, and no unsteadiness was observed in pressure measurements as well during the tunnel test time. This was the case even in FPST with short run time of 300μs. From the present investigations it is not however possible to reason out the observed unsteadiness at Mach 5.96 as well as the lack of such unsteadiness at the nominal Mach number of 8.5. Hence, the subsequent discussions are limited to the evolved flow fields that shall be compared for different flow parameters.
4.0 PARAMETRIC STUDIES AND DISCUSSIONS
4.1 Effect of freestream Mach number
It may be recalled that, while the separation bubble is 75mm at Mach 5.96 with inviscid shock impingement at 95mm from the leading edge, for nearly the same location of impingement at 100mm from the leading edge, the separation length was only 60mm at Mach 8.67 while the enthalpies are also not very different. The significant decrease in separation length with Mach number is known to be due to the decrease in upstream influence in the boundary layer. However, in the present case, this happens despite the fact that the impinging shock is doubly strong in terms of pressure ratio across the impinging shock at the higher nominal Mach number. A comparison of surface pressure distribution normalised by freestream pressure for the two cases is shown in Fig. 21, where it is seen that the pressures at the re-attachment zone as well as the pressure inside the separation bubble at Mach 8.67 are more than twice the values at Mach 5.96. Thus, the relatively smaller increase in Mach number from 5.96 to 8.67 is found to be accompanied by a significant drop in separation length despite the twofold increase in normalised peak pressure (and accordingly, imposed adverse pressure by the shock), emphasising the greater influence of Mach number compared to the shock strength on the interaction.

Figure 21. Comparison of normalised surface pressure distribution for Mach numbers 5.96 and 8.67 (inviscid shock impingement locations at 95mm and 100mm, respectively).
4.2 Effect of shock impingement location
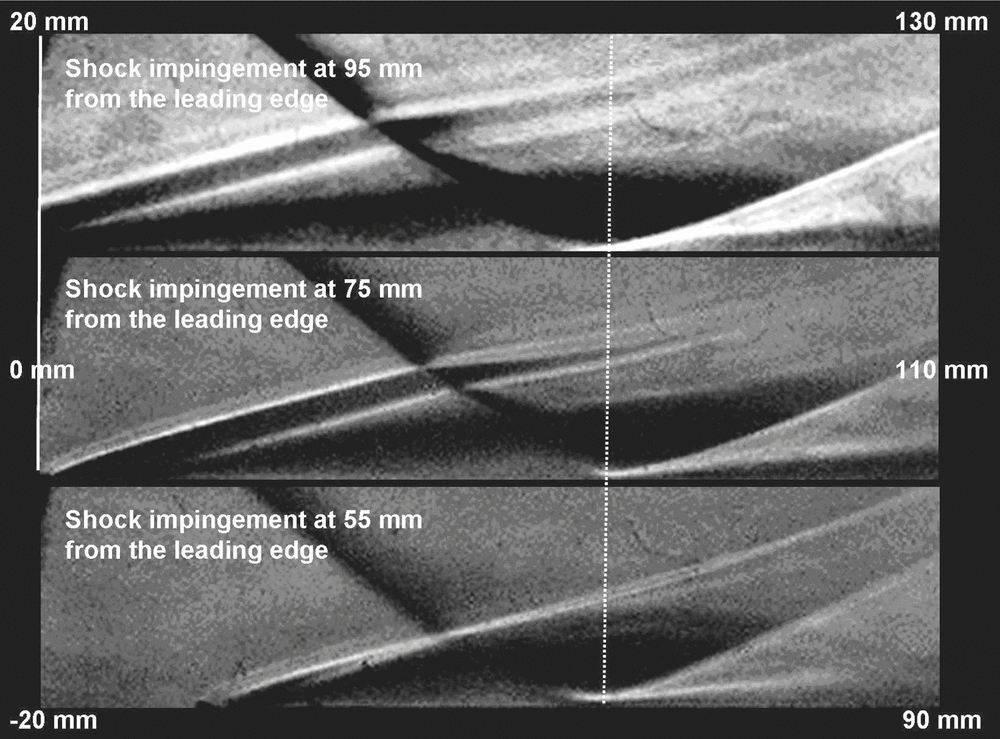
Since the separation occurs close to the leading edge, especially for the cases at Mach 5.96, the effect of the closeness of shock impingement to the leading edge is interesting. For a given Mach number and for shock impingement locations closer to the leading edge, the local Reynolds number based on the shock impingement location is lower; due to higher skin friction, the boundary layer tends to be more resistant. This makes it interesting to reflect on the extent to which the separation location is closer to the leading edge for a given shock impingement location. Figure 22 shows a comparison of Schlieren images with different shock impingement locations at Mach 5.96. The images are arranged such that the position of the impinging shock is the same for all cases. Correspondingly, the distances from the leading edge of the left and right ends of each image are also indicated in the figure, while in the vertical direction, each image displays from the plate surface to a distance of 30mm above the plate surface.

Figure 22. Comparison of the Schlieren images at Mach 5.96, arranged with the positions fixed relative to the impinging shock (Re∞ = 4 × 10⁶/m, h0 = 1.3MJ/kg).
It is evident that relative to the impinging shock, the position of reattachment remains the same in all the cases; that is, for a shift in shock impingement by 20mm upstream, the reattachment location also shifts 20mm upstream. The separation shock in all cases emanates from very close to the leading edge. As the impinging shock gets closer to the leading edge, the separation shock also moves a little closer to the leading edge (the separations are located at 16mm, 10mm and 5mm from the leading edge, respectively, for inviscid shock impingements at 95mm, 75mm and 55mm). Interestingly, if the separation length is normalised by the shock impingement location, the scaled separation lengths are nearly the same for all the cases (around 0.8, with a maximum difference of just 3% between the cases of impingement at 95mm and 55mm); the reattachment pressure was also nearly the same for all cases. It must be recognised that the imposed adverse pressure on shock reflection, which is comparable to the reattachment pressure, is an order higher than the incipient separation pressures calculated from free interaction theory(Reference Chapman, Kuhen and Larson33) for all the cases. That is, the shock is extremely strong for the skin friction at impingement to withstand, and hence the viscosity becomes irrelevant.
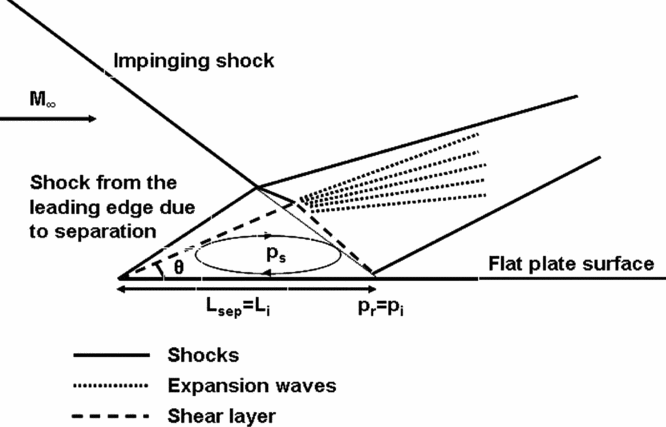
This inspires the proposal of an approximate inviscid picture for the interaction for similar cases with strong impinging shocks and with separation close to the leading edge, as sketched in Fig. 23. According to the model, the separation may be approximated as happening at the leading edge, with an angle θ to the freestream; separation length may be approximated as the distance of inviscid shock impingement Li and the reattachment (peak) pressure may be approximated as the pressure at the location of shock reflection for the inviscid case, since the reattachment pressures are of the same order in all experiments with the same freestream conditions. From these assumptions, θ and thus the plateau pressure ps may be estimated such that the turning of the separated shear layer to the surface by the expansion fan occurs in such a way as to maintain the pressure equal to plateau pressure downstream of the expansion, since the outer pressure is imposed on the shear layer. Though estimations are not made from the proposed model due to complications arising from the curving of impinging shock interaction with expansion waves from the rear end of the wedge, one can sense qualitatively that the pressure inside the separation bubble supposedly increases as the location of shock impingement moves closer to the leading edge. This is because, in order for the separated shear layer to reattach with the same pressure pi (= pr), for a shorter Li (= Lsep), the shear layer should separate at a higher angle θ to the freestream for the shear layer to travel longer distance towards reattachment so as to gain more momentum.

Figure 23. Schematic of the inviscid model with separation occurring at the leading edge (close to the leading edge as in Mach 5.96 experiments).
In the present cases, it is observed that the angle of the separation shock was 15.5° with shock impingement at 95mm, while the angle was 19.5° for shock impingement at 55mm (angles can be obtained from Schlieren, from the locus of peak intensities along separation shock, as detailed in section 3.2). It must also be admitted that beyond a certain separation angle, the interaction between the separation shock and impinging shock may be a Mach reflection rather than regular reflection. The ranges of imposed pressure jumps, locations of shock impingement and other freestream parameters at which the model may be valid is not established from the present study; the model may thus be taken as a simple qualitative depiction of the observed flow behaviour at Mach 5.96 in the present experiments. At Mach 8.67, however, the separation was significantly downstream of reattachment. Nevertheless, the trend of increase in pressure inside the separation bubble as the shock impingement location moved closer to the leading edge was observed at Mach 8.67 as well. Higher pressures were observed inside separation bubble by nearly 35%, on average, with shock impingement at 80mm from the leading edge compared to the case with shock impingement at 100mm.
4.3 Effect of flow total enthalpy
Experiments are performed at a nominal Mach number of 8.5, at three different enthalpies: 1.6MJ/kg and 2.6MJ/kg in HST-2 and at 6MJ/kg in FPST. It must be noted from Table 1 that there is a slight difference in Mach numbers between the cases and the Reynolds number reduces with increase in enthalpy. The lower Reynolds numbers and higher viscosities due to higher temperatures inside the boundary layer tend to increase skin friction as the total enthalpy increases. However, with incipient separation pressure being negligibly smaller in comparison with impinging shock strength, the skin friction is not expected to affect the large separation bubble, as discussed in Section 4.2. The effect of enthalpy on upstream influence must rather be counted. The distributions of surface pressures normalised by freestream pressures are compared for the three cases in Fig. 24. It is seen that the normalised peak pressure is significantly lower at 6MJ/kg despite nearly the same Mach number as other cases (hence expectedly same shock strength).

Figure 24. Comparison of normalised surface pressure distributions at different enthalpies (inviscid shock impingement at 100mm from the leading edge).
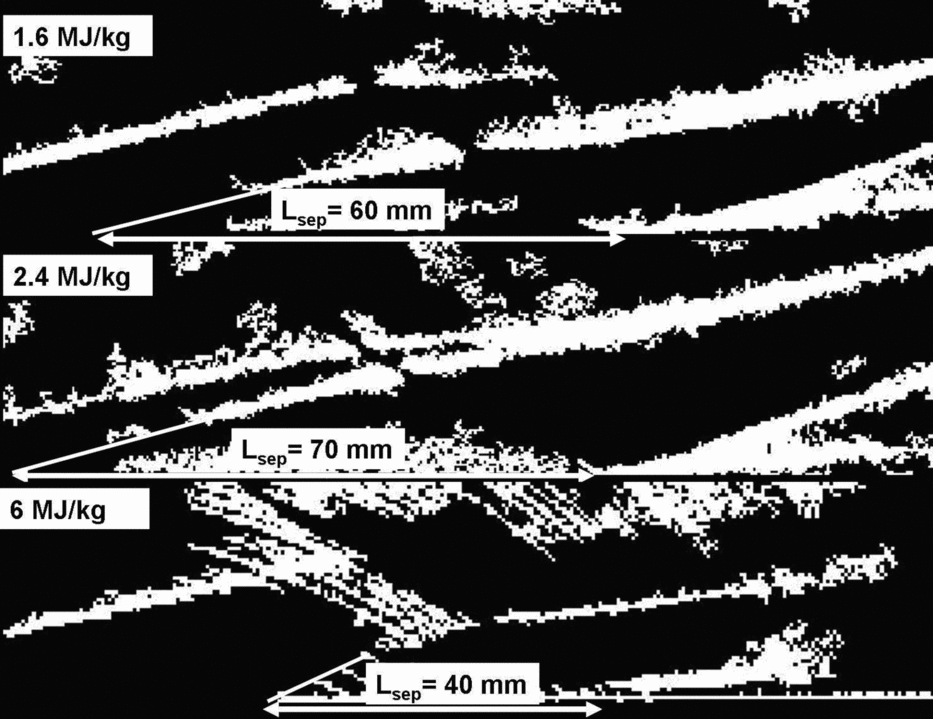
Though the normalised reattachment pressure is nearly the same for the 1.6MJ/kg and 2.4MJ/kg, the separation length was found to considerably be higher at 2.4MJ/kg (70mm) than at 1.6MJ/kg (60mm). It may be recalled that the separation bubble was significantly smaller at 6MJ/kg. However, the separation shock was not very clear from the raw Schlieren image at FPST due perhaps to low density values at a high enthalpy of 6MJ/kg. By processing the raw images, binary images may be obtained; the regions in the normalised greyscale image whose intensity is beyond a threshold are displayed in white, while the other regions are completely black. The binary images of the flow field are compared in Fig. 25, where it is possible to identify (for the 6MJ/kg case) the separation shock for a considerable distance before it interacts with the impinging shock. The extension of this to the plate surface locates the separation at approximately 60mm from the leading edge for the 6MJ/kg case.

Figure 25. Comparison of Schlieren (binary) images at various enthalpies, indicating length scales of the separation bubble.
Thus an inflectional trend is observed in separation length with the increase in enthalpy. While it increases from 60mm to 70mm as enthalpy increases from 1.6MJ/kg to 2.4MJ/kg, it drastically drops to ~3-40mm at 6MJ/kg (~30mm due to the recording of low pressure by the sensor at 70mm in few experiments). Concerning the larger separation length at 2.4MJ/kg, while the normalised reattachment pressure is nearly the same as that at 1.6MJ/kg, the Mach number is a little lower at 8.21. Experimental correlations for hypersonic double wedge flows suggest that the separation length is inversely proportional to the cube of Mach number (when other things are maintained the same)(Reference Davis and Sturtevant23). The ratio of the cube of Mach numbers 8.21 and 8.67 is same as the inverse of the ratios of respective separation length (both the values are around 0.85). This suggests that the increase in separation length must be due to the strong dependence on Mach number, and that the total enthalpy variation does not have a significant role in the range of 1.3MJ/kg to 2.4MJ/kg; the specific heat ratio is not expected to vary much within this range in which real gas effects are not prominent. However, at 6MJ/kg, the real gas effects due to the possible dissociations and chemical reactions in the flowing gas play a prominent role that significantly alters fluid and flow properties, including the specific heat ratio. It may be recalled the flow field is characterised by intense emissions. Although the identification of different species from the emissions is experimentally complex (requiring spectroscopy, which is not pursued in the present study), earlier literature can offer some insights. Kulkarni(Reference Kulkarni40), based on simulations using the commercial software CHEMKIN, noted that even at total enthalpy of about 4.5MJ/kg, about 13% of air was dissociated (8.8% NO, 4.1% O and small traces of N) at stagnation conditions. At a relatively lower enthalpy of 3.8MJ/kg, nearly 7% dissociation was reported by Ibrahim et al(Reference Mohammed Ibrahim, Sriram and Reddy41) with carbon dioxide as the test gas. The enthalpy in the present case is higher, and hence the dissociation is high as expected, particularly for nitrogen. The dissociated gas considerably alters the fluid and flow properties. The numerical simulations by Furmoto et al(Reference Furumoto, Zhong and Skiba42) also showed that, for the same high-enthalpy condition, the simulations with the inclusion of real gas effects reduced the size of the separation bubble and surface heating rates compared to the perfect gas simulations. Thus, the real gas effects seem to reduce the separation length as well as the peak pressure. It is quite possible that, for the freestream conditions, separation location and separation bubble sizes at 6MJ/kg, viscous effects may become prominent and the separation bubble may not also be considered large. However, the present study does not address the mechanisms responsible for the observed behaviour at the higher enthalpy. Further studies are required to understand the phenomena better.
5.0 CONCLUSIONS
Hypersonic impinging shock wave boundary-layer interactions on a flat plate, accompanied by large separation bubbles of length comparable to the distance of shock impingement from the leading edge, were experimentally investigated in short duration test facilities. Experiments are performed in IISc hypersonic shock tunnels HST-2 and FPST at nominal Mach numbers of 6 and 8.5, with freestream total enthalpies ranging from 1.3MJ/kg to 6MJ/kg and Reynolds numbers ranging from 0.3 × 10⁶m to 4 × 10⁶m, within short test durations of a few hundred microseconds. The strong impinging shock which creates the large separation bubble on a flat plate is generated by a wedge with an angle of 30.96° to the freestream. From the time-resolved Schlieren visualisations using a high-speed camera and from surface pressure measurements using fast response sensors, the morphology and evolution of the flow field with a large separation bubble was analysed. The following are the conclusions of the investigation.
• A statistically steady flow field was found to be established during the tunnel test time even with a separation bubble as large as 75mm. While the steady flow was established by the beginning of the test time for cases with the higher nominal Mach number of 8.5, for the cases at the nominal Mach number of 6, it was only by the middle of the test time that the flow was steady.
• The separation length was generally found to scale with the distance of the inviscid shock impingement location from the leading edge.
• Due to strong impinging shock, the separation bubble was found to be skewed upstream. The streamwise distance from the separation to the location of shock impingement on the shear layer is significantly greater than that from the location of shock impingement on the shear layer to the reattachment.
• With the strong impinging shocks imposing pressures one order higher than the incipient separation pressure, skin friction is found to play a little role on the morphology of the large separation bubble.
• As a special case at a nominal Mach number of 6, the separation location was very close to the leading edge for all considered shock impingement locations. This lead to the proposal of a simplified inviscid picture of the flow field by assuming the separation occurs at the leading edge itself and reattachment to occur at the impingement location, attaining the pressure after inviscid shock reflection at reattachment.
• The separation length was significantly affected by freestream Mach number than the shock strength. For nearly same shock impingement locations (~100mm), the separation length was only 60mm at Mach 8.67, while it was 75 at Mach 5.96, despite that fact that the shock was doubly strong at Mach 8.67.
• Inflectional trend in separation length was observed with increase in total enthalpy. At a nominal Mach number of 8.5, the separation length increased from 60 to 70mm as the total enthalpy increased from 1.6MJ/kg (Mach 8.67) to 2.4MJ/kg (Mach 8.21); at 6MJ/kg (Mach 8.61) it drastically dropped to around 30-40mm with a significant drop in reattachment pressure as well. While in the moderate enthalpy range the increase in separation length was due to the small differences in Mach number, the drop in peak pressure and separation length at 6MJ/kg are attributed to real gas effects.
ACKNOWLEDGEMENTS
The authors are thankful to the members and collaborators of the Laboratory for Hypersonic and Shockwave Research (LHSR), Indian Institute of Science, Bangalore, India for their support and encouragement. The financial support by the Defence Research and Development Organization (DRDO) of India for the research in LHSR is gratefully acknowledged.


