

Introduction
The accurate estimation of expected survival time for terminally ill cancer patients who are admitted to hospice is important for both patients and their families, as it allows them time to prepare and provides medical staff with treatment options suitable for the patient's life expectancy (Kim et al., Reference Kim, Youn and Ko2014; Lee et al., Reference Lee, Ahn and Go2015). The Palliative Performance Scale Version 2 (PPSv2) is a modified version of the Karrnofsky performance scale and an important factor in predicting the survival of hospice patients (Anderson et al., Reference Anderson, Downing and Hill1996). The palliative performance scale (PPS) consists of five components: ambulation, activity and evidence of disease, self-care, intake, and level of consciousness. Patients are divided into 10% intervals to 100%, with 0% representing death.
Several studies have examined whether PPS is meaningful as a categorical or discrete variable in prognostic predictions (Lau et al., Reference Lau, Downing and Lesperance2009a; Downing et al., Reference Downing, Lesperance and Lau2010; Chan et al., Reference Chan, Wu and Chan2013; Harris et al., Reference Harris, Stalam and Ache2014). In previous studies, the PPS was primarily evaluated only at early stages, while changes in the PPS were often not analyzed. In addition, as a retrospective analysis, PPS evaluation based on admission records and medical data was difficult to observe as an accurate evaluation, and whether changes occurred in PPS could not be confirmed (Lau et al., Reference Lau, Downing and Lesperance2009a; Jansen et al., Reference Jansen, Buma and Gootjes2015).
In a study attempting to predict the survival period through changes in PPS, Chan et al. (Reference Chan, Wu and Chan2013) confirmed a strong association between the magnitude of change in PPS score during the disease trajectory and patient survival. However, this study cannot be generalized to other study population with different disease status and ethnicity.
The purpose of this retrospective study was to examine whether the PPS affects survival time in hospice patients in Korea. Over 2 years, 315 patients were evaluated by physicians and nurses based on hospice entry points and weekly PPS. From this, we analyzed the significance of PPS scores in group A (PPS ≥50%) and how changes in PPS after the first and second weeks affected survival in patients who survived for ≥2 weeks.
Methods
Patients
We retrospectively examined 315 patients who were admitted to the hospice center of Bucheon St. Mary's Hospital between January 1, 2017 and December 31, 2018. We examined baseline characteristics of these patients who were classified according to age (<60, ≥60), sex (male, female), PPS score upon admission, and primary diagnosis (gastrointestinal, hepatobiliary–pancreatic, thoracic, central nervous system, skin, gynecologic, sarcoma, urologic, breast, hematologic, head & neck, and other cancers). The PPS score was checked and recorded upon admission and at weekly meetings of the clinical care team. Patients were classified to PPS ≥50% (group A) or ≤40% (group B). The length of survival (LOS) was the time interval between the day of admission to hospice and the day of the patient's death.
Statistical methods
We performed survival analysis for factors associated with the LOS in group A. Using Cox proportional-hazards regression, we analyzed the association between LOS and baseline demographics (age, sex, and primary diagnosis), and PPS in group A patients. Factors showing significant association with LOS by univariate analysis were subsequently evaluated by multivariate analysis. Based on the hospice team's weekly evaluation of PPS, we examined the effect of initial scores and changes in PPS scores on prognosis in group A patients who survived more than two weeks. Baseline demographics, initial status of PPS, and changes in PPS 1 and 2 weeks from admission were evaluated by univariate and multivariate analyses using the SPSS 20.0 software package (IBM Corp., Armonk, NY, USA).
Results
Baseline characteristics of patients
The median age of hospice patients was 67 (range: 28–97 years). Baseline demographics of patients treated at our hospice center are shown in Table 1; 218 (69.2%) patients were ≥60 years old and 158 (50.2%) patients were male. The number of patients with PPS 50% was 159 (50.5%), followed by PPS 60% (92; 29.2%), PPS 40% (49; 15.6%), and PPS 70% (13; 4.1%). The most common primary tumor site in patients was gastrointestinal in 80 (25.4%), hepatobiliary–pancreatic in 77 (24.4%), and thoracic 44 (14.0%).
Table 1. Baseline patient characteristics (N = 315)
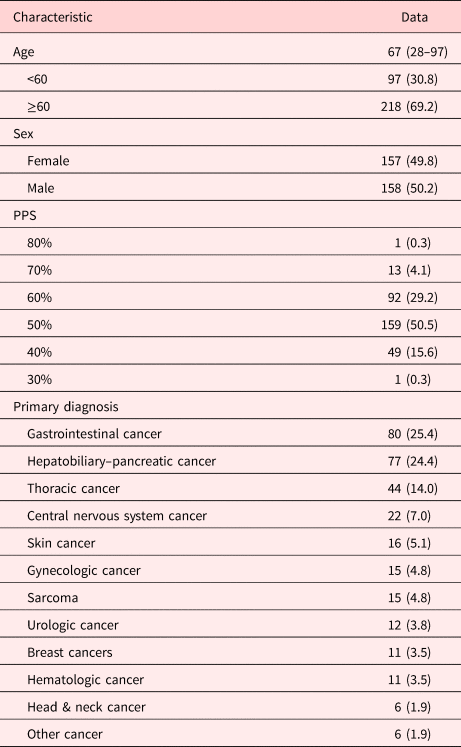
Values are presented as median (range) or number (%).
LOS and transition time of PPS
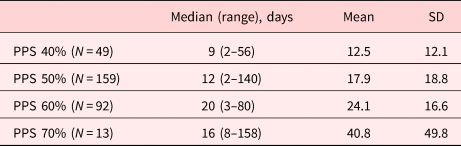
The median LOS for PPS 40%, 50%, 60%, and 70% was 9, 12, 20, and 16 days, respectively. The mean LOS increased as the PPS increased from 40% to 70% (Table 2). The median LOS of group A was 15 (range: 2–158 days), and the median time interval from PPS ≥50% to ≤40% was 11 (range: 2–139 days). The median LOS after transition from group A to group B was 4 (range: 1–49 days), and the median LOS of B group was 9 (range: 2–43 days). The median LOS after changing to PPS 30% or less was two days in both groups A and B (Table 3).
Table 2. LOS by PPS (%) in hospice

PPS, palliative performance scale.
Table 3. LOS according to the PPS in groups A and B in hospice
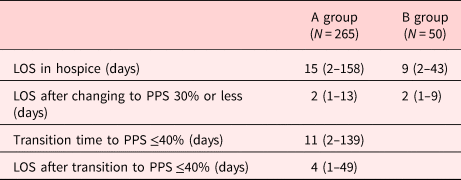
Values are presented as median (range).
Group A, PPS ≥50%; group B, PPS ≤40%.
PPS, palliative performance scale.
Factors associated with the LOS in hospice (group A)
In univariate analysis, factors associated with the LOS in group A included age (p = 0.093), sex (p = 0.017), gastrointestinal cancer (p = 0.039), gynecologic cancer (p = 0.089), and PPS 50% vs. 70–80% (p = 0.012) (Supplementary Table 1). In multivariate analysis, factors significantly associated with the LOS included sex (p < 0.001), gastrointestinal cancer (p = 0.042), and PPS 50% vs. 70–80% (p = 0.006; Table 4).
Table 4. Factors associated with the LOS in group A by multivariate analysis
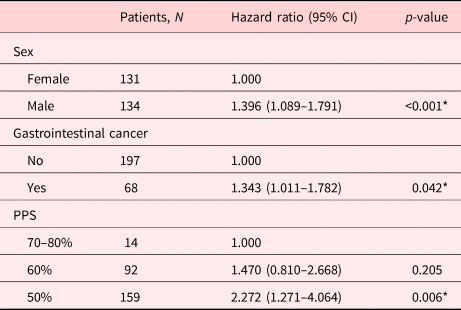
PPS, palliative performance scale.
* p-value < 0.05.
Factors associated with the LOS in hospice (group A who survived more than 2 weeks)
In univariate analysis, factors associated with the LOS in group A in those with a good prognosis (survival ≥ 2 weeks) included sex (p = 0.009), gastrointestinal cancer (p = 0.069), breast cancer (p = 0.046), PPS change after 1 week (p < 0.001), and PPS change after 2 weeks (p < 0.001; Supplementary Table 2). In multivariate analysis, factors significantly associated with the LOS included sex (p = 0.006), gastrointestinal cancer (p = 0.013), PPS change after 1 week (p < 0.001), and PPS change after 2 weeks (p < 0.001; Table 5).
Table 5. Factors associated with the LOS in group A who survived ≥2 weeks by multivariate analysis
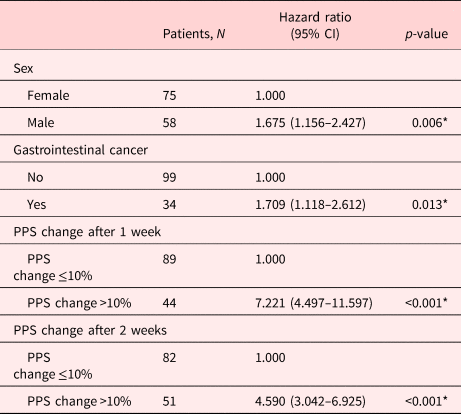
PPS, palliative performance scale.
* p-value <0.05.
Discussion
In this study, we retrospectively examined 315 patients who were admitted to single hospice center between 2017 and 2018. We divided patients into two groups based on their PPS scores, group A (PPS ≥50%) and group B (PPS ≤40%). We analyzed factors affecting the LOS in group A, because the prediction of survival is important for group A patients in the hospice ward. As the patients in group B have shorter survival than those in group A, the survival analysis of group B was not presented.
The median LOS of A and B groups was 15 and 9 days, respectively. Male, gastrointestinal cancer, and lower PPS scores (50% vs. 70–80%) were significant factors in group A. Particularly in group A, for patients who survived ≥2 weeks, male, gastrointestinal cancer, PPS change after 1 week, and PPS change after 2 weeks were all significant factors by multivariate analysis.
There are many studies in which initial PPS is an important factor affecting the LOS.
Weng et al. (Reference Weng, Huang and Wilkie2009) investigated the relationship between the PPS and the LOS in a retrospective analysis of African American and Hispanic minority cancer patients from 492 home-based hospice and palliative care programs. Patients with 10–30% PPS exhibited a significantly shorter survival period than those with 40% or greater, and authors insisted that PPS 40% should be the standard for studies on survival of ≥2 weeks.
Harrold et al. (Reference Harrold, Rickerson and Carroll2005) conducted a prospective cohort study over 2 years in 466 cancer and noncancerous patients, demonstrating that the PPS score was a strong independent predictor of mortality (log-rank test of Kaplan–Meier survival curves p = 0.001). Six-month mortality rates for three PPS categories were 96% (for PPS scores 10–20), 89% (for PPS scores 30–40), and 81% (for PPS scores 50).
Additionally, a systemic review of 17 studies (nine with only cancer and eight with mixed diagnoses) by Baik et al. (Reference Baik, Russell and Jordan2018) was performed, and in all studies involving cancer patients, the PPS was significantly associated with survival. Survival estimates ranged from one to three days for patients with PPS scores of 10% compared with 5–36 days for those with scores of 30%. However, categorical cut-points of PPS scores for differentiating prognosis are not consistently reported across studies (Downing et al., Reference Downing, Lau and Lesperance2007; Lau et al., Reference Lau, Maida and Downing2009b; Linklater et al., Reference Linklater, Lawton and Fielding2012; Maltoni et al., Reference Maltoni, Scarpi and Pittureri2012; Seow et al., Reference Seow, Barbera and Dudgeon2013; Jang et al., Reference Jang, Caraiscos and Swami2014; Myers et al., Reference Myers, Kim and Flanagan2015; Babcock et al., Reference Babcock, Gould Kuntz and Kowalsky2016; O'Mahony et al., Reference O'Mahony, Nathan and Mohajer2016).
There have been studies evaluating not only initial PPS but also changes in PPS.
Downing et al. (Reference Downing, Lesperance and Lau2010) conducted a retrospective analysis of a VHS cohort comprising 6,066 patients who had undergone palliative treatment for 13 years. This analysis provided evidence that abrupt functional decline was associated with reduced LOS in palliative care unit patients.
Chan et al. (Reference Chan, Wu and Chan2013) conducted a prospective cohort study in 400 terminally ill patients (85% cancer and 15% noncancerous diseases) who were referred to Singapore's tertiary center. PPS “Change on Admission,” “Change at Week 1,” and “Change at Week 2” were all independent predictors of survival. At week 1, compared with “PPS Change ≤10%,” “Change 11–30%” and “Change >30%” increased the hazard ratios by 1.70 (95% CI 1.10–2.63) and 3.14 (95% CI 1.77–5.59), respectively. At week 2, when compared with “PPS Change ≤10%,” “Change 11–30%,” and “Change >30%” increased the hazard ratios by almost three- and eightfold, respectively. Similar to our study results, changes in PPS scores between different time points were shown to be a potentially useful tool in improving survival prediction. However, the findings in this study were based on patients in an acute setting and may not translate to a palliative setting. In our study, change in the PPS was more significant in multivariate analysis than using a single time-point PPS score to predict survival in group A patients who survived ≥2 weeks, supporting the above findings.
Until now, for the studies examining the association between PPS and LOS in cancer patients, the study subjects were heterogeneous across studies, with some studies including only cancer patients and others that were mixed with noncancerous diseases. Furthermore, the disease status of cancer patients was different with respect to an acute vs. palliative care setting. Many studies evaluated initial PPS, and several studies identified an effect in PPS change on the LOS. In one study, similar to our research, the PPS score of each patient was decided by a multidisciplinary palliative team and was recorded upon admission and on a weekly basis until the patient was discharged from the service or death occurred (Mei et al., Reference Mei, Jin and Hwang2013).
In addition to PPS, several factors are known to affect the LOS in patients receiving palliative care.
Mei et al. (Reference Mei, Jin and Hwang2013) conducted a prospective cohort study on factors related to prognosis in 356 admission episodes of advanced cancer patients in tertiary institutions. In this study, baseline PPS scores, together with sex and albumin levels, were found to be independently predictive of survival at 90 days. The baseline PPS scores were divided into A (70–100%), B (40–60%), and C (10–30%), and the risk of death was significantly different among different PPS groups. Male was found to significantly increase the risk of short duration of survival in our study. In a retrospective study of the use of the PPS in end-of-life prognostication in patients within a hospice, male patients were found to have higher hazards than their female counterparts for death (Lau et al., Reference Lau, Downing and Lesperance2006). Gender differences in mortality have been noted previously, with recent evidence that age-adjusted mortality rates for males were higher than for females in a large majority of cancer (Cook et al., Reference Cook, McGlynn and Devesa2011). It is not clear why men have shorter survival times than women in terminal cancer. There is a potential theory that the hormonal status in women offers protection that leads to longer survival compared with their male counterparts (Hendifar et al., Reference Hendifar, Yang and Lenz2009). In addition, the fact that men have relatively more comorbidity burden than women may be the reason for explaining the difference in survival. Laboratory investigations confirmed that elevation of albumin lowered the risk, but there was a limitation that laboratory studies were not performed for all terminally ill patients in consideration of patient status.
Sutradhar et al. (Reference Sutradhar, Seow and Earle2013) identified 71,000 assessments from 11,374 outpatient cancer patients in a population-based, retrospective, cohort study. At every PPS assessment, patients were assigned to one of four states: stable state (PPS score 70–100), transitional state (PPS score 40–60), end-of-life state (PPS score 10–30), or death. The results of this study revealed differences between cancer types. Patients with lung cancer in the transitional state had a 27.7% chance of death at the end of 1 month vs. 17.5% in patients with breast cancer. The average time spent in the transitional state was 6.6 weeks for patients diagnosed with gastrointestinal cancer vs. 8.8 weeks for patients with breast cancer. In our study, gastrointestinal cancer was identified as a poor prognostic factor in PPS group A. Gastrointestinal cancer patients admitted to hospice seem to have a poorer prognosis compared with other cancers due to poor nutrition.
This study has several limitations. First, the design of study was retrospective, so the selection bias could influence on the results related to the fact that the subjects were in terminal status and all dead. Second, the subjects were terminal cancer patients admitted to the single hospice unit. So, the result of the study could not be generalized to whole population of the country, especially it did not include the outpatient with receiving home hospice care.
Nevertheless, in this study, it was confirmed that changes in PPS may have an effect on the prognosis of terminal cancer patients admitted to the Korean hospice ward. In the future, it is expected that more prospective and detailed studies including the patients of various institutions and subjects.
The use of initial PPS evaluation alone may not be informative because each patient has a very heterogeneous state of entry, and a single measurement does not precisely reflect the disease progression process. Our research demonstrated that male, gastrointestinal cancer, and PPS change at 1 week and at 2 weeks were all significant factors in group A patients who survived ≥2 weeks. The change of PPS may be an important factor in predicting the survival of terminal cancer patients together with the initial PPS.
Supplementary material
The supplementary material for this article can be found at https://doi.org/10.1017/S1478951520001248.