


Introduction
The Neogene is a geologic period characterized by being warmer than the present, with a thermal peak during the middle Miocene, though the temperatures gradually decreased from the Pliocene onward (Zachos et al. Reference Zachos, Pagani, Sloan, Thomas and Billups2001). During the Neogene, the continents reached their present-day spatial configuration (Hillis et al. Reference Hillis, Sandiford, Reynolds and Quigley2008). The formation of ice sheets in both hemispheres caused a decrease in humidity and a decrease in sea levels, accelerated by the late Pliocene glaciation (Raymo et al. Reference Raymo, Lisiecki and Nisancioglu2006; Miller et al. Reference Miller, Wright, Browning, Kulpecz, Kominz, Naish, Cramer, Rosenthal, Peltier and Sosdian2012). These changes had a profound impact on the diversification of marine biota, specifically in vertebrates (Steeman et al. Reference Steeman, Hebsgaard, Fordyce, Ho, Rabosky, Nielsen, Rahbek, Glenner, Sorensen and Willerslev2009; Marx and Uhen Reference Marx and Uhen2010; Villafaña and Rivadeneira Reference Villafaña and Rivadeneira2014).
The temperate Pacific coast of South America (4°S to 42°S, TPSA hereafter), which represents a major biogeographic unit (Camus Reference Camus2001; Spalding et al. Reference Spalding, Fox, Allen, Davidson, Ferdaña, Finlayson, Halpern, Jorge, Lombana, Lourie, Martin, McManus, Molnar, Recchia and Robertson2007), experienced profound environmental transformations during the Neogene. These changes include the uplift of the Andes Mountains (Blisniuk et al. Reference Blisniuk, Stern, Chamberlain, Idleman and Zeitler2005), the final rise of the Isthmus of Panama (Coates et al. Reference Coates, Collins, Aubry and Berggren2004; Montes et al. Reference Montes, Cardona, Jaramillo, Pardo, Silva, Valencia, Ayala, Pérez-Angel, Rodriguez-Parra, Ramirez and Niño2015), the beginning of hyperaridity in the Atacama Desert (Hartley and Chong Reference Hartley and Chong2002), and the onset of the modern conditions of the Humboldt Current (Ibaraki Reference Ibaraki1997; Tsuchi Reference Tsuchi2002; Dekens et al. Reference Dekens, Ravelo and McCarthy2007). The climatic and oceanographic Neogene events modulated the diversification trends of marine taxa in the TPSA (Valenzuela-Toro et al. Reference Valenzuela-Toro, Gutstein, Varas-Malca, Suarez and Pyenson2013; Villafaña and Rivadeneira Reference Villafaña and Rivadeneira2014). In addition, profound changes were observed in Neogene mollusk faunas along the TPSA (Rivadeneira and Marquet Reference Rivadeneira and Marquet2007; Kiel and Nielsen Reference Kiel and Nielsen2010). Recently, Villafaña and Rivadeneira (Reference Villafaña and Rivadeneira2014) evaluated the diversification trends of marine vertebrates in the TPSA and showed a hump-shaped diversification trend with a late Miocene maximum followed by a drop in diversity toward the Pliocene, which was caused by a large extinction. These analyses focused mainly on the origin and extinction of taxa, ignoring the impact of environmental changes on biogeographic patterns of taxa. For instance, Neogene mollusks show drastic shifts in their distribution ranges during the Neogene along the TPSA (Kiel and Nielsen Reference Kiel and Nielsen2010).
The fossil record of marine vertebrates during the Neogene in the TPSA has been extensively studied (Walsh Reference Walsh2001; Chavez Reference Chavez2008; Canto et al. Reference Canto, Yanez and Rovira2010; Villafaña Reference Villafaña2010; Carrillo-Briceño et al. Reference Carrillo-Briceño, Gonzalez-Barba, Landaeta and Nielsen2013). In particular, chondrichthyans (sharks, rays, and chimaeras) stand out as one of the most studied groups among marine vertebrates along the TPSA (Long Reference Long1993; De la Cruz Reference De la Cruz2012; Carrillo-Briceño et al. Reference Carrillo-Briceño, Gonzalez-Barba, Landaeta and Nielsen2013; Villafaña and Rivadeneira Reference Villafaña and Rivadeneira2014; Staig et al. Reference Staig, Hernández, López, Villafaña, Varas, Soto and Carrillo-Briceño2015). In Chile, the largest number of Neogene records are from the Bahia Inglesa Formation (Walsh Reference Walsh2001; Suarez et al. Reference Suarez, Lamilla and Marquardt2004), the Coquimbo Formation (Staig et al. Reference Staig, Hernández, López, Villafaña, Varas, Soto and Carrillo-Briceño2015), the Navidad Formation (Suarez et al. Reference Suarez, Encinas and Ward2006; Nielsen and Glodny Reference Nielsen and Glodny2009), and the Horcon Formation (Carrillo-Briceño et al. Reference Carrillo-Briceño, Gonzalez-Barba, Landaeta and Nielsen2013). These formations are of early Miocene to late Pliocene age. Thus, the rich fossil record of chondrichthyans lends itself for use as a study model to understand diversification patterns within the region during the Neogene. Interestingly, Villafaña and Rivadeneira (Reference Villafaña and Rivadeneira2014) showed that chondrichthyans suffered a comparatively low regional extirpation of genera during the Neogene (i.e., up to 17% of genera went extinct) and that ecological and life-history traits were important for understanding extinction selectivity. Despite the low regional extirpation, it is possible that environmental transformation had an important imprint on biogeographic ranges of taxa.
Considering the warm conditions during the Neogene in Chile and Peru (Dekens et al. Reference Dekens, Ravelo and McCarthy2007; Nielsen and Glodny Reference Nielsen and Glodny2009; Dowsett et al. Reference Dowsett, Foley, Stoll, Chandler, Sohl, Bentsen, Otto-Bliesner, Bragg, Chan, Contoux, Dolan, Haywood, Jonas, Jost, Kamae, Lohmann, Lunt, Nisancioglu, Abe-Ouchi, Ramstein, Riesselman, Robinson, Rosenbloom, Salzmann, Stepanek, Strother, Ueda, Yan and Zhang2013), a cooling of ocean temperature would have produced a contraction in the poleward (i.e., southern) limit of distribution of marine taxa along the TPSA due to ecophysiological constraints (i.e., thermal tolerance). Cione et al. (Reference Cione, Mennucci, Santalucita and Hospitaleche2007a) attribute the local extinction of the sand tiger shark Carcharias to an abrupt drop in temperature during the Pliocene/Pleistocene transition. Intense climatic, tectonic, and oceanographic events during the Neogene were hypothesized as possible causes of chondrichthyan distributional changes (Long Reference Long1993; Carrillo-Briceño et al. Reference Carrillo-Briceño, Gonzalez-Barba, Landaeta and Nielsen2013).
Ecological and life-history traits modulate changes in the geographic ranges of species (e.g., Roy et al. Reference Roy, Jablonski and Valentine2001; Sexton et al. Reference Sexton, McIntyre, Angert and Rice2009; Davidson et al. Reference Davidson, Boyer, Kim, Pompa-Mansilla, Hamilton, Costa, Ceballos and Brown2012). Body size is the trait most considered in studies of biogeographic dynamics (Roy et al. Reference Roy, Jablonski and Valentine2001; Olabarria and Thurston Reference Olabarria and Thurston2003; Linse et al. Reference Linse, Griffiths, Barnes and Clarke2006). Other ecological traits—such as the type of feeding, breeding, and larval development—have been considered in marine invertebrates (Gordillo et al. Reference Gordillo, Rabassa and Coronato2008; Crampton et al. Reference Crampton, Cooper, Beu, Foote and Marshall2010). Yet biogeographic studies in marine vertebrates and their relationship to ecological and life-history traits are scarce (Cione et al. Reference Cione, Tonni, Bargo, Bond, Candelo, Carlini, Deschamps, Dozo, Esteban, Goin, Nasif, Noriega, Ortiz Jaureguizar, Pascual, Prado, Reguero, Scillato-Yane, Soibelzon, Verzi, Vieytes, Vizcaino and Vucetich2007b).
This study takes advantage of the rich fossil record of chondrichthyans along the TPSA to analyze their biogeographic dynamics on geological timescales (i.e., from the Neogene to the present). We aim at (1) describing the magnitude and significance of shifts in the southern limits of distributions and (2) evaluating the modulatory role of ecological and life-history traits in biogeographic dynamics.
Materials and Methods
Database
We obtained information of georeferenced occurrences of fossil sharks, rays, and chimaeras at genus level from Neogene outcrops along the TPSA from a comprehensive literature review (including journal articles, theses, and conference abstracts) and complemented this with data from the Paleobiology Database (PBDB; paleobiodb.org). In addition, the following collections deposited in museums of Chile were analyzed: Museo Paleontológico de Caldera, Museo Arqueológico de La Serena, and Museo de Historia Natural e Histórico de San Antonio.
We analyzed 3375 fossil specimens, including teeth, dental plates, and dorsal and caudal spines. We collected information for a total of 506 georeferenced occurrences of 38 genera (see Supplementary Tables 1, 2) from 42 sites along the TPSA (~4–42°S; Fig. 1), and we reviewed fossil records from 7 geological formations corresponding to different Neogene ages along the coasts of Peru and Chile. For the same genera gathered in the fossil database (excluding globally extinct genera), we obtained information about their current global distributions from the Ocean Biogeographic Information System (2015). This Recent data set contained 338,527 georeferenced occurrences of 256 species.
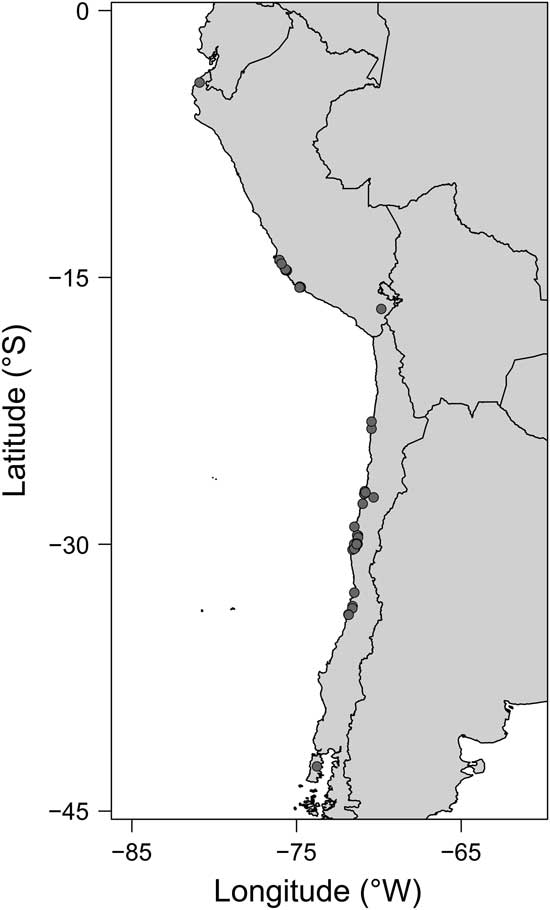
Figure 1 Map of the study region along the temperate Pacific coast of South America (TPSA), indicating the fossiliferous Neogene locations analyzed.
Analysis
We evaluated range contractions/expansions from the Neogene to the present. In addition, analysis was also redone by dividing the Neogene in two time intervals: early Miocene and middle Miocene–Pliocene. We were unable to assign our records to finer stratigraphic intervals, because detailed biostratigraphic data are scant or missing for many of the fossiliferous outcrops along the TPSA. Analyses were carried out at two spatial scales: regional and local. The regional scale considers biogeographic changes at the level of biogeographic provinces. For the regional level, we identified those genera that disappeared from the TPSA (i.e., regional extirpation). In contrast, analyses on the local scale focused on subtle changes in distribution (i.e., within the TPSA). For the local level, we quantified the number of genera that contracted/expanded their southern range from the Neogene to the present in the TPSA. A range shift was concluded when the difference between the southern endpoints of distribution of the Neogene and the present distribution was larger than 1° of latitude. We repeated the analysis using different cutoffs to define a range shift (5° and 10°), but results remained consistent. Both scales are complementary and represent a trade-off between precision and resolution. The regional level offers less bias in the estimates, but it offers lower resolution. The local level is more precise, but it may contain a greater bias (see below). Thus, their combined use may help obtain more robust interpretations.
Our approach to estimating range shifts assumes no bias in the geographic information (i.e., insufficient sampling). To evaluate this assumption, we performed a simulation in which we subsampled the original data set, selecting five occurrences for four latitudinal ranges (4– 12.9°S, 13–22.9°S, 23–32.9°S, and 33–42.9°S). For reach run, we estimated the southern endpoint of distribution for each genus and compared it with the limit obtained from the original data set using Spearman rank correlation, and this was repeated 10,000 times. If spatial biases were severe, then the 95% confidence interval (CI) of the frequency distribution of rho values should include both negative and positive values. However, rho values varied between 0.49 and 0.97 (95% CI), strongly suggesting that a possible sampling bias was not masking overall biogeographic trends along the region. However, we acknowledge that possible taphonomic effects might be important, but such types of analyses are largely missing.
We compiled information for several traits of genera, including ecological and life-history traits and proxy variables of physiological tolerances/requirements obtained from extant species (Table 1, Supplementary Table 2). Data concerning weight, maximum bathymetric depth, type of reproduction (ovoviviparous, oviparous, and viviparous), and migration type (amphidromous and oceanodromous) were obtained from Fishbase (Froese and Pauly Reference Froese and Pauly2017). Minimum and maximum stratigraphic ranges were obtained directly for each genus from the PBDB. In addition, we obtained information about different proxies of realized physiological tolerances/requirements to oceanographic conditions for each genus (e.g., Stuart-Smith et al. Reference Stuart-Smith, Edgar and Bates2017). We superimposed the present-day georeferenced occurrences with rasters of three oceanographic variables (sea surface temperature [SST], salinity, and primary productivity) obtained from the Aquamaps database at 0.5° resolution (Kaschner et al. Reference Kaschner, Schneider, Garilao, Kesner-Reyes, Rius-Barile and Froese2016). We extracted SST, salinity, and primary productivity for each geographic point, and then we estimated the median, 5th, and 95th quantiles (referred to as minimum and maximum hereafter), and range (the difference between 95th and 5th quantiles, simply referred to as “range” hereafter) across all species belonging to the same genus. Extrapolating traits information from present-day forms to fossil forms assumes that these traits are phylogenetically conservative (Jablonski Reference Jablonski2005). We estimated the physiological tolerances/requirements of the fossil records using information for modern species within each genus, assuming that the oceanographic niche of genera reflects their physiological requirements and that the niche was conserved from the Neogene to the Recent (see below). To test the validity of the assumption of niche conservatism, we carried out a principal component analysis on the three oceanographic variables over the entire data set of occurrences. Then we ran a Moran’s autocorrelation analysis on the median values of the first two axes of the principal component analysis (accounting for 59% and 22% of variance, respectively) using species nested within genera, where Moran’s I can take ranges from −1 (i.e., niche evolution) to 1 (i.e., niche conservatism). Analyses were carried out using the package ‘ape’ in R (Paradis et al. Reference Paradis, Claude and Strimmer2004). Moran’s I was significantly higher than zero for both axes (PCA 1, I=0.11, p=0.001; PCA 2, I=0.10, p=0.006), suggesting that niches are conserved at the genus level, hence validating our approach. We also tested the existence of a taxonomic signal in the type of range dynamics for regional (−1: extinct; 0: surviving) and local scales (−1: contraction; 0: stable; 1: expansion), using a Moran’s autocorrelation analysis and genera nested within families (Lockwood et al. Reference Lockwood, Russell, Gittleman, Daehler, McKinney and Purvis2002).
Table 1 Intrinsic traits of genera used for the random forest analyses, including ecological and life-history traits and tolerance to oceanographic variables. The type of variable, the prediction of biogeographic dynamics, and previous studies are indicated.
A random forest model was used to analyze the role of ecological and life-history traits on biogeographic dynamics (Breiman Reference Breiman2001; Liaw and Wiener Reference Liaw and Wiener2002). The random forest approach is a powerful machine-learning classification and regression method (Liaw and Wiener Reference Liaw and Wiener2002) that circumvents assumptions of traditional ordinary least squares and general linear model regressions and is increasingly being used in ecological and evolutionary analyses (Cutler et al. Reference Cutler, Edwards, Beard, Cutler and Hess2007; Fenberg et al. Reference Fenberg, Menge, Raimondi and Rivadeneira2015). This analysis considers the change in the distribution of taxa to be a binomial variable (e.g., for the regional scale, 1=presently extinct from the TPSA, 0=still present at the TPSA; for the local scale, 1=contraction of the southern endpoint, 0=expansion of the southern endpoint). We included only variables showing a variance inflation factor <2.5 in order to account for the possible effects of variable multicollinearity, which could yield spurious estimates regarding the variable importance (Strobl et al. Reference Strobl, Malley and Tutz2009). We selected the optimal set of predictive variables based on the criteria of the area under the receiver operating characteristic curve, using “backward” elimination based on the initial ranking of variables (Calle et al. Reference Calle, Urrea, Boulesteix and Malats2011). This analysis was carried out using the packages ‘Random Forest’ and ‘AUCRF’ (Calle et al. Reference Calle, Urrea, Boulesteix and Malats2011) in R (R Core Team 2015).
Results
We obtained information for a total of 38 Neogene chondrichthyan genera (31 sharks, 6 rays, and 1 chimaera; Supplementary Table 2). In terms of regional dynamics, 34% of the genera (13 out of 38) disappeared from the TPSA during the Neogene (e.g., Carcharias) and 66% (25 out of 38) remained in the region (e.g., Carcharodon) (Supplementary Table 2). The fraction of genera that disappeared from the TPSA was lower than expected by chance (chi-square test, χ2=7.58, df=1, p=0.006). Of those genera disappearing from the TPSA, four went extinct on global scale (11%), and nine (24%) went extinct from the eastern Pacific (Supplementary Table 2). Exclusion of globally extinct genera did not alter the trends (26% went extinct from the TPSA, χ2=15.06, df=1, p<0.0001). We also excluded the genus Ginglymostoma due its uncertain distribution in Peru. At a local scale, for the 24 genera that remained in the TPSA, 13 (54%) expanded their southern endpoint and 11 (46%) contracted it (Supplementary Table 2). The percentage of genera increasing or decreasing their southern latitudinal range was not different than expected by chance (χ2=0.08, df=1, p=0.78). These trends were in general not taxonomically selective, except on local scale, where autocorrelation of orders within superorders was positive and statistically significant (Table 2).
Table 2 Results of the Moran’s autocorrelation used to evaluate the existence of taxonomic selectivity of range dynamics at regional and local scale.
Considering the stratigraphic distribution, 17 genera were present in the early Miocene, and 34 genera occurred from the middle Miocene–Pliocene on the Pacific coast of South America (Table 3). On regional scale, 12% of genera (2 out of 17) disappeared from the early Miocene to middle Miocene–Pliocene and 88% (15 out of 17) remained in the region (Table 3). The fraction of genera that disappeared from the TPSA was lower than expected by chance (χ2=9.94, df=1, p=0.002, after excluding Lamna and Squalus). On local scale, for the 13 genera that remained in the TPSA during the early Miocene to middle Miocene–Pliocene, 6 (46%) expanded their southern endpoint and 7 (54%) contracted it (Table 3). For the middle Miocene–Pliocene to the Recent, 32% of genera (11 out of 34) disappeared and 68% (23 out of 34) remained in the eastern Pacific. For the genera that disappeared from the TPSA, two went globally extinct (6%) and nine (26%) went extinct from the eastern Pacific (Table 3). On local scale, for the 22 genera that remained in the PTSA, 12 (55%) contracted their southern endpoint and 10 (45%) expanded it (Table 3).
Table 3 Biogeographic dynamic of Neogene chondrichthyans from the PTSA at two stratigraphic intervals: early Miocene to middle Miocene–Pliocene and middle Miocene–Pliocene to the present. A, record absent in the TPSA; E, genus extinct; numbers, degree of latitude.
The random forest model showed high precision for analyses on regional (pseudo-r 2=0.74) and local scales (pseudo-r 2=0.75) (Fig. 2). On a regional scale, the only significant variables were (sorted in descending order of importance): minimum salinity, SST range, and body weight (Fig. 2A). The disappearance of genera from the TPSA was positively correlated with minimum salinity and negatively correlated with SST range and body weight (Fig. 3A). On a local scale, the only significant variables in the model were (in descending order of importance): maximum depth, minimum primary productivity, maximum SST, and SST range (Fig. 2B). Relationships between these variables and the chance of contracting the southern endpoint of distribution were negative in all cases (Fig. 3B).
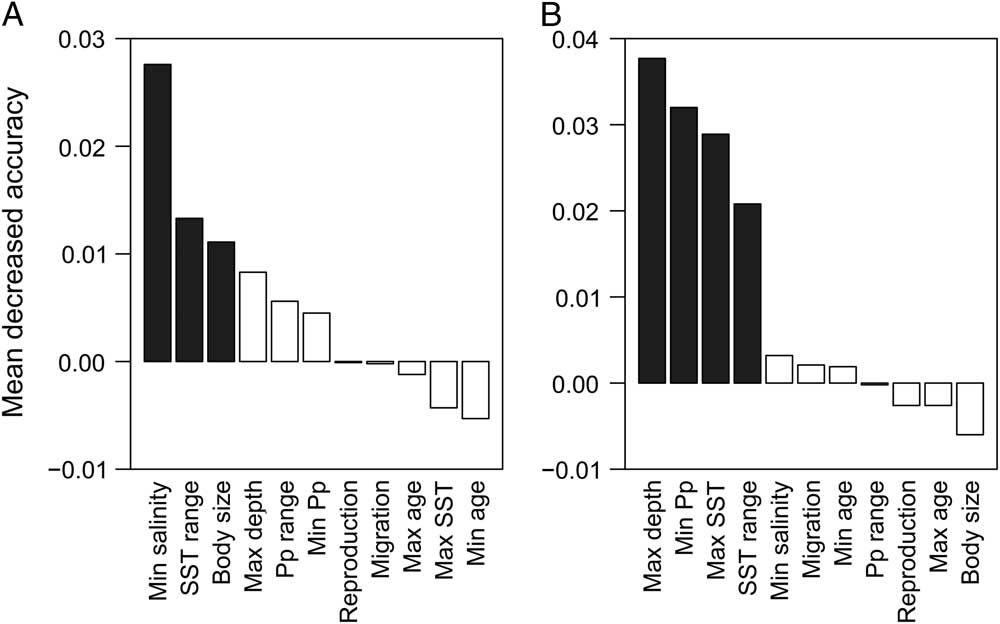
Figure 2 Random forest analyses, showing the relative importance (mean decreased accuracy) of ecological and life-history traits as predictors of biogeographic dynamics at (A) regional and (B) local scales. Significant variables (p<0.05) are indicated in bold. Max age, maximum age; Max depth, maximum depth; Max SST, maximum sea surface temperature; Min age; minimum age; Min Pp, minimum primary productivity; Min salinity, minimum salinity; Pp range, primary productivity range; SST range, sea surface temperature range.
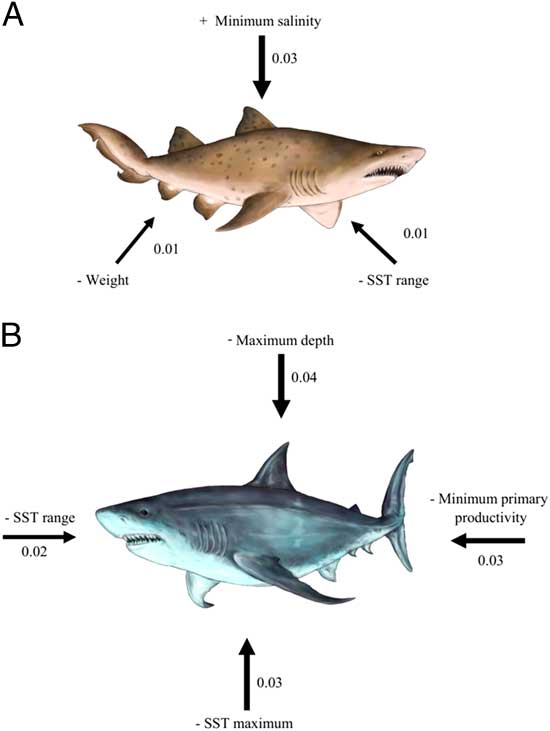
Figure 3 Relative importance (indicated by the width of arrows) of ecological and life-history traits in the biogeographic dynamics of chondrichthyan genera at A) regional (e.g., Carcharias taurus) and B) local scale (e.g., Carcharodon carcharias). Only significant variables are included. The numbers and signs correspond to the log-odds of logistic regressions between binary responses (regional scale: 1=extinct, 0=surviving; local scale: 1=contraction of the southern endpoint, 0=expansion of the southern endpoint) in range shift and predictor variables.
Discussion
Our results show that despite the fact that most of the chondrichthyans genera survived the late Neogene extinction along the TPSA (Villafaña and Rivadeneira Reference Villafaña and Rivadeneira2014), the strong environmental changes experienced along the coast had a marked effect on their biogeographic distribution. Moreover, range dynamics across evolutionary timescales were scale dependent and quite variable among genera (i.e., responses were not coordinated), but such variability in generic responses could be largely explained by taxon traits.
On a regional scale, 34% of genera went extinct from the TPSA and from the entire eastern Pacific. This strongly suggests that an important fraction of genera was affected by intense oceanographic, climatic, and biotic changes that occurred during the Neogene–Quaternary in this region (Ibaraki Reference Ibaraki1997; Tsuchi Reference Tsuchi2002; Dekens et al. Reference Dekens, Ravelo and McCarthy2007; Rivadeneira and Marquet Reference Rivadeneira and Marquet2007; Garreaud et al. Reference Garreaud, Molina and Farias2010; Villafaña and Rivadeneira Reference Villafaña and Rivadeneira2014). On a local scale, however, the biogeographic dynamic was characterized by the absence of a directional pattern of change (i.e., contraction/expansion of southern endpoints was equally likely among genera). Thus, on a local scale, and unlike previous paleobiogeographic studies showing highly coordinated parallel biogeographic responses among species (Kaplan et al. Reference Kaplan, Bigelow, Prentice, Harrison, Bartlein, Christensen, Cramer, Matveyeva, McGuire, Murray, Razzhivin, Smith, Walker, Anderson, Andreev, Brubaker, Edwards and Lozhkin2003; Koch and Barnosky Reference Koch and Barnosky2006), the biogeographic responses to climatic changes were seemingly idiosyncratic (but see below), as seen in Quaternary mammals (Lyons Reference Lyons2003), which show a mosaic of trends. Mismatched biogeographic responses were reported for Quaternary mammals in North America, where species show different biogeographic dynamics against the same type of environmental forcing (Graham et al. Reference Graham, Lundelius, Graham, Schroeder, Toomey, Anderson, Barnosky, Burns, Churcher, Grayson, Guthrie, Harington, Jefferson, Martin, McDonald, Morlan, Jr, Webb, Werdelin and Wilson.1996; Barnosky et al. Reference Barnosky, Hadly and Bell2003).
Our results point to a complementary role of traits to explain the marked differences in biogeographic responses among genera, as seen in other taxa (Roy et al. Reference Roy, Jablonski and Valentine2001; Sexton et al. Reference Sexton, McIntyre, Angert and Rice2009). Interestingly, the relative importance of predictors of biogeographic dynamics was markedly variable on the two spatial scales analyzed (regional dynamic vs. local dynamic, Spearman’s rho=0.12, p=0.73). This suggests a shifting control of the traits governing biogeographic dynamics across spatial scales of analysis. To the best of our knowledge, this aspect has not been considered in previous studies, though it could be relevant to understand the wide variation of biogeographic dynamics observed in different groups.
On a regional scale, the chances of extinction in the TPSA were governed by a combination of tolerance to oceanographic conditions (i.e., salinity and thermal range) and life-history traits (i.e., body size). Extinction probability was positively related to minimum salinity and negatively related to SST range and body-size weight. The role of salinity and SST in controlling the marine biogeographic structure at large geographic scales has been well established (Belanger et al. Reference Belanger, Jablonski, Roy, Berke, Krug and Valentine2012; Fenberg et al. Reference Fenberg, Menge, Raimondi and Rivadeneira2015). Assuming that the oceanographic niche estimated for each genus is directly driven by its ecophysiological limits, our results suggest that those genera with higher salinity tolerance and lower thermal tolerance tended to show a strong range contraction, ultimately disappearing from the TPSA. For example, the genus Brachaelerus inhabited the eastern Pacific during the Neogene, but currently its distribution is restricted to Australia (Compagno Reference Compagno2005). We believe that the oceanographic conditions of eastern Australia (higher salinity; >36 practical salinity unit [PSU]) were more favorable for this genus than those in the north of Chile (lower salinity; ~34 PSU) (Reul et al. Reference Reul, Fournier, Boutin, Hernandez, Maes, Chapron, Alroy, Quilfen, Tenerelli, Morisett and Kerr2014).
Thermal stress is often hypothesized as the primary cause of regional and global extinction of chondrichthyans on geological timescales (Cione et al. Reference Cione, Mennucci, Santalucita and Hospitaleche2007a; Pimiento et al. Reference Pimiento, MacFadden, Clements, Varela, Jaramillo, Velez-Juarbe and Silliman2016). However, the tolerance to salinity and temperature of chondrichthyans varies depending on the study group (Goldman Reference Goldman1997). For instance, Carcharodon carcharias, like other species of Lamnidae (Isurus oxyrinchus and Lamna nasus), has the ability to thermoregulate its body temperature through a countercurrent system, the rete mirabile (Goldman Reference Goldman1997). This idea is supported by the expansion of the southern latitudinal range of these three genera (Carcharodon, Isurus, and Lamna) during the Neogene to the Recent. This trait distinguishes Lamnidae from other chondrichthyan groups, which fully depend on the temperature of the environment (i.e., poikilotherms). Hence, changing the environmental conditions could directly affect the range expansion. Therefore, the same changes in SST and salinity likely had different effects on the distribution of genera across different families. On the other hand, the range shifts at a regional scale were also related to body size, as observed in marine invertebrates (Roy et al. Reference Roy, Jablonski and Valentine2001; Olabarria and Thurston Reference Olabarria and Thurston2003; Linse et al. Reference Linse, Griffiths, Barnes and Clarke2006). However, the relationship between regional extirpation and body size was negative (i.e., the surviving genera tended to be larger sized), implying that the risk of extinction was more pronounced in smaller-sized forms, contrary to the observations in rays (Dulvy and Reynolds Reference Dulvy and Reynolds2002) and sea mammals (Davidson et al. Reference Davidson, Boyer, Kim, Pompa-Mansilla, Hamilton, Costa, Ceballos and Brown2012). Interestingly, when we included those genera that are globally extinct, a different picture emerged (Fig. 4). The regional extirpation of genera from the TPSA selectively affected extreme body sizes (i.e., both smaller- and larger-sized forms). Globally extinct genera tended to be the largest forms, whereas regionally extinct genera (i.e., currently living outside the TPSA) were the smallest forms. Along with these results, ecological studies have stressed that larger-sized rays and sharks are at a higher risk of global extinction (Dulvy et al. Reference Dulvy, Fowler, Musick, Cavanagh, Kyne, Harrison, Carlson, Davidson, Fordham, Francis, Pollock, Simpfendorfer, Burgess, Carpenter, Compagno, Ebert, Gibson, Heupel, Livingstone, Sanciangco, Stevens, Valenti and White2014). However, our results also highlight that smaller taxa may be more prone to experience strong range contractions related to environmental changes.
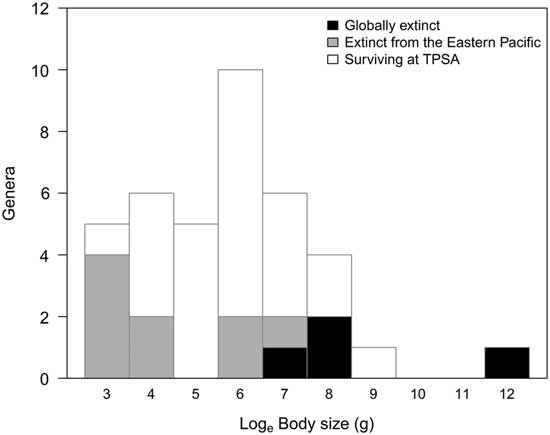
Figure 4 Frequency distribution of the body size of chondrichthyan genera according to their range dynamics.
At local scales, depth and primary productivity had a significant effect on range shifts. The probability of contraction in southern endpoints was negatively related to maximum depth and primary productivity. Particularly, contractions of the southern endpoints were observed in genera tending to inhabit deeper waters and tolerating lower levels of primary productivity. This is consistent with the development of a very shallow oxygen minimum zone (OMZ) along the southern Pacific margin during the late Neogene as a consequence of the onset of modern upwelling conditions (Martinez-Pardo Reference Martinez-Pardo1990). The upper boundary of the OMZ (<20 μmol O2 kg−1) can reach depths lower than 100 m (Fuenzalida et al. Reference Fuenzalida, Schneider, Garcés-Vargas, Bravo and Lange2009), restricting the distribution of benthic and demersal species (Levin et al. Reference Levin, Gutiérrez, Rathburn, Neira, Sellanes, Munoz, Gallardo and Salamanca2002). For example, the Chilean and Peruvian eagle rays (Myliobatis chilensis and M. peruvianus) are benthopelagic species that are vertically distributed between 1 and 100 m (Last et al. Reference Last, White, Séret, Naylor, de Carvalho and Stehmann2016). Therefore, the OMZ represents one of the most important oceanographic boundaries for micro- and macrofauna and could affect chondrichthyans in the TPSA according to their physiology (Levin Reference Levin2003; Thiel et al. Reference Thiel, Macaya, Acuña, Arntz, Bastias, Brokordt, Camus, Castilla, Castro, Cortés, Dumont, Escribano, Fernandez, Gajardo, Gaymer, Gomez, González, González, Haye, Illanes, Iriarte, Lancellotti, Luna-Jorquera, Luxoro, Manriquez, Marín, Muñoz, Navarrete, Perez, Poulin, Sellanes, Sepúlveda, Stotz, Tala, Thomas, Vargas, Vasquez and Vega2007). In addition, it is well established that endemic species are more vulnerable to extinction due to habitat limitations (Dulvy et al. Reference Dulvy, Fowler, Musick, Cavanagh, Kyne, Harrison, Carlson, Davidson, Fordham, Francis, Pollock, Simpfendorfer, Burgess, Carpenter, Compagno, Ebert, Gibson, Heupel, Livingstone, Sanciangco, Stevens, Valenti and White2014). In our case, the genera that experienced a contraction of the southern latitudinal range had endemic representatives in the eastern Pacific (e.g., Myliobatis chilensis and Aetobatus laticeps). Clades inhabiting mesopelagic and deep-water environments (of lower productivity than shallower habitats) (e.g., Etmoptertidae and Arhynchobatidae) are at lower risk of extinction than clades inhabiting shallower areas due to the lower accessibility of fisheries to deep-water stocks (Dulvy et al. Reference Dulvy, Fowler, Musick, Cavanagh, Kyne, Harrison, Carlson, Davidson, Fordham, Francis, Pollock, Simpfendorfer, Burgess, Carpenter, Compagno, Ebert, Gibson, Heupel, Livingstone, Sanciangco, Stevens, Valenti and White2014). Hence, these families, seemingly at lesser risk from human activities, may still be facing higher chances of range contraction due to the projected intensification of the OMZ as a consequence of global change (Gilly et al. Reference Gilly, Beman, Litvin and Robison2013).
Our analysis did not show taxonomic selectivity at regional scale, affirming the role of intrinsic factors more than a simple taxonomic signal. On the contrary, at the local scale we found a correlation at the order level. This could be explained by the observation that most of the Myliobatiformes (4 out of 5 genera) contracted their ranges. Dulvy et al. (Reference Dulvy, Fowler, Musick, Cavanagh, Kyne, Harrison, Carlson, Davidson, Fordham, Francis, Pollock, Simpfendorfer, Burgess, Carpenter, Compagno, Ebert, Gibson, Heupel, Livingstone, Sanciangco, Stevens, Valenti and White2014), using global chondrichthyan data, found that five out of the seven most threatened families are rays. Whether the extinction risk/range contraction is higher in rays than in sharks has yet to be studied in detail.
Conclusions
Our study shows that a large fraction of chondrichthyans experienced range contractions from the Neogene to the present, and this dynamic was largely selective with respect to ecological and life-history traits. Other ecological traits such as habitat and feeding type need to be considered by future studies. Recently, Pimiento et al. (Reference Pimiento, Griffin, Clements, Silvestro, Varela, Uhen and Jaramillo2017) found that the loss of productive coastal habitats was a key extinction driver of the Pliocene marine megafauna (including sharks). This idea was previously discussed as one of the possible causes of the local extinction of Carcharias taurus during the Neogene in the eastern Pacific (Cione et al. Reference Cione, Mennucci, Santalucita and Hospitaleche2007a). Additionally, the global extinction of Carcharocles megalodon could be related to the low availability of filter-feeding whales, its preferred prey (Pimiento et al. Reference Pimiento, MacFadden, Clements, Varela, Jaramillo, Velez-Juarbe and Silliman2016). Therefore, the loss of potential prey for sharks and rays during the Neogene in the TPSA, implied by the extinction of mollusks (Herm Reference Herm1969: Rivadeneira and Marquet Reference Rivadeneira and Marquet2007; Kiel and Nielsen Reference Kiel and Nielsen2010) and sea mammals (Valenzuela-Toro et al. Reference Valenzuela-Toro, Gutstein, Varas-Malca, Suarez and Pyenson2013; Villafaña and Rivadeneira Reference Villafaña and Rivadeneira2014), might also have triggered local and regional extinctions of chondrichthyans.
Understanding the processes that control range dynamics is fundamental to anticipating the current global changes on the distribution of global biota. Our results highlight the importance of explicitly considering differences in traits across taxa to improve the predictions of shifts in the biogeographic distribution of biotas.
Acknowledgments
This work was part of J.A.V.’s master’s thesis at Universidad Católica del Norte, Coquimbo, Chile. We deeply appreciate the constructive comments and logistic help provided by V. Castelleto, A. Crame, P. Haye, S. Kiel, S. Hernández, S. Nielsen, M. Thiel, J. Pollerspöck, P. Oyanadel-Urbina, A. Alballay, and M. Torrejón. The article was greatly improved by the comments and suggestions made by G. Cuny, J. Kriwet, and W. Kiessling. For their kindness in providing access to paleontological collections, we would like to thank C. Varas, G. Roa, and M. Guicharrause (Museo Paleontológico de Caldera); G. Cobo and M. Biskupovic (Museo Arqueológico de La Serena); and J. L. Brito (Museo de Historia Natural e Histórico de San Antonio). We also thank C. Marin for providing the illustrations and M. Garrison for proofreading the paper. J.A.V. was supported by the CONICYT-Chile fellowship (Becas para Estudios de Magister). This project was partially funded by FONDECYT grants #1140841 and #1150664.
Supplementary material
Data available from the Dryad Digital Repository: https://doi.org/10.5061/dryad.6j56v


