


Research in perception, memory or language has often used pictures as experimental stimuli to explore different cognitive processes such as object processing, lexical access or language production. Although they were initially used mainly in perceptual identification and recognition studies (Snodgrass, Reference Snodgrass1984; Snodgrass & Poster, Reference Snodgrass and Poster1992), the use of pictures in research has expanded through a wide range of cognitive and neuroscientific fields. For instance, in psycholinguistics, pictures are often used in picture naming studies to explore the processes and the mechanisms involved in lexical access and name retrieval such as in tip-of-the-tongue (TOT) states experiments (e.g., Abrams & Rodriguez, Reference Abrams and Rodriguez2005; Gollan & Acenas, Reference Gollan and Acenas2004; Pureza, Soares, & Comesaña, Reference Pureza, Soares and Comesaña2013, 2016). To name a picture it is necessary to recognize the object depicted by the picture and to activate the semantic information associated with it, previously to the retrieval of its word form and its phonological encoding, as assumed by most of the relevant models of language production (which nevertheless differ in the way they conceptualize lexical access and in the mechanisms by which that information is activated; see for instance Humphreys, Riddoch, & Quinlan, Reference Humphreys, Riddoch and Quinlan1988; or Levelt, Roelofs, & Meyer, Reference Levelt, Roelofs and Meyer1999). Thus, the use of pictures in language production studies is a window to study the cognitive processes and mechanisms that underlie word retrieval and the factors that can affect it not only in healthy adults (e.g., Alario et al., Reference Alario, Ferrand, Laganaro, New, Frauenfelder and Segui2004; Bakhtiar, Nilipour, & Weekes, Reference Bakhtiar, Nilipour and Weekes2013; Barry, Morrison, & Ellis, Reference Barry, Morrison and Ellis1997; Bonin, Chalard, Méot, & Fayol, Reference Bonin, Chalard, Méot and Fayol2002; Bonin, Peereman, Malardier, Méot, & Chalard, Reference Bonin, Peereman, Malardier, Méot and Chalard2003; Boukadi, Zouaidi, & Wilson, Reference Boukadi, Zouaidi and Wilson2016; Cuetos, Ellis, & Álvarez, Reference Cuetos, Ellis and Álvarez1999; Dell’Acqua, Lotto, & Job, 2000; Liu, Hao, Li, & Shu, 2011; Rossion & Pourtois, Reference Rossion and Pourtois2004; Severens, Lommel, Ratinckx, & Hartsuiker, Reference Severens, Lommel, Ratinckx and Hartsuiker2005; Shao, Roelofs, & Meyer, Reference Shao, Roelofs, Acheson and Meyer2014; Snodgrass, & Yuditsky, Reference Snodgrass and Yuditsky1996; Weekes, Shu, Hao, Liu, & Tan, Reference Weekes, Shu, Hao, Liu and Tan2007), but also in other populations such as children (e.g., Cycowicz, Friedman, Rothstein, & Snodgrass, Reference Cycowicz, Friedman, Rothstein and Snodgrass1997; D’Amico, Devescovi, & Bates, 2001), illiterates (e.g., Pegado et al., Reference Pegado, Nakamura, Braga, Ventura, Nunes Filho, Pallier and Dehaene2014) and brain-damaged patients (e.g., Damasio, Grabowski, Tranel, Hichwa, & Damasio, Reference Damasio, Grabowski, Tranel, Hichwa and Damasio1996; Funnel & Sheridan, Reference Funnel and Sheridan1992; Marques, Raposo, & Almeida, Reference Marques, Raposo and Almeida2013), who might show problems with the processing of verbal stimuli.
In addition, the use of pictures brings also other advantages. For example, its use in TOT research allows researchers to overcome some methodological limitations associated with the use of definitions to induce a TOT state, as introduced by the Brown and McNeill (1966) paradigm, adopted by many others in subsequent studies (e.g., Abrams, Trunk & Merrill, Reference Abrams, Trunk and Merrill2007; Abrams, White, & Eitel, Reference Abrams, White and Eitel2003; Burke, Mackay, Worthley, & Wade, Reference Burke, Mackay, Worthley and Wade1991; Gollan & Brown, Reference Gollan and Brown2006; James & Burke, Reference James and Burke2000; Warriner & Humphreys, Reference Warriner and Humphreys2008). Specifically, in that paradigm, participants are asked to “guess” the name of a city, a monument or a celebrity with which they are typically familiar, though not capable of retrieving that specific information at that precise moment, thus eliciting a naming failure (i.e., a TOT response). Though interesting, the use of definitions is problematic since they might contain some kind of semantic and/or syntactic information about the word in TOT, which can inadvertently bias the results (e.g., Abrams & Rodriguez, Reference Abrams and Rodriguez2005; Gollan & Acenas, Reference Gollan and Acenas2004; Pureza et al., Reference Pureza, Soares and Comesaña2013, Reference Pureza, Soares and Comesaña2016). Therefore, the use of pictorial stimuli entails several advantages that make them particularly suited for conducting cognitive and neurophysiological research in a wide range of cognitive fields and with different populations (i.e., children, illiterates, brain-damaged patients), even though its use also limits the kind of stimuli that can be employed and is normally restricted to concrete words or proper names.
However, like other kinds of stimuli (e.g., words), pictures are also very complex stimuli that contain several characteristics and attributes that affect naming latencies and memory processes (e.g., Alario et al, Reference Alario, Ferrand, Laganaro, New, Frauenfelder and Segui2004; Bonin et al., Reference Bonin, Chalard, Méot and Fayol2002, Reference Bonin, Peereman, Malardier, Méot and Chalard2003; Boukadi et al., Reference Boukadi, Zouaidi and Wilson2016; Cuetos et al., Reference Cuetos, Ellis and Álvarez1999; Cycowicz et al., Reference Cycowicz, Friedman, Rothstein and Snodgrass1997; Dell’Acqua et al., Reference Dell’Acqua, Lotto and Job2000; Liu et al., Reference Liu, Hao, Li and Shu2011; Rossion & Pourtois, Reference Rossion and Pourtois2004; Severens et al., Reference Severens, Lommel, Ratinckx and Hartsuiker2005; Shao, Roelofs, & Meyer, Reference Shao, Roelofs, Acheson and Meyer2014; Snodgrass, & Yuditsky, Reference Snodgrass and Yuditsky1996; Weekes et al., Reference Weekes, Shu, Hao, Liu and Tan2007). For instance, it has been shown that pictures representing objects that we come in contact with very often and/or we think about their concepts frequently - an attribute defined as conceptual familiarity (Snodgrass & Vanderwart, Reference Snodgrass and Vanderwart1980), are named faster and more accurately than pictures representing objects to which people are less engaged in their daily life (e.g., Alario et al, Reference Alario, Ferrand, Laganaro, New, Frauenfelder and Segui2004; Bonin et al., Reference Bonin, Chalard, Méot and Fayol2002, 2004; Boukadi et al., 2016; Cuetos et al., Reference Cuetos, Ellis and Álvarez1999; Dell’Aqua et al., 2000; Liu et al., Reference Liu, Hao, Li and Shu2011; Shao, Roelofs, & Meyer, Reference Shao, Roelofs, Acheson and Meyer2014; Severens et al., Reference Severens, Lommel, Ratinckx and Hartsuiker2005; Snodgrass & Yuditsky, Reference Snodgrass and Yuditsky1996; Weekes et al., Reference Weekes, Shu, Hao, Liu and Tan2007), though the locus of this effect is still debated. Indeed, it has been suggested that the effect of familiarity occurs at a semantic level of processing as highly familiar objects activate their corresponding semantic representations more quickly and easily than low familiarity objects (e.g., Cuetos et al., Reference Cuetos, Ellis and Álvarez1999; Hirsh & Funnell, Reference Hirsh and Funnell1995). However, it is also important to note that highly familiar objects also tend to occur more often in everyday life and to be named more frequently than less familiar objects (e.g., Alario et al, Reference Alario, Ferrand, Laganaro, New, Frauenfelder and Segui2004; Boudaki et al., 2106; Moreno-Martínez, & Montoro, Reference Moreno-Martínez and Montoro2012; Shao, Roelofs, & Meyer, Reference Shao, Roelofs, Acheson and Meyer2014; Weekes et al., Reference Weekes, Shu, Hao, Liu and Tan2007), thus highlighting the possibility that the effect of familiarity can also be accounted for (at least partially) by the number of times a given name is used in everyday life (word frequency). Word frequency can be estimated either objectively, by counting the number of times a word appears in written corpora (see Soares, Iriarte et al., Reference Soares, Iriarte, Almeida, Simões, Costa, França, Machado and Comesaña2014; Soares, Machado et al., Reference Soares, Machado, Costa, Iriarte, Simões, Almeida and Perea2015 or Soares, Medeiros et al., Reference Soares, Iriarte, Almeida, Simões, Costa, França, Machado and Comesaña2014, for different approaches to obtain this measure), or subjectively, by asking participants to rate how often a given word is used in daily communication (e.g., Balota, Pilotti, & Cortese, Reference Balota, Pilotti and Cortese2001). Objective and subjective measures of word frequency are strongly correlated and have been shown to be robust predictors of the ease and speed with which a word is recognized and/or produced in a given language above and beyond their familiarity ratings (e.g., Balota et al., Reference Balota, Pilotti and Cortese2001; Desrochers, Liceras, Fernández-Fuertes, & Thompson, Reference Desrochers, Liceras, Fernández-Fuertes and Thompson2010; Thompson & Desrochers, Reference Thompson and Desrochers2009). Subjective frequency is assumed to be a better predictor of the relative frequency of exposure to a word than the experiential familiarity construct introduced by Gernsbacher (Reference Gernsbacher1984), because, as pointed out by Balota et al. (Reference Balota, Pilotti and Cortese2001), the instructions used by Gernsbacher to define a familiar word (i.e., a word that participants know and use very often in their everyday life) and an unfamiliar word (i.e., a word that participants had never seen before, and which cannot be recognized), were extremely vague, allowing other word properties (e.g., semantic, orthographic, phonological) to affect the ratings (see also Soares, Costa, Machado, Comesaña, & Oliveira, Reference Soares, Costa, Machado, Comesaña and Oliveira2017, for a recent discussion). Importantly in some studies, subjective frequency ratings were found to be a better predictor of visual and auditory word recognition than objective frequency counts (e.g., Balota et al., Reference Balota, Pilotti and Cortese2001; Cortese & Khanna, Reference Cortese and Khanna2007), hence making the collection of these ratings an important variable to control for when using pictorial stimuli, particularly in TOT studies. TOT experiments typically involve the use of familiar but low-frequency words, because low-frequency words are thought to have weaker connections between levels of processing in speech production, hence being more prone to speech errors (e.g., Burke et al., Reference Burke, Mackay, Worthley and Wade1991; see also Gollan et al., Reference Gollan, Slattery, Goldenberg, van Assche, Duyck and Rayner2011). However, in many cases those words are so infrequently used in daily life that they are rarely listed in objective word frequency norms (see Burke et al., Reference Burke, Mackay, Worthley and Wade1991, for an example), thus making the collection of subjective frequency ratings critical to control for the use of the names associated with a given picture (see Boukadi et al., Reference Boukadi, Zouaidi and Wilson2016 for a recent example of a pictorial dataset providing subjective frequency ratings).
Other attributes that have been shown to affect object recognition and naming latencies are name agreement, i.e. the extent to which different people agree on assigning a specific name to a particular picture (Snodgrass & Vanderwart, Reference Snodgrass and Vanderwart1980), and also people’s judgments about the number of lines, intricacies and details that a picture contains, a picture attribute defined as visual complexity (Snodgrass & Vanderwart, Reference Snodgrass and Vanderwart1980; see also Székely & Bates, Reference Székely and Bates2000 for an objective measure of picture visual complexity). Name agreement correlates negatively with the time it takes to name the object depicted by a picture (e.g., Alario et al., Reference Alario, Ferrand, Laganaro, New, Frauenfelder and Segui2004; Barry et al., Reference Barry, Morrison and Ellis1997; Bonin et al., Reference Bonin, Chalard, Méot and Fayol2002, Reference Bonin, Peereman, Malardier, Méot and Chalard2003, Boukadi et al., Reference Boukadi, Zouaidi and Wilson2016; Cuetos et al., Reference Cuetos, Ellis and Álvarez1999; Liu et al., Reference Liu, Hao, Li and Shu2011; Shao, Roelofs, & Meyer, Reference Shao, Roelofs, Acheson and Meyer2014; Shao, Roelofs, Acheson, & Meyer, Reference Shao, Roelofs, Acheson and Meyer2014; Snodgrass & Yuditsky, Reference Snodgrass and Yuditsky1996; Valente, Burki, & Laganaro, Reference Valente, Burki and Laganaro2014; Weekes et al., Reference Weekes, Shu, Hao, Liu and Tan2007), as pictures that elicited many different names (i.e., that present low name agreement scores), showed longer latencies than those eliciting a single name (i.e., that present high name agreement scores), due presumably to the competition that arises from different lexical candidates (see Alario et al., Reference Alario, Ferrand, Laganaro, New, Frauenfelder and Segui2004; Barry et al., Reference Barry, Morrison and Ellis1997; Cuetos et al.,Reference Cuetos, Ellis and Álvarez1999; Vitkovitch & Tyrrell, Reference Vitkovitch and Tyrrell1995). Evidence supporting this lexical account on the name agreement effect came from recent behavioral and electrophysiological studies (e.g., Boukadi et al., Reference Boukadi, Zouaidi and Wilson2016; Shao, Roelofs, Acheson et al., Reference Shao, Roelofs, Acheson and Meyer2014; Valente, Burki, & Laganaro, Reference Valente, Burki and Laganaro2014). For instance, Valente et al. (Reference Valente, Burki and Laganaro2014), using event-related brain potentials (ERPs), found that name agreement was a significant predictor of naming latencies and that this variable had a late effect on word production (around 400 ms after picture onset), thus suggesting that the locus of the effect was not at an early semantic stage of structural encoding and object recognition, but rather at a later stage of lexical selection, as previously suggested by others (e.g., Alario et al. Reference Alario, Ferrand, Laganaro, New, Frauenfelder and Segui2004; Barry et al., Reference Barry, Morrison and Ellis1997; Cuetos et al., Reference Cuetos, Ellis and Álvarez1999; Vitkovitch & Tyrrell, Reference Vitkovitch and Tyrrell1995). Importantly, although name agreement correlates with other variables (e.g., conceptual familiarity, word frequency), it has been suggested that its effect on naming performance is independent of these correlated attributes (e.g., Lachman, Shaffer, & Hennrikus, Reference Lachman, Shaffer and Hennrikus1974; McDougall, Curry, & de Bruijn, Reference McDougall, Curry and de Bruijn1999; Snodgrass & Yuditsky, Reference Snodgrass and Yuditsky1996), thus being unsurprisingly considered as one of the most important predictors of the speed and the accuracy with which the object depicted by a picture is named (e.g., Alario et al., Reference Alario, Ferrand, Laganaro, New, Frauenfelder and Segui2004; Barry et al., Reference Barry, Morrison and Ellis1997; Bonin et al., Reference Bonin, Chalard, Méot and Fayol2002, Reference Bonin, Peereman, Malardier, Méot and Chalard2003, Boukadi et al., Reference Boukadi, Zouaidi and Wilson2016; Cuetos et al., Reference Cuetos, Ellis and Álvarez1999; Liu et al., Reference Liu, Hao, Li and Shu2011; Shao, Roelofs, & Meyer, Reference Shao, Roelofs, Acheson and Meyer2014; Shao, Roelofs, Acheson, & Meyer, Reference Shao, Roelofs, Acheson and Meyer2014; Snodgrass & Yuditsky, Reference Snodgrass and Yuditsky1996; Weekes et al., Reference Weekes, Shu, Hao, Liu and Tan2007). However, for visual complexity there is much less evidence showing its impact on naming latencies, with only a few studies demonstrating that it affects significantly the time it takes to name a picture, particularly when the pictorial stimuli used were colored (e.g., Barry et al., Reference Barry, Morrison and Ellis1997; Bonin et al., Reference Bonin, Chalard, Méot and Fayol2002, Reference Bonin, Peereman, Malardier, Méot and Chalard2003; Cycowicz et al., Reference Cycowicz, Friedman, Rothstein and Snodgrass1997; Forsythe, Mulhern, & Sawey, Reference Forsythe, Mulhern and Sawey2008; Rossion & Pourtois, Reference Rossion and Pourtois2004; Shao, Roelofs, & Meyer, Reference Shao, Roelofs, Acheson and Meyer2014; Weekes et al., Reference Weekes, Shu, Hao, Liu and Tan2007). Nevertheless, the literature reviewed so far showed that there are several attributes which affect naming and object recognition performance and that they should be taken into account when planning to conduct cognitive and neuropsychological studies with pictorial stimuli. Not controlling for them can introduce important limitations in the research that can bias the results and confound the effects of the critical variables under study.
Normative data for pictorial stimuli started to gain ground after the seminal work by Snodgrass and Vanderwart in 1980. This work presents a set of 260 black-and-white line drawings that were normalized by asking American English participants to name the pictures and to rate them on conceptual familiarity, visual complexity, and also on the degree to which a given picture resembles the mental image of that object (i.e., image agreement). Since then, many pictorial datasets have been developed for different languages (e.g., British English: Barry et al., Reference Barry, Morrison and Ellis1997; Vitkovitch & Tyrrell, Reference Vitkovitch and Tyrrell1995. Chinese: Weekes et al., Reference Weekes, Shu, Hao, Liu and Tan2007; Liu et al., Reference Liu, Hao, Li and Shu2011. Dutch: Severens et al., Reference Severens, Lommel, Ratinckx and Hartsuiker2005; Shao, Roelofs, & Meyer, Reference Shao, Roelofs, Acheson and Meyer2014. French: Alario & Ferrand, Reference Alario and Ferrand1999; Bonin et al., Reference Bonin, Peereman, Malardier, Méot and Chalard2003. Greek: Dimitropoulou, Duñabeitia, Blitsas, & Carreiras, Reference Dimitropoulou, Duñabeitia, Blitsas and Carreiras2009. Icelandic: Pind, Jónsdóttir, Gissurardóttir, & Jónsson, Reference Pind, Jónsdóttir, Gissurardóttir and Jónsson2000; Italian: Dell’Acqua et al., Reference Dell’Acqua, Lotto and Job2000; Japanese: Nishimoto, Miyawaki, Ueda, Une, & Takahashi, Reference Nishimoto, Miyawaki, Ueda, Une and Takahashi2005; Persian: Bakhtiar et al., Reference Bakhtiar, Nilipour and Weekes2013. Portuguese (Brazilian): Pompéia, Miranda, & Bueno, Reference Pompéia, Miranda and Bueno2001. Russian: Tsaparina, Bonin, & Méot, Reference Tsaparina, Bonin and Méot2011; Spanish: Cuetos et al., Reference Cuetos, Ellis and Álvarez1999; Sanfeliu & Fernandez, Reference Sanfeliu and Fernandez1996; Turkish: Raman, Raman, & Mertan, Reference Raman, Raman and Mertan2014; and Tunisian Arabic: Boukadi et al., Reference Boukadi, Zouaidi and Wilson2016). The emergence of these databases in different languages is not surprising since cultural and linguistic differences seem to affect picture classification, identification and naming (e.g., Bates et al., Reference Bates, D’Amico, Jacobsen, Székely, Andonova, Devescovi and Tzeng2003; Nishimoto et al., Reference Nishimoto, Miyawaki, Ueda, Une and Takahashi2005; Tsaparina et al., Reference Tsaparina, Bonin and Méot2011; see also Dimitropoulou et al., Reference Dimitropoulou, Duñabeitia, Blitsas and Carreiras2009). For instance, in a comparison between Japanese, American, Spanish, French, and Icelandic norms for name agreement, Age of Acquisition (AoA) (i.e., the age at which the word that designates a picture was learned for the first time), and familiarity, Nishimoto et al. (Reference Nishimoto, Miyawaki, Ueda, Une and Takahashi2005) revealed that although there was a relatively high correlations between those variables across languages, the correlations were lower for name agreement that seems to be more strongly affected by languages and/or cultures differences. Thus, norms collected in one language are not suitable for use in another language, and the conduction of normative studies that responds to the specificities of a given language/culture is required for the use of pictorial stimuli with participants from different linguistic/cultural backgrounds.
However, despite the large number of normative studies for pictorial datasets in different languages, their existence in European Portuguese (EP) is scarceFootnote 1. To the best of our knowledge, there is only one published study providing norms for pictured objects in EP (Ventura, Reference Ventura2003). The author selected 219 pictures from the original Snodgrass and Vanderwart (Reference Snodgrass and Vanderwart1980) dataset and collected norms for conceptual familiarity and AoA, as well as for additional variables such as the importance assigned by individuals to the object depicted by the picture in their daily lives (importance of use), the number of things that are visually similar to the item (visual ambiguity), the extent to which the use of hands is required for the object to fulfill its function (manipulability), the estimation of the real size of the object depicted by the picture (size), and whether there is or not a typical movement associated with the use of the object (characteristic movement), (see Ventura, Reference Ventura2003 for details). In spite of the relevance of Ventura’s work for supporting the conduction of EP research with pictorial stimuli, and of the diversity of the picture measures provided, his study does not provide norms for name agreement, image agreement or visual complexity as presented in the original work of Snodgrass and Vanderwart (Reference Snodgrass and Vanderwart1980), and assumed as the most critical variables to control for, though to a lesser extent for visual complexity, as mentioned. Besides, Ventura’s norms were based on the black-and-white drawings of the Snodgrass and Vanderwart corpus, whose ecological validity has been recently questioned (e.g., Dimitripoulou et al., 2009; Moreno-Martínez & Montoro, Reference Moreno-Martínez and Montoro2012; Rossion & Pourtois, Reference Rossion and Pourtois2004; Tsaparina, et al., Reference Tsaparina, Bonin and Méot2011). Indeed, since texture and color information are critical elements for object recognition, especially for structurally similar objects and objects with a diagnostic color (e.g., fruits and vegetables) (see also Marques & Raposo, Reference Marques and Raposo2011, for recent work exploring the contribution of other structural picture dimensions), it is not surprising that including those attributes on the pictures used significantly impacts object recognition and naming latencies. For instance, in a picture naming study comparing name agreement scores and naming latencies for a set of Snodgrass and Vanderwart pictures presented in black-and-white or graphically manipulated to include texture and color information, Rossion and Pourtois (Reference Rossion and Pourtois2004) showed that the addition of these attributes had a clear advantage both on eliciting high name agreement scores (i.e., less alternative names to designate the object depicted by the picture) and faster naming responses as compared to the original black-and-white drawings (see also Weekes et al., Reference Weekes, Shu, Hao, Liu and Tan2007). Thus, in recent years a growing number of studies provide pictorial norms for colored pictures not only for the colorized version of the original black-and-white drawings of Snodgrass and Vanderwart (e.g., Bakhtiar et al, Reference Bakhtiar, Nilipour and Weekes2013; Dimitripoulou et al., 2009; Rossion & Pourtois, Reference Rossion and Pourtois2004; Tsaparina, et al., Reference Tsaparina, Bonin and Méot2011; Weekes et al., Reference Weekes, Shu, Hao, Liu and Tan2007), but also to other colored pictorial datasets (e.g., Brodeur, Dionne-Dostie, Montreuil, & Lepage, Reference Brodeur, Dionne-Dostie, Montreuil and Lepage2010; Moreno-Martínez, & Montoro, Reference Moreno-Martínez and Montoro2012).
Acknowledging these advantages, in this paper we aimed for the first time to provide EP norms for name agreement, concept familiarity, subjective frequency and visual complexity for a new set of 150 colored pictures. This will constitute a valuable tool for supporting the conduction of studies with EP participants in different areas of the cognitive and neuroscientific research, particularly for the conduction of TOT experiments. Indeed, as mentioned, the conduction of TOT experiments with a picture naming paradigm requires the use of pictures depicting objects that although being familiar to the participants, had also low frequency of use in order to induce a TOT response strongly (e.g., Burke et al., Reference Burke, Mackay, Worthley and Wade1991; Gollan et al., Reference Gollan, Slattery, Goldenberg, van Assche, Duyck and Rayner2011; Pureza et al., Reference Pureza, Soares and Comesaña2013, Reference Pureza, Soares and Comesaña2016). However, the majority of the datasets available so far present images depicting objects that are so familiar to the participants that rarely cause a naming failure (i.e., in most cases participants name the picture correctly). TOT responses in those database range from 1% (see for instance Tsaparina, et al., Reference Tsaparina, Bonin and Méot2011 norms) to 2% (see, for instance, Brodeur et al., Reference Brodeur, Dionne-Dostie, Montreuil and Lepage2010 norms), which constitutes an important obstacle for the conduction of TOT experiments with picture naming paradigms. Hence, in order to overcome this gap, the pictures selected to integrate this new pictorial dataset were intentionally selected to elicit a TOT response strongly. To that purpose, we collected from the previous TOT studies using definitions (e.g., Abrams, et al., Reference Abrams, White and Eitel2003, Reference Abrams, Trunk and Merrill2007; Burke et al., Reference Burke, Mackay, Worthley and Wade1991; Gollan & Brown, Reference Gollan and Brown2006; James & Burke, Reference James and Burke2000; Warriner & Humphreys, Reference Warriner and Humphreys2008), the names (concrete words) that induced a TOT response successfully, and translated them into EP. It is worth noting that in this procedure we tried to select words to represent exemplars of the most widely natural and man-made semantic categories used in research (e.g., animals, fruits and vegetables, tools, furniture, buildings and accessories), in order to guarantee more semantic diversity in the dataset. Then, we selected the pictures (colored) that best represent those concepts from the resources available in the internet (e.g., Google Images). From this procedure a total of 150 pictures were selected to integrate this dataset for which norms of conceptual familiarity, subjective frequency, name agreement and visual complexity were collected and provided in this work. In addition, several psycholinguistic variables for the modal names of each picture, such as objective word frequency, number of letters and orthographic syllables as taken from the Procura-PALavras (P-PAL) database Footnote 2. Likewise, the number (percentage) of participants reporting to know (Know responses), not to know (Don’t Know responses), and to know but not being able to retrieve its name at that particular moment (TOT responses) are also provided for each picture in the dataset.
Method
Participants
Six hundred and forty undergraduate students (428 females; M age = 24.6, SD = 6.98, range: 17–58) from different Portuguese universities participated in this study. All participants had EP as their native language and normal or corrected-to-normal vision. They were all volunteers and did not receive any compensation for their participation in the study.
Materials
The 150 pictures of this dataset were selected from free public picture databases (e.g., Google Images) to represent the concepts that elicited a TOT response more strongly. As mentioned before, these concepts were selected from previous TOT studies using definitions to induce a TOT response (e.g., Abrams, et al., Reference Abrams, White and Eitel2003, Reference Abrams, Trunk and Merrill2007; Burke et al., Reference Burke, Mackay, Worthley and Wade1991; Gollan & Brown, Reference Gollan and Brown2006; James & Burke, Reference James and Burke2000; Warriner & Humphreys, Reference Warriner and Humphreys2008). From those definitions we selected the concepts that could be easily convertible into an image (i.e. concrete words) trying also to guarantee that they represent exemplars of the most widely natural and man-made semantic categories used in research (e.g., animals, fruits and vegetables, tools, furniture, buildings and accessories). Consequently, atypical objects from the different categories were included in this dataset such as bandolim [mandolin] (picture 6), banjo [banjo] (picture 48) and acordião [accordion] (picture 81) for music instruments; fuso [spindle] (picture 30), selim [saddle] (picture 47), and foice [sickle] (picture 83) for tools; or alecrim [rosemary] (picture 17), amoras [blackberries] (picture 39), and papaya [papaya] (picture 98), for fruits and vegetables. Table 1 presents the semantic categories included in the dataset, as well as the number of pictures by category and the picture numbers in the dataset.
Table 1. Distribution of the 150 Pictures in the Dataset by Each of the 18 Semantic Categories
All pictures were colored and had an approximate size of 580 pixels of length with variable width and a resolution of 36,00 pixels/cm. Authorization for the use of the pictures for research purposes was obtained. In two cases (pictures 25 vinagre [vinegar] and 62 pilão [pestle]) an arrow was added in order to specify the object to be named. Nine modal names in the dataset were intentionally associated to more than one picture with the purpose of allowing researchers to select the picture that best fit their experimental requirements (e.g., the modal name bazuca [bazooka] was associated either to pictures 1 and 10).
Procedure
For the purpose of the present study a web site was created to collect norms for name agreement, concept familiarity, subjective frequency and visual complexity. Web surveys have been increasingly used in research due to their advantages, particularly in terms of cost and access to a large sample of participants (see Soares, Comesaña, Pinheiro, Simões, & Frade, Reference Soares, Comesaña, Pinheiro, Simões and Frade2012 for details). The hyperlink was distributed via email and sent to the addresses of students who were attending different courses at Portuguese universities. In this e-mail the aims of the experiment, the constitution of the research team, and contacts for further information were provided. Participants were also informed about task requirements and the time needed to complete the survey, as well as about data confidentiality. Written consent was obtained from all the participants (see Soares et al., Reference Soares, Comesaña, Pinheiro, Simões and Frade2012, Reference Soares, Costa, Machado, Comesaña and Oliveira2017, for a similar procedures).
At the beginning of the task participants were asked to fill in a form with their demographic information, specifically their name, age, gender, nationality, native language and level of education. Instructions on how to assess each attribute for each picture were then carefully detailed and followed the procedures adopted by Snodgrass and Vanderwart (Reference Snodgrass and Vanderwart1980) for name agreement, concept familiarity and visual complexity and by Balota et al. (Reference Balota, Pilotti and Cortese2001) for subjective frequency. Specifically, participants were firstly instructed to indicate if they knew (Know response), if they did not know (Don´t Know response) or if they did know the object depicted by a given picture but were simply not capable of retrieving its name (i.e., a TOT response) by clicking on the corresponding key. Then, for the pictures they reported to Know, participants were asked to write down the first name that came to their minds to designate the object depicted by the picture in the blank space provided on the screen. If they did not know the object or if they simply knew but did not remember the name of the object (i.e., if they had selected the TOT key to respond) the following picture was immediately presented.
After providing the name for the objects they report to know, participants were asked to rate each picture on conceptual familiarity, i.e. how often they come in contact with or think about the concept depicted by the picture in their daily lives. As in the Snodgrass and Vanderwart (Reference Snodgrass and Vanderwart1980) work, they were asked to rate the concept itself, rather than the way it was drawn in a 5-point Likert scale, ranging from 1 (very unfamiliar concept) to 5 (very familiar concept). For the visual complexity dimension, participants were instructed to rate the complexity of each picture on a 5-point scale in which 1 indicated a very simple and 5 indicated a very complex picture. Complexity was defined as the amount of detail or intricacy of line in the picture. They were told to rate the complexity of the picture itself rather than the complexity of the real-life object it represented. Finally, for subjective frequency, participants were asked to estimate how often they encounter the word used to designate a given picture on a daily basis and by using a 5-point Likert scale ranging from 1 (never encountered) to 5 (encountered several times a day). Note that in order to maintain the same scale across dimensions, we opted to use a 5-point Likert scale rather than the 7-point Likert scale originally used by Balota et al. (Reference Balota, Pilotti and Cortese2001). After rating all the dimensions for a given picture, a new stimulus was presented, and the procedure was repeated until the end of the task. The order of presentation of each rating was randomized across participants, except for name agreement since participants always began the task by providing the name that firstly came into their minds when they saw the picture. Participants were encouraged to answer as quickly as possible but to provide careful and honest responses while trying not to make mistakes. In order to avoid fatigue, each participant rated a set of 50 pictures drawn randomly from the entire pool of pictures. Each picture was presented at the center of the screen until participants provided a complete response to all variables. The task lasted approximately 10 to 15 minutes per participant. It is worth noting that although previous studies opted to use different groups of participants to collect norms of name agreement, visual complexity and conceptual familiarity (e.g., Alario & Ferrand, Reference Alario and Ferrand1999; Bonin et al., Reference Bonin, Peereman, Malardier, Méot and Chalard2003; Boudaki et al., 2016; Nishimoto et al., Reference Nishimoto, Miyawaki, Ueda, Une and Takahashi2005; Snodgrass & Vanderwart, Reference Snodgrass and Vanderwart1980; Tsaparina et al., Reference Tsaparina, Bonin and Méot2011), in this work we adopted a within-subject design as in other recent studies collecting ratings for pictorial stimuli (e.g., Brodeur et al., Reference Brodeur, Dionne-Dostie, Montreuil and Lepage2010; Cycowicz et al., Reference Cycowicz, Friedman, Rothstein and Snodgrass1997; Dimitripoulou et al., 2009; Moreno-Martínez, & Montoro, Reference Moreno-Martínez and Montoro2012). Asking participants to rate all the dimensions under study allowed us not only to have a higher number of valid responses per dimension (for example, in the Alario and Ferrand abovementioned study, from the total sample of participants, ratings for name agreement were only obtained from 28 participants, for conceptual familiarity from 30 participants, and for visual complexity from 29 participants), but importantly to control for the influence of inter-individual differences in the ratings. Note that in the studies using different groups of participants (e.g., Alario & Ferrand, Reference Alario and Ferrand1999; Bonin et al., Reference Bonin, Peereman, Malardier, Méot and Chalard2003; Boudaki et al., 2016; Nishimoto et al., Reference Nishimoto, Miyawaki, Ueda, Une and Takahashi2005; Snodgrass & Vanderwart, Reference Snodgrass and Vanderwart1980; Tsaparina et al., Reference Tsaparina, Bonin and Méot2011), the authors matched the different groups on variables such as sex and age, leaving aside other variables that could also potentially affect the results (e.g., educational level, socio-economic status). Thus a within design seems to be the best option, even considering that its use can also entail practice and fatigue effects, controlled, in our study, either by the use of only 50 pictures to be named/rated, and also by the random presentation of the stimuli (pictures and dimensions) across participants.
Results and Discussion
The EP norms for name agreement, concept familiarity, visual complexity and subjective frequency for the new set of 150 colored pictures can be downloaded as an Excel file from the web page of our research groupFootnote 3. Participants’ responses to the picture naming task were analyzed in order to determine the number (%) of Know, Don´t Know and TOT answers and to compute two measures of name agreement (NA) widely used in research: The percentage of participants producing the most common name (i.e., the modal name) and the H-statistic. H-statistic reflects the number of alternative names provided by the participants for each picture and is computed by using the following formula of Shannon (Reference Shannon, Shannon and Weaver1949), as used by Snodgrass and Vanderwart (Reference Snodgrass and Vanderwart1980) in their original work:
 $$H = \sum\nolimits_{i = 1}^k {{P_i}{{\log }_2}\left( {{1 / {{P_i}}}} \right)} \,.$$
where k represents the number of possible answers given and Pi the proportion of participants who assigned each name. Words with unambiguous spelling errors were recorded in their orthographically correct form and Don´t Know and TOT responses were not considered for computing NA measures (only the Know answers). The H measure is thought to be more informative than the percentage of NA as it captures the dispersion and distribution of responses provided by participants for each picture (e.g., Alario & Ferrand, Reference Alario and Ferrand1999; Bonin et al., Reference Bonin, Peereman, Malardier, Méot and Chalard2003; Dimitropoulou et al., Reference Dimitropoulou, Duñabeitia, Blitsas and Carreiras2009; Rossion & Pourtois, Reference Rossion and Pourtois2004; Snodgrass & Vanderwart, Reference Snodgrass and Vanderwart1980). For example, if only one name is given for a given picture, as is the case for picture 139. Pinça [tweezers] in the dataset, the H value corresponds to zero. If two names occur with equal frequency, the H value is 1, as is the case for picture 72, gaivota [seagull]. Hence, H statistics increases as the number of possible names increases, and generally decreases as the proportion of each response increases.
In the Excel file, the pictures are designed by the most frequent names assigned to them (modal name). Each picture is also numbered according to the name agreement (H) scores obtained, i.e. picture 1 bazuca [bazooka] corresponds to the picture rated with the lowest H score, while picture 150 zebra [zebra] corresponds to the picture rated with the highest agreement score in the dataset. For each picture, the following information is provided, starting from the leftmost column: number of the picture (PictureNumber); EP modal name (Modal namePortuguese); English translation of the EP modal name (Modal nameEnglish); Semantic category of the picture (Semantic Category) according to the 18 abovementioned categories (see Table 1); percentage of Know (%Know), Don’t Know (%DK), and TOT responses (%TOT); percentage of participants giving the modal name (NA_%); H-statistic for name agreement (NA_H); mean (M) and standard deviation (SD) for concept familiarity ratings (CFam_M and CFam_SD, respectively); mean and standard deviation for subjective frequency ratings (SubjFreq_M and SubjFreq_SD, respectively); mean and standard deviation for visual complexity ratings (VComplex_M and VComplex_SD, respectively). Additionally, information concerning the number of letters (N lett), the number of syllables (N syll), and the per million objective word frequency (ObjFreqpermillion) of the modal name of each picture is also provided whenever available from the P-PAL lexical database (Soares, Iriarte et al., Reference Soares, Iriarte, Almeida, Simões, Costa, França, Machado and Comesaña2014).
It is worth noting, that before computing the normative values presented in this work, several checks were carried out to ensure the integrity of the data. Specifically, besides admitting only the ratings of native-speakers of Portuguese, we excluded from the analyses any person who participated more than once in the rating task. In these cases, only the data from the first participation were taken into account. Recurring participation by the same participant was detected by the use of the same login (e-mail address) in different times and by crosschecking the socio-demographic information provided in the registration form. The norms presented here were based on a total number of 19,015 responses. Each picture was rated by a mean number of 212.11 responses (SD = 57.24; min. = 88, max. = 338). Note that since the large majority of the pictures in the dataset elicited a TOT response across participants (n = 125, 83.33%), with values ranging from a minimum of 0.59% (picture 116 tigre [tiger]), to a maximum of 52.75% responses (picture 57 fole [bellows]); and additionally that the ratings for conceptual familiarity, subjective frequency and visual complexity were only provided when participants reported knowing the object depicted by the picture (i.e., when a Know answer was provided), this causes the number of responses considered in the analyses to show some discrepancy across pictures. Nevertheless, the minimum number of responses achieved in our data per picture (n = 88) is still substantially higher than that reported in other pictorial datasets (e.g., Alario & Ferrand, Reference Alario and Ferrand1999; Bonin et al., Reference Bonin, Peereman, Malardier, Méot and Chalard2003; Boudaki et al., 2016; Brodeur et al., Reference Brodeur, Dionne-Dostie, Montreuil and Lepage2010; Moreno-Martínez, & Montoro, Reference Moreno-Martínez and Montoro2012; Snodgrass & Vanderwart, Reference Snodgrass and Vanderwart1980; Tsaparina et al., Reference Tsaparina, Bonin and Méot2011), thus proving strong support for the validity of the data. Table 2 presents the descriptive statistics for name agreement, subjective frequency, concept familiarity, visual complexity, and the percentage (%) of Know, Don’t Know and TOT answers for all the pictures in the dataset (N =150), as well the 25th [Ql] and 75th [Q3] percentiles to facilitate selection of stimuli based on the extreme values of the distribution.
Table 2. Summary of the Descriptive Statistics for Name Agreement (H-statistic and %), Subjective Frequency, Concept Familiarity, Visual Complexity, and Percentage of Know, Don’t Know and TOT Responses in the Dataset
Note: Concept Familiarity, Subjective Frequency, and Visual Complexity rated on a 5-point Lickert scale. Q1 = 25th percentile; Q3 = 75th percentile.
As shown in Table 2, the majority of the pictures elicited a Know response (88.04%), with 4.32% eliciting a Don’t Know response, and 7.65% a TOT answer. Only 16 pictures (10.67%) did not yield a Don’t Know or a TOT answer (e.g., picture 11 monitor [monitor]; 55 revólver [revolver]; 142 balão [balloon]), i.e. all generated Know answers followed by a valid picture naming response. Note that while the mean percentages of Know and Don’t Know answers are in line with those observed in previous works (e.g., Alario & Ferrand, Reference Alario and Ferrand1999; Bonin et al., Reference Bonin, Peereman, Malardier, Méot and Chalard2003; Boudaki et al., 2016; Nishimoto et al., Reference Nishimoto, Miyawaki, Ueda, Une and Takahashi2005; Snodgrass & Vanderwart, Reference Snodgrass and Vanderwart1980; Tsaparina et al., Reference Tsaparina, Bonin and Méot2011), the mean percentage of TOT responses is higher than the ones previously observed in other pictorial datasets either with black-and-white drawings, such as Snodgrass and Vanderwart (Reference Snodgrass and Vanderwart1980) work (0.7%) or with colored pictures, such as in the Brodeur et al. (Reference Brodeur, Dionne-Dostie, Montreuil and Lepage2010) work (2%). This result demonstrates, as expected, that in our dataset a large number of pictures elicited a TOT response, thus making these pictorial stimuli particularly suited for conducting studies in different areas of cognitive and neuroscientific research (e.g., perception, memory and language) that require the use of pictures which induce naming failures strongly, as in TOT experiments.
Regarding name agreement, the results obtained showed that 23 out of the 150 pictures (15.33%) yielded a single name, i.e. all participants agreed on the same name to designate the object depicted by the picture, thus presenting an H value of 0.00 and 100% of name agreement (e.g., picture 145 farol [lighthouse], picture 150 zebra [zebra]). Furthermore, 55 out of the 150 pictures (36.67%) yielded name agreement percentages ranging from 80% to 99%, 31 (20.67%) had percentages from 60% to 79%, 17 (11.33%) from 50% to 59%, and only 17 pictures (11.33%) had name agreement rating scores below 50%. Therefore, the distribution of the NA_% scores showed that the majority of pictures in the dataset presented high name agreement scores. The H-statistic scores ranged from 0.00 (only one answer provided, e.g., picture 129 coala [koala]) to 3.51 (picture 1 bazuca [bazooka], which presented the highest H score since participants gave 12 different designations for that picture - the highest number of different answer in the dataset). Nevertheless, the analysis of the H distribution (see Figure 1, Right panel), indicates that most of the pictures elicited a low number of alternative responses, with 78 pictures (52%), showing an H score below 1. Specifically, besides the 23 pictures that yielded a single name to designate the object depicted by the picture, 15 pictures elicited only one single alternative name (e.g., picture 124 mola [clothespeg], picture 127 pavão [peacock]); 11 elicited two alternative names (e.g., picture 67 alga [seaweed], picture 118 boina [beret]); 18 elicited three alternative names (e.g., picture 58 ostra [oyster], 70 hélice [propeller]); and 13 elicited four alternative names (e.g., picture 46 chita [cheetah], picture 56 coador [colander]). Therefore, the NA_% distribution is negatively skewed, while the NA_H statistic showed the reverse distribution, as expected. Figure 1 presents the histograms of the name agreement scores (NA_% and NA_H) observed in our dataset.
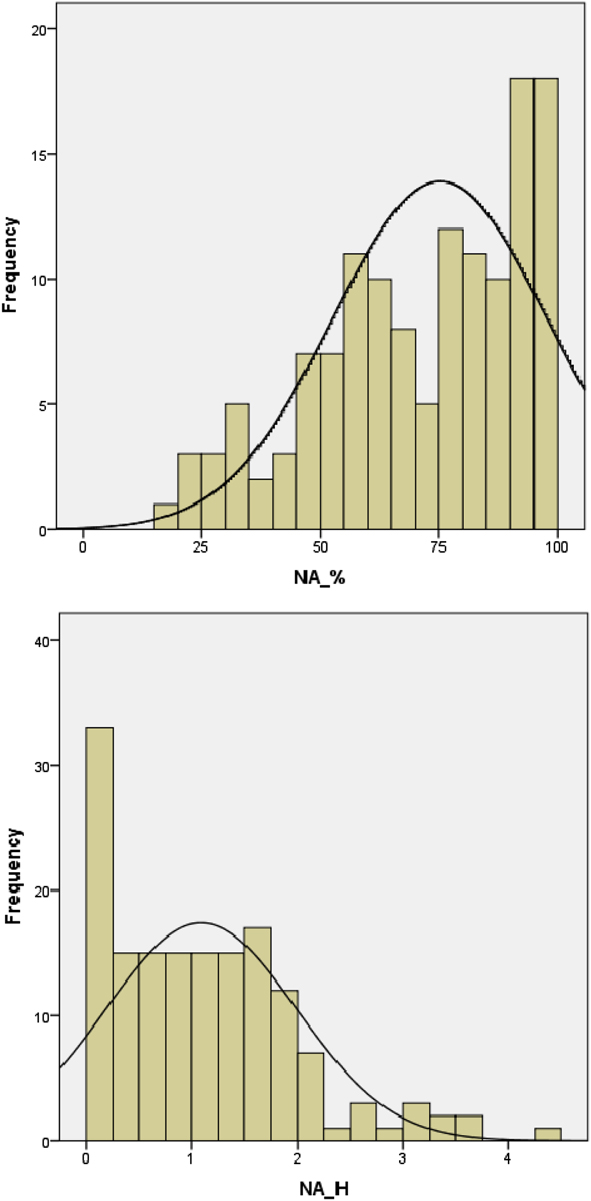
Figure 1. Histograms representing the distribution of the name agreement scores for the 150 pictures in the dataset. Left panel: percentage of participants giving the most common name (NA_%). Right panel: H statistic (NA_H).
As can be observed, they exhibited the typical asymmetric distribution observed in other pictorial datasets (e.g., Alario & Ferrand, Reference Alario and Ferrand1999; Bonin et al., Reference Bonin, Peereman, Malardier, Méot and Chalard2003; Dimitropoulou et al., Reference Dimitropoulou, Duñabeitia, Blitsas and Carreiras2009; Rossion & Pourtois, Reference Rossion and Pourtois2004; Snodgrass & Vanderwart, Reference Snodgrass and Vanderwart1980; Tsaparina et al. Reference Tsaparina, Bonin and Méot2011). However it is also important to note that the mean name agreement scores observed in our dataset (NA_% = 77.40%; NA_H = 0.98) are slightly lower than the ones previously observed in the original Snodgrass and Vanderwart dataset (1980) (NA_% = 88%; NA_H = 0.56), as well as in other pictorial datasets (e.g., Alario & Ferrand, Reference Alario and Ferrand1999: NA_% = 84.6%; NA_H = 0.36; Bonin et al., Reference Bonin, Peereman, Malardier, Méot and Chalard2003: NA_% = 77.36%; NA_H = 0.67; Dimitropoulou et al., Reference Dimitropoulou, Duñabeitia, Blitsas and Carreiras2009: NA_% = 87.6%; NA_H = 0.36; Rossion & Pourtois, Reference Rossion and Pourtois2004: NA_% = 90.26%; NA_H = 0.32; and Tsaparina et al., Reference Tsaparina, Bonin and Méot2011: NA_% = 80.6%; NA_H = 0.82). These findings suggest that although the majority of the pictures in our dataset present high name agreement scores, they also show greater variability in the number of responses given to name the pictures than in other pictorial datasets, which could be accounted for by the fact that in our dataset there is a great number of pictures inducing a TOT response, as noted earlier. In an attempt to prevent a naming failure (i.e., a TOT response), participants could simply have provided the best name that came to their minds (even while considering that the name provided could not be the most appropriate to designate the object depicted by the picture), thus increasing the H statistic in our data. For instance, pictures 6 bandolim [mandolin], 17 alecrim [rosemary], 30 fuso [spindle], and 62 pilão [pestle], which presented the highest % of TOT responses, also yielded a higher number of different responses. This interpretation is also supported by a significant positive correlation between the %TOTs and the NA_H scores (r = .36, p < .001) on the one hand, and a negative correlation between %TOTs and the NA_% scores (r = –27, p < .001) on the other. Nevertheless, it is also important to highlight that even though our name agreement scores are slightly below the ones provided by the abovementioned datasets, they are still above the NA values presented by other pictorial datasets (e.g., Boudaki et al., 2016: NA_% = 62.43%; NA_H = 1.13; Brodeau et al., 2010: NA_% = 64%; NA_H = 1.65; or Weekes et al., Reference Weekes, Shu, Hao, Liu and Tan2007: NA_% = 65%; NA_H = 0.97), that did not show an equivalent number of TOT responses. Thus, the relatively low NA values found in our database (particularly in the NA_H statistic) are not atypical in the literature. Moreover, we consider that in our dataset they arise clearly from the type of pictures that it integrates and that were intentionally selected to elicit TOT responses, and not from unfamiliarity with the objects depicted by the pictures.
Indeed, the concept familiarity ratings obtained are high (M CFam = 3.29), ranging from the minimum of 1.73 (picture 32 tiara [tiara]) to the maximum of 4.72 (picture 8 televisão [television]), thus showing that the objects depicted by the pictures in our dataset are highly familiar to the participants. Figure 2 presents the histogram representing the distribution of the conceptual familiarity scores in the dataset.
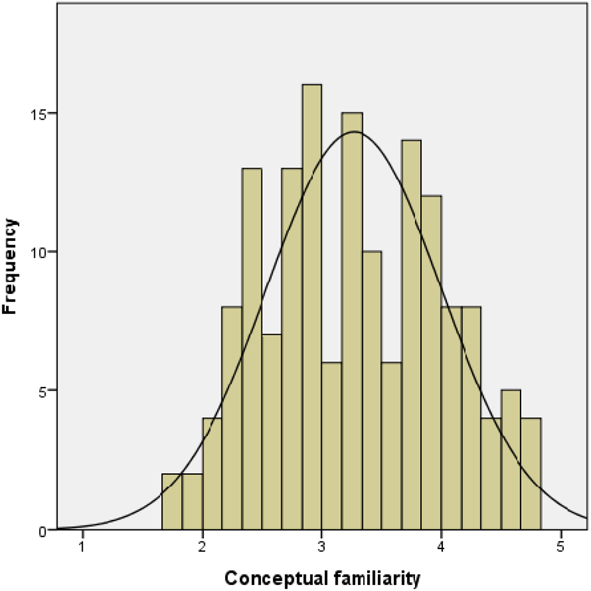
Figure 2. Histogram representing the distribution of the conceptual familiarity scores for the 150 pictures in the dataset.
The conceptual familiarity ratings obtained are similar to those obtained by Snodgrass and Vanderwart (Reference Snodgrass and Vanderwart1980) in their original study, and very close to the ones observed in other pictorial datasets (e.g., Alario & Ferrand, Reference Alario and Ferrand1999; Bonin et al., Reference Bonin, Peereman, Malardier, Méot and Chalard2003; Boudaki et al., 2016; Brodeau et al., 2010; Moreno-Martínez & Montoro, Reference Moreno-Martínez and Montoro2012; Rossion & Pourtois, Reference Rossion and Pourtois2004; Tsaparina et al., Reference Tsaparina, Bonin and Méot2011; Weekes et al., Reference Weekes, Shu, Hao, Liu and Tan2007), even though they showed higher name agreement scores and a lower % of TOT responses. This is an important finding since it seems to suggest that the relatively low NA scores in our dataset and the high number of TOT responses observed did not occur at a semantic level of processing. Instead, they seem to be associated with the relatively low ratings of frequency of use of the words that represent the concepts depicted by the pictures in participants’ daily life. Indeed, the inspection of the subjective ratings obtained showed that although the pictures in our dataset were rated as highly familiar, their names were rated as relatively unfamiliar, as most of the names showed scores below the medium point of the frequency scale used (M SubFreq = 2.71, Mdn = 2.54). For instance, pictures 16 castiça l[candlestick]), 24 seringa [syringe]), or 87 canti l[canteen]) were rated simultaneously as highly familiar but with low levels of use. This situation might therefore contribute to cause weaker connections between levels of processing in the speech production system (e.g., Burke et al, Reference Burke, Mackay, Worthley and Wade1991; Gollan et al., Reference Gollan, Slattery, Goldenberg, van Assche, Duyck and Rayner2011), thus eliciting more naming failures and an increased number of different responses to name the concept (i.e., increased H values and decreased name agreement scores). This explanation is also in accordance with the lexical account for the name agreement effect presented in the introduction section of this paper (e.g., Alario et al. Reference Alario, Ferrand, Laganaro, New, Frauenfelder and Segui2004; Barry et al., Reference Barry, Morrison and Ellis1997; Boukadi et al., Reference Boukadi, Zouaidi and Wilson2016; Cuetos et al., Reference Cuetos, Ellis and Álvarez1999; Shao, Roelofs, & Meyer, Reference Shao, Roelofs, Acheson and Meyer2014; Shao, Roelofs, Acheson et al., Reference Shao, Roelofs, Acheson and Meyer2014; Valente et al., Reference Valente, Burki and Laganaro2014; Vitkovitch & Tyrrell, Reference Vitkovitch and Tyrrell1995).
Moreover, it is also important to highlight here that although objective and subjective word frequencies tend to be strongly correlated, in our dataset that correlation was only moderately significant (r = –26, p < .01). In addition, the objective word frequency obtained from the P-PAL lexical database (Soares, Iriarte et al., Reference Soares, Iriarte, Almeida, Simões, Costa, França, Machado and Comesaña2014) did not correlate significantly either with the %TOT responses (r = –.082, p = 324) or with the % Known responses (r = .081, p = 333), as subjective frequency ratings did, as noted before. Thus, subjective frequency is an important variable to collect and to control for when conducting studies in different areas of cognitive and neuroscientific research with pictorial stimuli (e.g., language, perception, memory), since they might capture different dimensions of the in facto frequency of exposure to a given word in daily life (see Soares, Machado et al., Reference Soares, Machado, Costa, Iriarte, Simões, Almeida and Perea2015 for a discussion about the limitations of the use of objective word frequency measures as extracted from written corpora as in the P-PAL lexical database).
Finally, the results obtained for visual complexity, showed that the majority of the pictures in the dataset were rated with low levels of visual complexity, as 80 out of 150 pictures (53.3%) showed scores below 2.5 (the medium point of the 5-point Likert scale used). Specifically, the visual complexity values observed ranged from a minimum of 1.36 (e.g., picture 20 pêndulo [pendulum]) to a maximum of 4.21 (e.g., picture 21 catedral [cathedral]), with a mean value of 2.50 and a median value of 2.45. Only 29 pictures in the dataset (19.3%) presented scores above 3.0 (e.g., picture 31 colibri [hummingbird], picture 127 pavão [peacock]). Thus, in spite of using colored pictures that tended to be rated with high levels of visual complexity as they add color and texture elements to the pictures (e.g., Dimitripoulou et al., 2009; Brodeau et al., 2010; Moreno-Martínez & Montoro, Reference Moreno-Martínez and Montoro2012; Rossion & Pourtois, Reference Rossion and Pourtois2004; Tsaparina, et al., Reference Tsaparina, Bonin and Méot2011), the results obtained here showed clearly that the majority of pictures in our dataset were rated as visually simpler, and showed scores that are totally in accordance with those obtained in previous studies either with black-and-white drawings (e.g., Alario & Ferrand, Reference Alario and Ferrand1999; Bonin et al., Reference Bonin, Peereman, Malardier, Méot and Chalard2003; Rossion & Pourtois, Reference Rossion and Pourtois2004; Snodgrass & Vanderwart, Reference Snodgrass and Vanderwart1980) or with colored pictures (e.g., Dimitropoulou et al., Reference Dimitropoulou, Duñabeitia, Blitsas and Carreiras2009; Brodeau et al., 2010; Moreno-Martínez & Montoro, Reference Moreno-Martínez and Montoro2012; Rossion & Pourtois, Reference Rossion and Pourtois2004; Tsaparina, et al., Reference Tsaparina, Bonin and Méot2011). Moreover, the results observed for this dimension also showed that, as expected, the less visually complex an item is rated, the higher the name agreement scores it tends to produce, as indexed in our data by both a positive and significant correlation between visual complexity and the NA H-statistic (r = .33, p < .001), and by a negative and significant correlation between visual complexity and the % of name agreement scores (r = –.26, p < .001) (see Table 3). These findings confirm in our data, results already observed in other pictorial datasets (e.g., Bonin et al., Reference Bonin, Peereman, Malardier, Méot and Chalard2003; Dimitropoulou et al., Reference Dimitropoulou, Duñabeitia, Blitsas and Carreiras2009; Moreno-Martínez & Montoro, Reference Moreno-Martínez and Montoro2012; Tsaparina, et al., Reference Tsaparina, Bonin and Méot2011). Table 3 that presents the Pearson correlations observed among all the variables under study for the 150 pictures integrated in the dataset. It is worth noting that the previous inspections of the respective scatterplots showed the absence of obvious outliers that could have severely biased the results.
Table 3. Linear Correlations for Name Agreement (H-statistic and %), Subjective Frequency, Concept Familiarity, and Visual Complexity for the 150 pictures
Note: *. Correlation is significant at the 0.05 level (2-tailed); **. Correlation is significant at the 0.01 level (2-tailed); ns = nonsignificant.
Visual complexity also correlated negatively with subjective frequency (r = –.40, p < .001), and concept familiarity (r = –.46, p < .001), which is also well documented in the literature (e.g., Alario & Ferrand, Reference Alario and Ferrand1999; Bonin et al., Reference Bonin, Peereman, Malardier, Méot and Chalard2003; Boukadi et al., Reference Boukadi, Zouaidi and Wilson2016; Forsythe et al., Reference Forsythe, Mulhern and Sawey2008; Moreno-Martínez & Montoro, Reference Moreno-Martínez and Montoro2012; Snodgrass & Vanderwart, Reference Snodgrass and Vanderwart1980; Tsaparina et al., Reference Tsaparina, Bonin and Méot2011). Alario and Ferrand (Reference Alario and Ferrand1999) stated that these negative correlations determine a trend for pictures rated with high visual complexity scores to be less familiar than simpler pictures. However, since it is difficult to obtain a balanced distribution of stimuli in most studies, this statistical interpretation is somewhat problematic and can be considered equivocal (Forsythe et al., Reference Forsythe, Mulhern and Sawey2008). For instance, in the present study, only one picture presented ratings of visual complexity above 4.00 (picture 28 catedral [cathedral]). According to Forsythe and colleagues (2008), it seems that as the exposure to the concept increases (i.e., as the concepts become more familiar), the complexity of the stimuli becomes more difficult to estimate and to determine. The individual elements and details of the stimulus become less novel and therefore familiarity and visual complexity are easily confounded (Forsythe et al., Reference Forsythe, Mulhern and Sawey2008). In fact, Hirsh and Funnell (Reference Hirsh and Funnell1995) consider that this correlation occurs because concepts with higher levels of familiarity possibly have richer memory representations. Consequently, the number of details turns out to be less relevant for the recognition of the stimulus. Nevertheless, excluding the potential limitation of the lack of a normal distribution among quartiles, the correlation obtained is consistent with previous results, where higher visual complexity ratings are also associated with lower concept familiarity and lower subjective frequency ratings.
The inspection of Table 3 also shows that the two measures of NA (H-statistic and %) were highly and negatively correlated (r = –.94, p < .001), as expected. Moreover, subjective frequency and familiarity ratings were positively and highly correlated (r = .97, p < .001), showing that these two variables are very closely related. However, as mentioned before, both variables should be considered separately because they seem to capture different aspects of conceptual exposure (e.g., Balota et al., Reference Balota, Pilotti and Cortese2001; Boudaki et al., 2016; Desrochers et al., Reference Desrochers, Liceras, Fernández-Fuertes and Thompson2010; Soares et al., Reference Soares, Costa, Machado, Comesaña and Oliveira2017; Thompson & Desrochers, Reference Thompson and Desrochers2009). Indeed, although strongly correlated, familiarity correlates more strongly with the two measures of name agreement considered (r NA-H = –.24, p < .001; r NA-% = .20, p < .05) than subjective frequency, that only showed a significant correlation with the number of alternatives names to designate the object depicted by the picture (r NA-H = –.17, p < .05), thus suggesting that both constructs should not be interpreted as the same. Note that if the two constructs were a fair representation of the relative exposure to a concept they should correlate similarly with name agreement ratings, which is not the case. Nevertheless, the positive correlations between concept familiarity and subjective frequency ratings with name agreement measures (particularly the H-statistic), are also in line with the previous results observed in previous studies (e.g., Bonin et al., Reference Bonin, Peereman, Malardier, Méot and Chalard2003; Boudaki et al., 2016; Brodeau et al., 2010; Moreno-Martínez & Montoro, Reference Moreno-Martínez and Montoro2012; Tsaparina, et al., Reference Tsaparina, Bonin and Méot2011). These correlations (though only moderate) emphasize the fact that the more familiar and frequent a concept depicted by a picture is, the lower the number of different designations it tends to produce.
In conclusion, the present work represents the first study in EP that provides norms of name agreement, concept familiarity, subjective frequency, familiarity and visual complexity for a new set of 157 colored pictures that can be used in the design of research studies on cognitive psychology with EP participants, particularly those requiring pictures rated with high levels of name agreement and concept familiarly but low levels of subjective frequency (e.g., TOT studies). The results of the analysis conducted showed that the normative values provided here are in line with those observed in similar pictorial datasets (though with lower levels of name agreement scores due to the type of concepts selected to be depicted by the pictures), thus demonstrating that the norms presented here are valid and reliable to support EP research on all cognitive and neuroscientific fields using pictorial materials.


