INTRODUCTION
Parametric Rietveld refinement (Stinton and Evans, Reference Stinton and Evans2007) is a robust method for acquiring physical/chemical information of materials studied using 2D XRPD. A newly developed computer program “powder 3d parametric” (Rajiv et al. Reference Rajiv, Dinnebier and Jansen2010), in combination with the topas® launch mode (Coelho, Reference Coelho2007), has recently been introduced to perform fast sequential and parametric whole powder pattern fits (WPPF) of large number of powder patterns collected in 2D XRPD experiments. This paper presents a general demonstration of sequential and parametric WPPF performed using “powder 3d parametric,” followed by two applications of parametric Rietveld refinement that were accomplished with the help of the developed program.
The demonstration of sequential/parametric WPPF performed using “powder 3d parametric” is presented in Sec.III of the paper. The sample used in this demonstration is copper phthalocyanine (CuPC) XRPD data (Müller et al., Reference Müller, Dinnebier, Jansen, Wiedemann and Plueg2010) measured in a time-dependent manner (isothermal data) at a synchrotron source. This sample is one among several time-dependent data of CuPC polymorphs and CuPC polymorph-additive mixtures (Table II) that were measured with the objective of studying their reactions kinetics using the parametric Rietveld refinement method. In such time-dependent experiments, the simultaneously varying weight fractions of the polymorphs with time contain the reaction kinetic information (e.g., the reaction rate constant k). These information were extracted during the multiphase Rietveld analysis, by parameterizing the weight fractions (Hill and Howard, Reference Hill and Howard1987) of one of the phases of the polymorphic CuPC [as explained in Mülleret al. (Reference Müller, Dinnebier, Jansen, Wiedemann and Plueg2010)] with the well known Avrami equation, a function of reaction rate constant k and a constant n (Avrami, Reference Avrami1939; Avrami, Reference Avrami1941; Farjas and Roura, Reference Farjas and Roura2006; Malek and Mitsuhashi, Reference Malek and Mitsuhashi2000). The set of rate constants (Table II), derived from the Avrami model at various temperatures can be used to determine the activation energies of the reactions. The summary of kinetic analysis performed using parametric Rietveld refinement on several CuPC data measured in dependence on time is provided in Sec.IV.
Similar analyses on CuPC were formerly performed by M. Müller et al.(2010), in which the reaction kinetic information (k) of CuPC polymorphs was extracted using the full quantitative sequential Rietveld analysis and an Arrhenius type of relation (Iordanova et al.,Reference Iordanova, Lefterova, Uzunuv, Dimitriev and Klissurski2002). In this paper, the rate constants (k) obtained from the literature (Müller et al.,Reference Müller, Dinnebier, Jansen, Wiedemann and Plueg2010) and those derived from the Avrami model are compared; the discrepancies between the two results are briefly discussed.
The final part of the paper (Sec.V) presents a basic demonstration of the parameterization of the crystallite size variation with respect to the annealing time/temperature. The temperature dependent nanocrystalline titanium dioxide (TiO2) data are used as examples. The variation of the crystallite size (inversely related to the FWHM of the phase peaks) with respect to temperature for some selected data samples could be parameterized by a general third order polynomial.
THE PROGRAM
All the refinements required for the two applications were performed in the launch mode of the topas software, where the set of instructions necessary to perform a WPPF is entered in a text file (input or *.inp file) and passed to the topas kernel for execution.
The kinetic analysis of CuPC required about 19 independent isothermal data to be treated with sequential and parametric Rietveld refinements (Table II); each data consists of an average of about 140 powder patterns measured at various fixed temperatures. The parameterization of the crystallite size of TiO2 required 90 temperature-dependent powder patterns to be refined sequentially and parametrically. This analysis also required several models of crystallite size to be tested before arriving at the optimal.
The flexible macro language of topas can be used in several ways to conveniently modify an existing variable or to introduce a model of the existing variable or to introduce a new variable etc., during the refinement. However, manual modification of the topas statements, and the preparation (and execution) of the input files, and manual organization of the refined output variables for the analyses involving numerous powder patterns (as in the present case) is a monotonous and time consuming task. The program “powder 3d parametric” has therefore been used in the preparation and execution of all the input files used in the sequential and parametric refinements and also in some graphical presentations related to the two applications. The program offers a GUI platform for quicker and easier preparation and execution of the input files and also supports parametric refinements involving several trials with different variable models used in each trial (as in the case of the crystallite size analysis, Sec.V). The program uses the topas launch mode only as a kernel where the “math” parts of the refinements are performed.
A CASE STUDY
In this section, the WPPF of a single powder pattern (denoted “test” WPPF/refinement), the sequential refinements, and the parametric refinement in relation to the isothermal kinetic analysis of CuPC performed using the program are demonstrated. The procedure for the sequential refinements associated with the crystallite size analysis is the same as that described in this section. (For the “parametric crystallite size” analysis, the required input files were prepared using the program, but the prepared files are executed in the topas GUI mode.)
The sample used in this case study (denoted test-sample) is a mixture containing the α and β phases of CuPC in the ratio of 9:1 at the onset of the experiment. The experiment was performed in dependence on time at a constant temperature of 270 °C. In total, 35 powder patterns were collected in this experiment.
A single refinement
Prior to the sequential/parametric refinements, powder 3d parametric obliges the user to perform the test refinement of a single powder pattern in the data. The pattern used in the test refinement is usually the one measured at the lowest time step (or temperature) or the pattern from which the user wishes to begin the sequential refinements.
The input file required to refine the test pattern can be built using the text editor interface provided by the program (Figure 1). Some of the topas macro commands and the keywords that make up the input file can be conveniently loaded into the editor with the help of various widget tools supplied by the program. (Alternatively, a previously prepared input file can be copied/loaded to the text editor.)
After loading the required topas commands into the text editor, the test refinement can be started by prompting the appropriate key provided by the text editor GUI of the program. The results of the test refinement (the convergence plot and the refined variables) will be gathered from the output file (“test.out”) returned by topas kernel and will be displayed
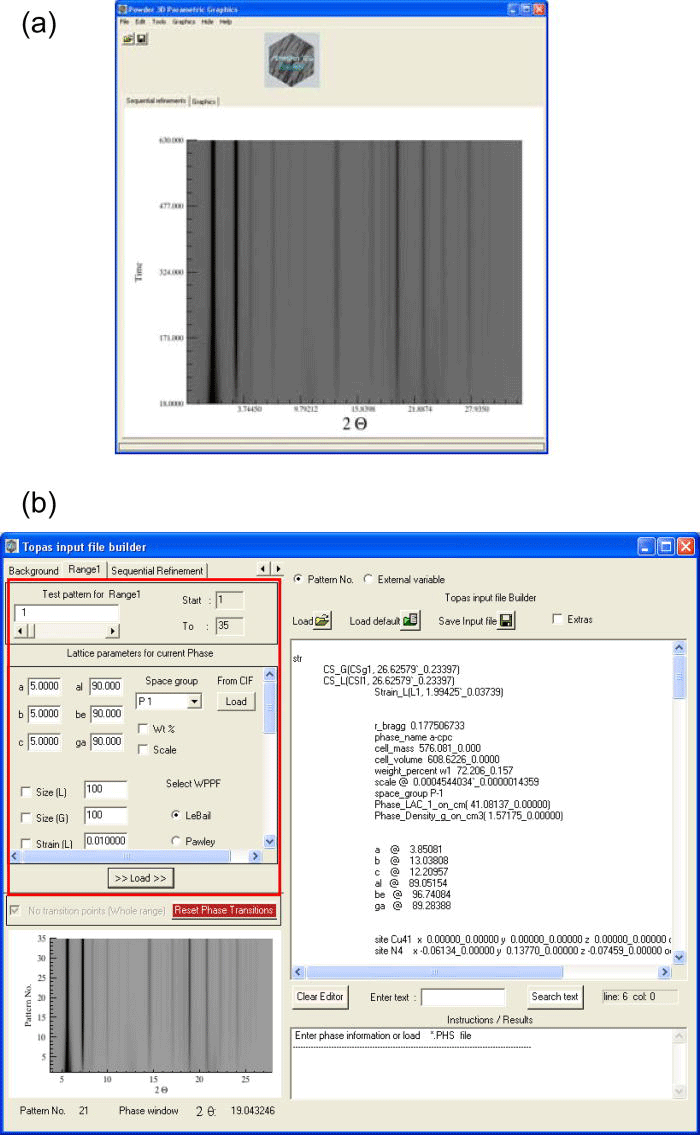
Figure 1.(Color online) (a) The time-dependent simulated “heating Guinier film” plot of the test-sample loaded in the main graphics window is presented (Hinrichsen et al., Reference Hinrichsen, Dinnebier and Jansen2006). (b) The editor interface used for building TOPAS “*.inp” file is shown. The plain text editor is at the right; widget tools used for loading the TOPASkeywords into the editor are highlighted at the left by a rectangular frame.
in a separate interface. The user is allowed to inspect and modify the variable values and their refinement flags and repeat the test refinement until acceptable convergence is reached. After attaining a satisfactory convergence, the user is prompted by the program to store the “test.out” file.
Sequential refinement
Before starting the sequential refinements, all the variables refined in the test refinement are gathered from the stored output file and listed in an interface [Figure 2a]. The user must check the variable names, their scopes, and their refinement flag statuses to be used in the sequential refinements. This interface also provides an option to store the sequentially refined variables and their errors in the form of a table, which can be analyzed later using the existing commercial worksheets.
Once the variable names are confirmed and their scopes and their refinement flags are set, the program automatically prepares and executes the input files required for the subsequent refinements of all the powder patterns.
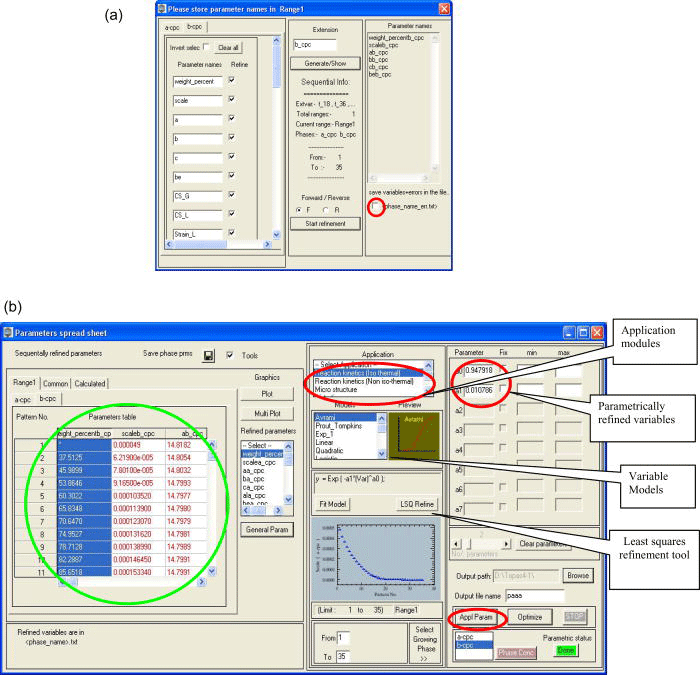
Figure 2.(Color online) (a) “Variable name/flag” interface. The dark circle at the bottom indicates the option to store the refined variables and errors as a table. (b) Some important functions of the “parameters worksheet” are explained in detail. The tools that are relevant to the presented paper are highlighted with circles. The variables obtained in sequential refinements are displayed in the left part of the worksheet (circle).
At the end of all the refinements, the variables refined in each cycle (which were saved beforehand as text files) will be read, sorted, and loaded in a worksheet as in Figure 2b (denoted “parameters worksheet”). All the refined variables loaded in the “parameters worksheet” [Figure 2b] can be plotted or parameterized by any suitable model provided by the program or by any user-defined functions.
The variables of interest for the reaction kinetics analysis are the weight fractions of the α-β-CuPC phases; these parameters are simultaneously plotted against the time axis at the end of the refinements [Figure 3a]. The weighted residuals (r_wp) of the consecutive refinements can also be plotted optionally [Figure 3b], which helps the user to select only the data measured within a particular time span to be used in parametric refinement.
Parametric refinement
Parametric Rietveld refinement associated with kinetic analysis can be started after selecting the module “Reaction kinetics-Iso thermal” and an appropriate model (Avrami) from their respective lists provided in the “parameters worksheet” [Figure 2b]. The program both prepares and executes the input file (denoted “parametric input file”) containing the set of instructions needed to perform parametric Rietveld refinement.
The topas “input file” necessary for the refinement of a single powder pattern consists of two parts (Stinton and Evans, Reference Stinton and Evans2007): The first part contains the statements that are common to all the measured patterns (e.g., wavelength, instrumental parameters, Lorentz-polarization factor, convolution step, etc.). The second part (denoted “phase” part) contains the statements that are specific to the measured powder pattern or a particular phase of the compound, if the
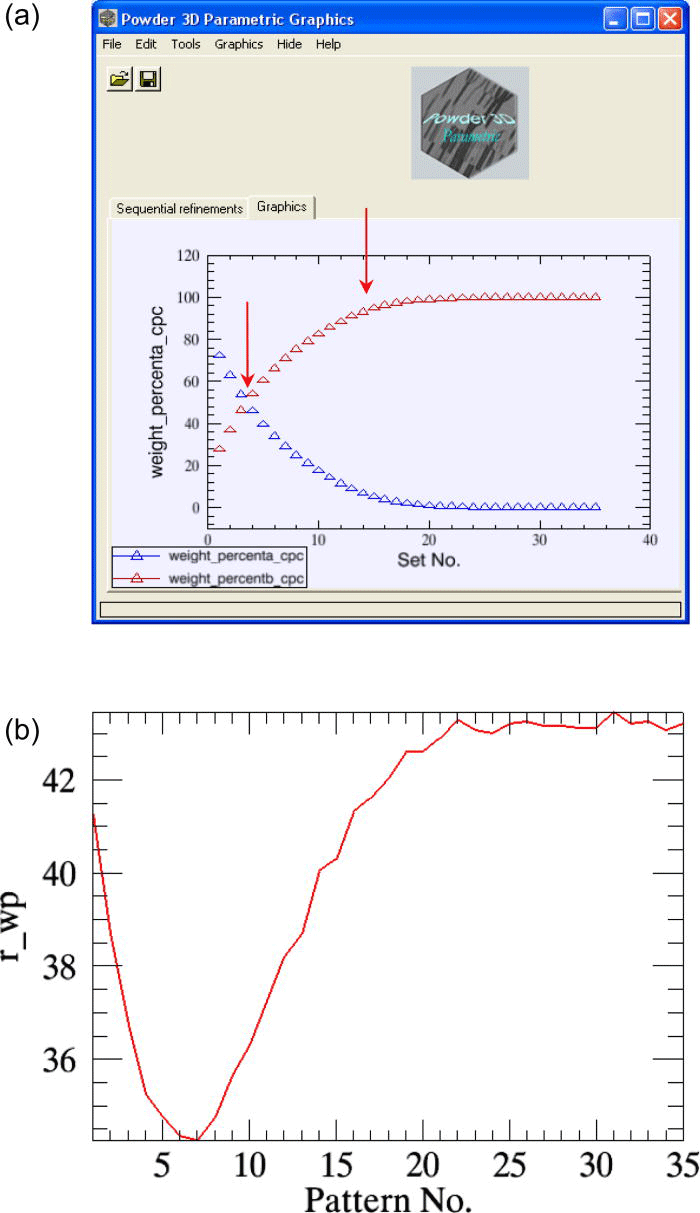
Figure 3.(Color online) (a) The sequentially refined weight fractions of the decaying α-CuPC and the growingβ-CuPC of the test-sample are plotted in the “graphics interface”. (b) The weighted residuals r_wp (scaled by a factor of 80) of the sequential refinements are plotted.
compound is a mixture. (e.g., the lattice parameters, crystallite size, scale factor, weight fraction, etc.).
For performing multiphase Rietveld refinement of a single powder pattern, the “phase” part of the input file must contain the topas keyword “scale,” which encodes a rewritten form of Eq. 1. (Hill and Howard, Reference Hill and Howard1987). During refinement, the “scale” keyword conveys to the topas kernel that the scale factor of a given phase of the compound containing m phases must be calculated from

where x α is the weight fraction of a phase α in a mixture of m phases, which can be parameterized by the Avrami equation: (1-exp(-(kt)n)), with k as the reaction rate constant and n as Avrami constant. “t” is experimental time, (S, M, V)α,β,γ are the scale factors, unit-cell masses, and unit-cell volumes of the phases α, β, and γ.
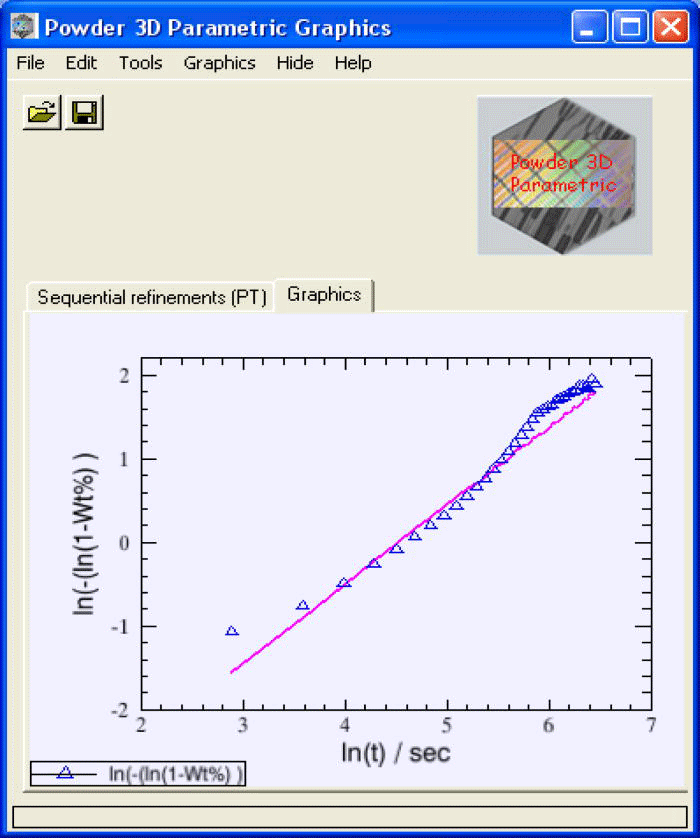
Figure 4.(Color online) The (linearized) sequentially refined weight fractions of the emerging β-CuPC (diamonds) of the test-sample and the parametrically refined weight fractions of β-CuPC (line) are plotted in the graphics interface.
The input file associated with parametric Rietveld refinement must contain one common part (same as the file used in the refinement of a single pattern) and as many “phase” parts as the number of powder patterns that will be used in the refinement. Each of these “phase” parts must contain a form of Eq. 1. or the keyword “scale.”
The program makes use of the output file stored after the test refinement and places Eq. 1. or substitutes the keyword “scale” with Eq. 1. in the “phase” parts (e.g., in the phase α-CuPC) of the file as many times as the numbers of patterns selected by the user. Before replacing the keyword “scale,” Eq. 1. would be rewritten in such a way that S α is at the left hand side and the Avrami equation is in place of the weight fraction x α (Müller et al.,Reference Müller, Dinnebier, Jansen, Wiedemann and Plüg2009).
The codes necessary to parameterize the weight percent with Avrami equation is thus automatically generated by the program and written in the large input file and executed in the topas launch mode kernel.
After the completion of the refinement, the linearized weight fractions of the emerging phase (in this case β-CuPC) obtained from sequential refinements and the weight fractions refined from the model (Avrami) will be plotted together in the main graphics interface of the program (Figure 4). The parameters n and k refined from the Avrami model will be read from output file returned by topas and will be displayed in the parameters sheet.
Analysis
The kinetic parameters n and k of the test-data derived from the Avrami model and those determined from the sequential refinement (Müller et al.,Reference Müller, Dinnebier, Jansen, Wiedemann and Plueg2010) are presented in Table I.
TABLE I. The Avrami parameters (k, n) obtained from sequential refinements (Müller et al.,Reference Müller, Dinnebier, Jansen, Wiedemann and Plueg2010) are compared with those obtained from the parametric refinement (third column). The parameters in the fourth column are refined from the powder patterns that correspond approximately to the linear region (optimal time-segment) of the weight fraction curve [Figure 3b].
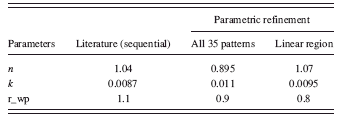
The overall weighted residual for the parametric fit using all 35 patterns is ∼0.869. The aberrations in the parameters n and k (Table I, column 2) are minimized when the powder patterns that correspond to the linear part of the weight fraction curve alone is used in the parameterization [the two cases are compared in Figures 5a and 5b].
The slight variation of n and k (in Table I, column 4) from the expected values (in Table I, column 2) is due to the exclusion of crystallite size effects in the original refinements from literature (Müller et al., Reference Müller, Dinnebier, Jansen, Wiedemann and Plueg2010).
The isothermal data for all the CuPC polymorphs collected in various experiments (Table II) were analyzed in a similar manner with the help of the program. The comparison of the rate constants and the activation energies determined
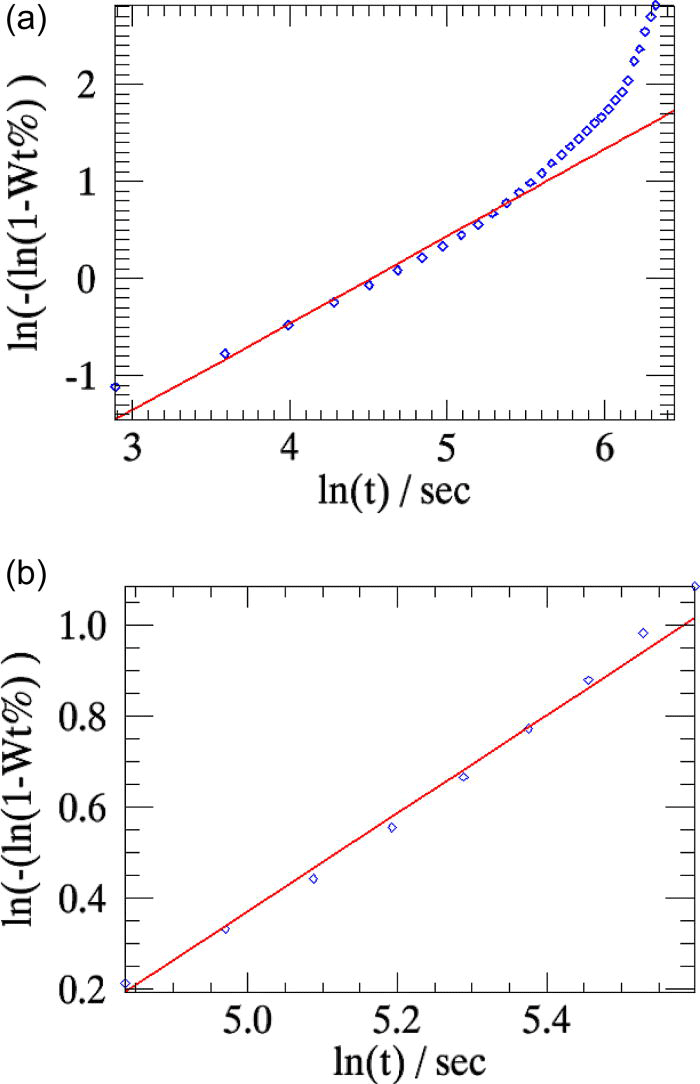
Figure 5.(Color online) The linearized weight fractions of the emerging β-CuPC phase obtained in sequential refinements (squares) and in parametric refinements (line) for the test-sample are compared. (a) All 35 powder patterns are included in parameterization. (b) Only the patterns from indices 7 to 15 are used in the parameterization [Figure 3a].
from sequential and parametric refinements and the explanations for the discrepancies between the results are presented in the following section.
RESULTS OF PARAMETRIC RIETVELD ANALYSIS OF THE KINETICS OF COPPER PHTHALOCYANINE
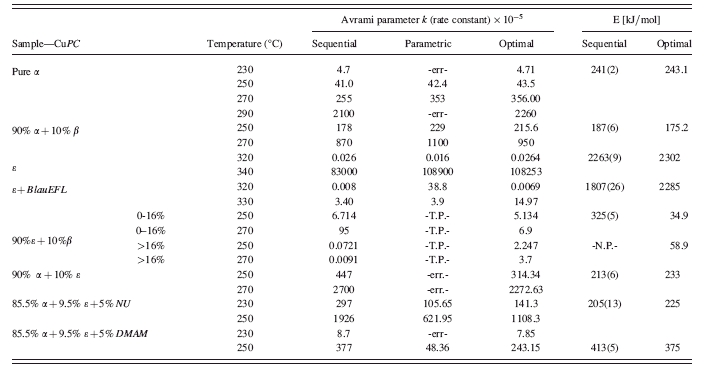
Table II summarizes the reaction kinetics studies performed on several isothermal data of CuPC polymorphs using sequential and parametric Rietveld refinement methods. The reaction rate constants and the activation energies obtained from parametric refinements for some selected CuPC samples are individually interpreted from Sec.IV A to Sec.IV C.
Pure α-CuPC
The kinetics of phase transition from pure α-CuPC (containing no additives) to β-CuPC has been studied using the time-dependent powder data collected at temperatures 230, 250, 270 and 290 °C.
Pure α-CuPC at 230 °C
In the experiment performed with pure α-CuPC at 230 °C, a total of 348 time-dependent powder patterns were collected. Parametric Rietveld refinement could not be successfully performed for this sample when all the 348 powder patterns collected in the experiment were included in the refinement.
The weight fractions of the simultaneously decaying α-CuPC and emerging β-CuPC phases in this experiment performed at 230 °C as determined from sequential Rietveld refinement are plotted in Figure 6a. As observed in Figure 6a, the change in the weight fractions of β-CuPC with respect to the experimental time is extremely low until 18 min from the beginning of experiment [approximately up to pattern number 60 (Müller et al.,Reference Müller, Dinnebier, Jansen, Wiedemann and Plueg2010)]. The stability of the refinement is strongly biased in this case, due to the inclusion of many patterns with significantly low weight fractions in the parametric refinement.
Using only the patterns recorded after the initiation of the reaction (between pattern number 60 and 348) in the parametric refinement [shown in Figure 6b] has resulted in its convergence and also produced a precise rate constant [comparable to the literature (Müller et al., Reference Müller, Dinnebier, Jansen, Wiedemann and Plueg2010)]. The reliability of rate constant is maintained when the powder patterns collected after 60 min of the start of experiment alone were used in the refinement [approximately between pattern number 200 and 348, Figure 6c].
Pure α-CuPC at higher temperatures
The weight fractions of the decaying α-CuPC and growing β-CuPC phases in experiments performed at 250 and at 270 °C as determined from sequential refinements are plotted in Figures 7a and 7b. As can be seen, pure α-CuPC starts reacting faster at temperatures higher than 230 °C.
The convergence of parametric Rietveld refinements (using all the powder patterns) of pure α-CuPC measured at temperature 250 °C could be easily achieved even without supplying a suitable starting value for the variable k. For this
TABLE II. The reaction rate constants (k) and the activation energies (E) of the polymorphs and polymorph-additives mixtures of CuPC determined from sequential (bold lettered) and parametric Rietveld refinements are presented. The temperatures at which various time-dependent experiments were performed are listed in the second column. The data measured at these temperatures are subjected to independent sequential and parametric Rietveld refinements. “Optimal” (italic letters) denotes that the rate constants and activation energies are found from parametric refinements using the powder patterns that correspond to the linear region of the weight fraction of the growing phase [Figure 3a and Figure 5b]. “-err-” indicates an unexpected error due to numerical instability during refinement. “-N.P-” sequential refinement not performed in literature (Müller et al.,Reference Müller, Dinnebier, Jansen, Wiedemann and Plueg2010). “-T.P-” indicates that two sets of parametric refinements have been performed for the sample. DMAM: a CuPC derivative. NU: Naphthyl derivative. BlauEFL: the commercial form of ɛ-CuPC.
data, even the use of fewer powder patterns in the refinement, provided they correspond to the linear region of the weighted residual curve [Figure 7c], could produce precise values of the variables k and n [consistent with the literature (Müller et al., Reference Müller, Dinnebier, Jansen, Wiedemann and Plueg2010)].
The weight fractions of β-CuPC obtained in the two cases (at 250 °C) are compared with the linearized weight fractions determined from sequential refinements in Figure 8. The overall weighted residual in the parametric refinement involving the powder patterns that correspond to the linear region of the weighted residual curve is slightly lower (∼0.94) than that obtained when all the 224 patterns collected in the experiment are used in the refinement (∼1.01).
For the same sample measured at 270 °C, the linearized weight fractions of the emerging β-CuPC determined using sequential refinements and the weight fractions derived from parametric refinement are plotted in Figure 9.
The rate constants k derived from the Avrami model, in all the experiments involving the transformation of pure α-CuPC (from temperatures 230 to 290 °C) to β-CuPC are plotted as an Arrhenius type of plot (Iordanova et al., Reference Iordanova, Lefterova, Uzunuv, Dimitriev and Klissurski2002) in Figure 10. The slope of the regression line fitted to these rate constants gives the activation energy of the reaction (for pure α-CuPC, the activation energy is ∼243 kJ/mol).
α-CuPC and β-CuPC
The kinetics of transformation of the mixture containing α and β phases of CuPC in the ratio 9:1 to β-CuPC was studied from their time-resolved data collected at temperatures of 250 and 270 °C. The weight fractions of the emerging β-CuPC determined from parametric refinements for one of these experiments (performed at 250 °C) is plotted in Figure 11. The weight fractions of the same mixture measured at 270 °C are plotted in Figures 5a and 5b.
As inferred from Table II, the addition of β-CuPC to pure α-CuPC has increased the rate constant k of the experiments performed at 250 and 270 °C by a factor of about 3. The activation energy of this reaction, derived from the parameterized rate constants, is about 175 kJ/ mol, which is about 70 kJ/mol smaller than the energy of the reactions involving pure α-CuPC.
α-CuPC and ɛ-CuPC and additives
α-CuPC and ɛ-CuPC
The kinetics of phase transition of α-CuPC +ɛ-CuPC mixture (in the ratio 9:1) to β-CuPC was studied from their time-resolved data collected at temperatures 250 and 270 °C. The weight fractions of the three phases involved in these experiments, determined from sequential refinements, are plotted in Figure 12.
Parametric refinement of α-CuPC +ɛ-CuPC mixture could be performed only for the data collected at the temperature 250 °C. For this data, the powder patterns that correspond to the linear region alone were used in this refinement (patterns 12–50 out of 184). The weight fractions of β-CuPC derived from parametric refinement are compared
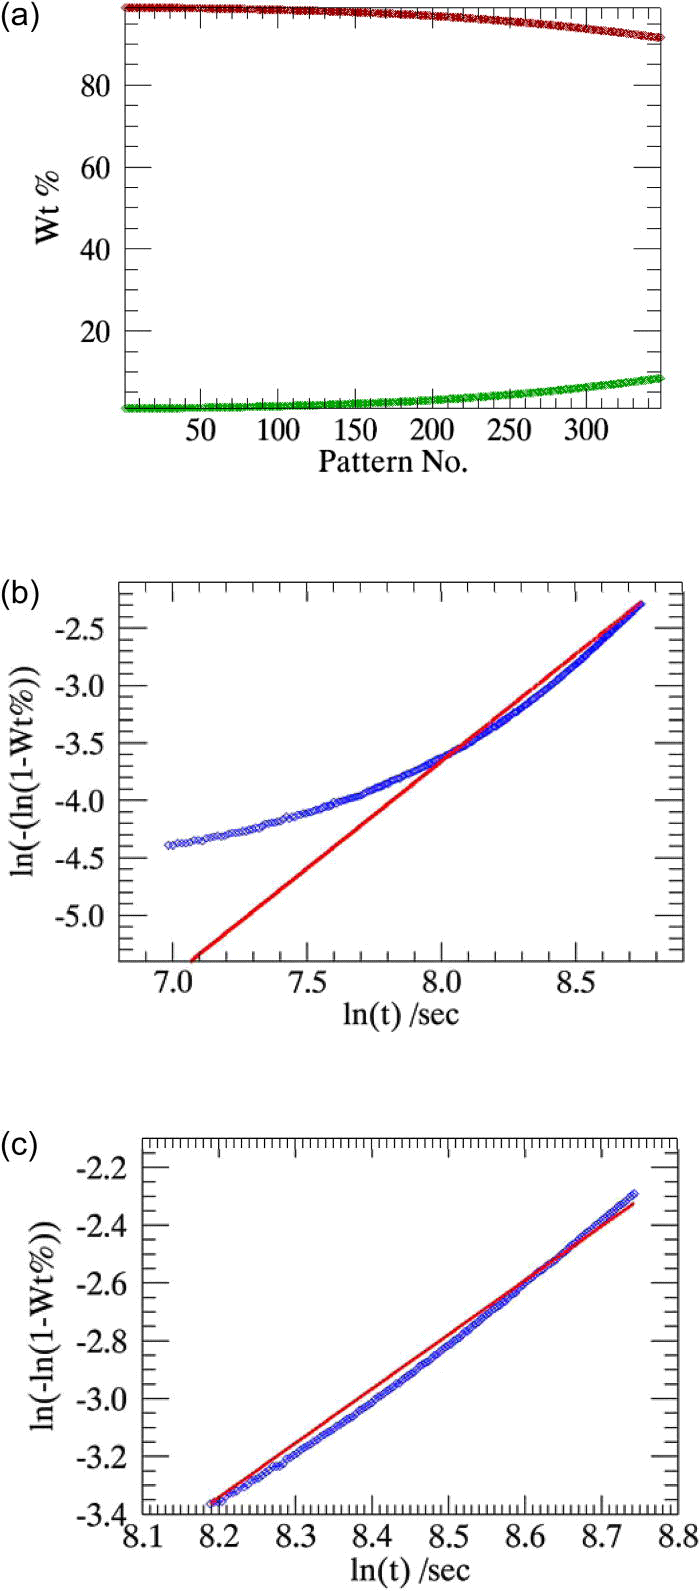
Figure 6.(Color online) (a) Weight fractions of the simultaneously decaying α-CuPC and the emerging β-CuPC at 230 °C, determined from sequential refinements. (b) and (c) Weight fractions of β-CuPC determined from sequential refinements (squares) compared with the weight fractions determined from parametric refinements (lines). (b)The powder patterns collected after 18 min from the beginning of the experiment are used in the refinement (pattern numbers 60 to 300). (c) The powder patterns collected 60 min after the beginning of the experiment are used in the refinement (pattern numbers 200 to 300).
with the linearized weight fractions obtained in sequential refinements (Figure 13).
For the data collected at the temperature 270 °C, parametric refinement ended up in a huge standard deviation
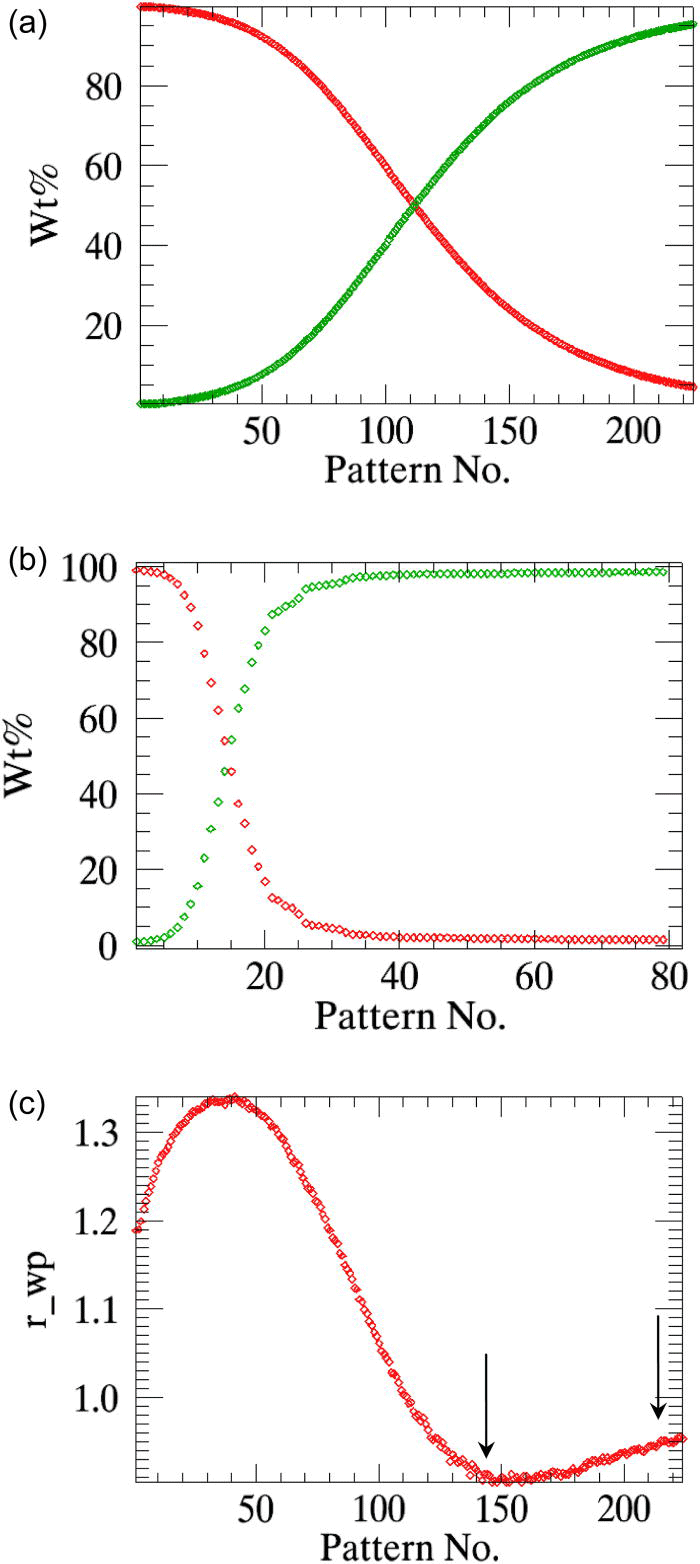
Figure 7.(Color online) Weight fractions of the decaying α-CuPC and the emerging β-CuPC at 250 and 270 C determined from sequential refinements are plotted in (a) and (b). Weighted residuals of the sequential refinements of pure α-CuPC data measured at 250 °C are plotted in (c). The linear part of the residual curve is marked with arrows.
[compared to the literature (Müller et al., Reference Müller, Dinnebier, Jansen, Wiedemann and Plueg2010)], even after using the powder patterns that belong to the linear region and supplying sensible starting values for the variables k and n. The α-CuPC present in the α-ɛ mixture was completely transformed into β-CuPC in approximately 3.6 min from the beginning of the experiment [Figure 12b]. The high reactivity of the α-CuPC + ɛ-CuPC mixture at 270 °C has strongly influenced the convergence of parametric refinement and also the precision of activation energy of the reaction determined using the Avrami model (∼233 kJ/mol).
The success of parametric refinement for the transformations involving ɛ-CuPC and BlauEFL and also the other
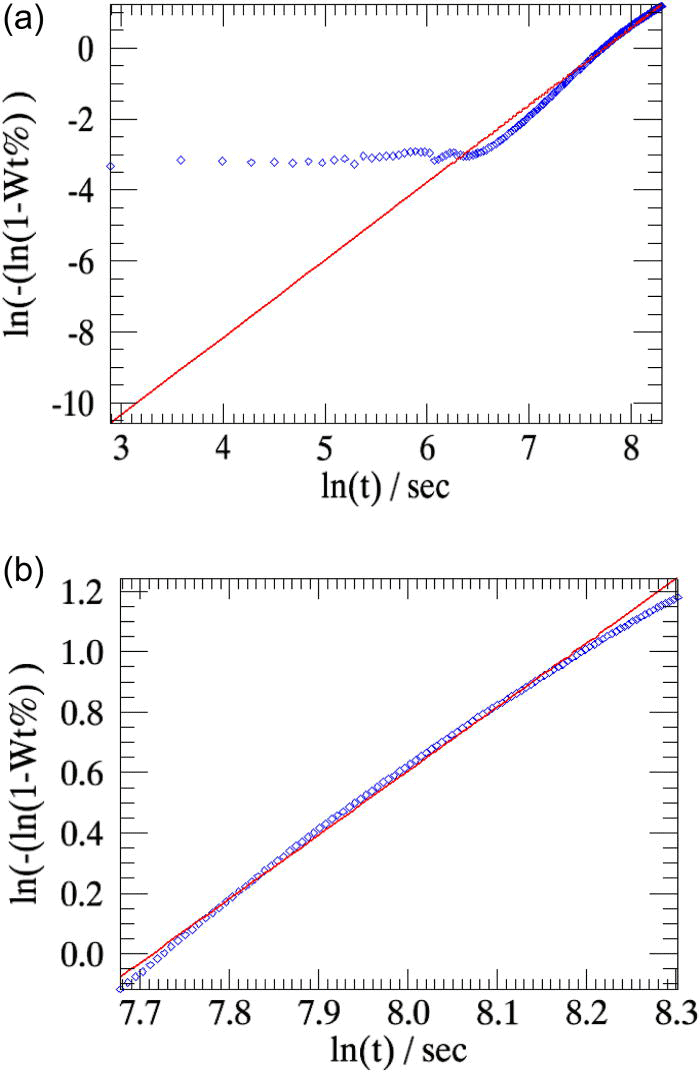
Figure 8.(Color online) The linearized weight fractions of β-CuPC in the transformation from pure α-CuPC to β-CuPC at 250 °C from sequential refinements (diamonds) are compared to those obtained from parametric refinements (lines). (a) All the 224 powder patterns collected in the experiment are used in the parametric refinement. (b) The powder patterns that correspond to the linear region of the weighted residual curve [Figure 7c] alone are used in the refinement.
measurements involving the transition of most ɛ-CuPC samples with additives and the reaction involving three phases of CuPC (e.g., α-CuPC + ɛ-CuPC to β-CuPC) depended strongly on the physical sensibility of the starting value of the rate constant (k). In most of these cases (dependent on the reaction order), the starting value for the parameter k was approximated from the half-life decay equation of a first order reaction. For other samples, the coefficients obtained in the least squares fit to the linearized weight fraction were used as the starting values.
PARAMETERIZATION OF MICROSTRUCTURAL INFORMATION: CRYSTALLITE SIZE VARIATION WITH TEMPERATURE
In this section, a general procedure to parameterize the crystallite size variation with respect to the temperature is presented. The nanocrystalline titanium dioxide (TiO2)-anatase data measured in dependence on temperature are used as examples. This application is considered a case study to prove that the parameterization of the crystallite size (inversely proportional to the FWHM of the phase peaks) versus time/temperature is feasible.
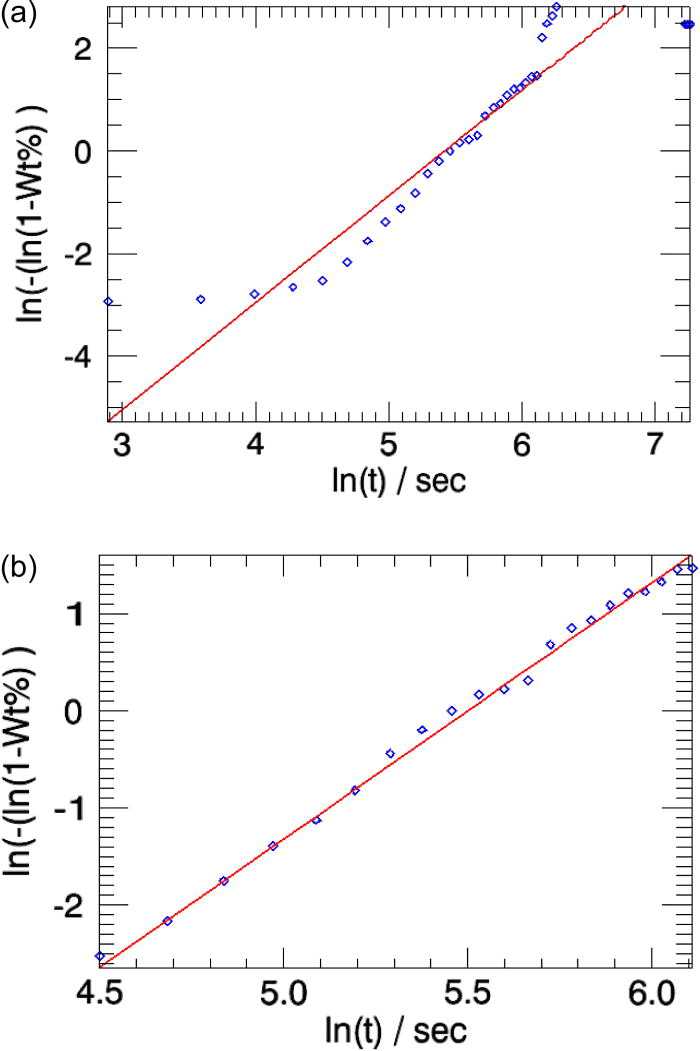
Figure 9.(Color online) The linearized weight fractions of β-CuPC in the transformation from pure α-CuPC to β-CuPC at 270 °C, in sequential (diamonds) and parametric refinements (lines) are plotted. (a) All the 79 powder patterns collected in the experiment are used in the parametric refinement. (b) The powder patterns that correspond to the linear region of the weighted residual curve (pattern numbers 5–25) alone are used in the refinement.
All the input files required for this analysis were prepared with the help of the program “powder 3d parametric” (Sec.III).
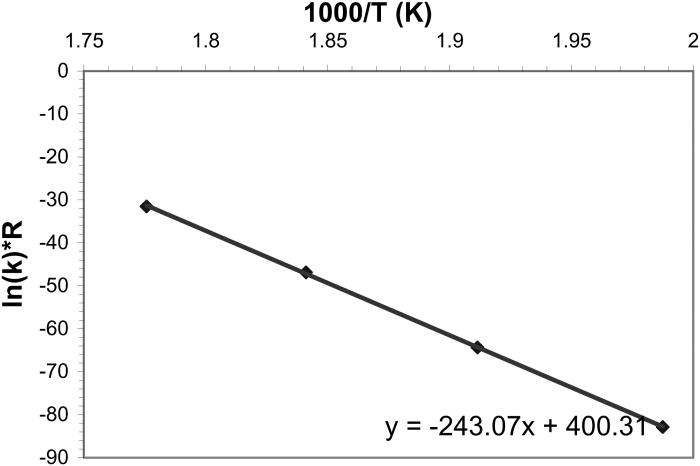
Figure 10. The rate constants of the reaction involving the transformation from pure α-CuPC to β-CuPC as derived from Avrami equation are plotted as an Arrhenius type plot. Linear fit has been made to these points. The slope of the regression line gives the activation energy of the reaction.
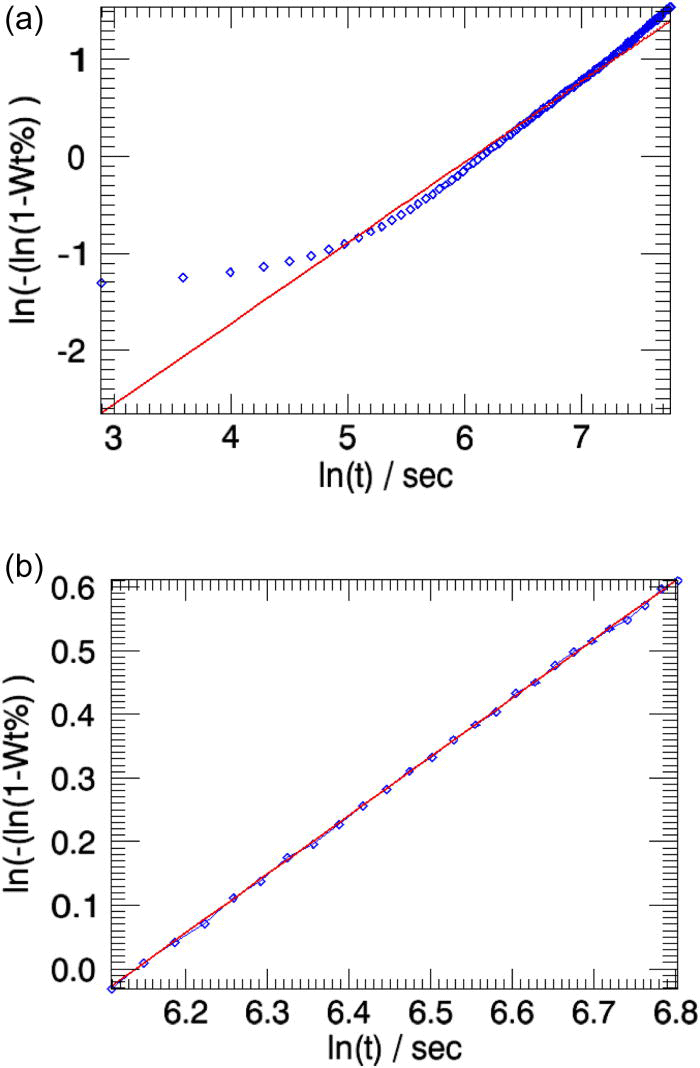
Figure 11.(Color online) The linearized weight fractions of β-CuPC in the transformation of α-CuPC + β-CuPC mixture at 270 °C, from sequential (diamonds) parametric refinements (lines) are shown. (a) All the 130 powder patterns collected in the experiment are used in the parametric refinement. (b) Only the powder patterns that correspond to the linear region of the weighted residual curve (∼pattern numbers 25–50) alone are used in the refinement.
Crystallite size
The major sources of peak broadening in XRPD are the microstructure of the material (crystallite size and lattice strain) and the instrumental aberrations. In Rietveld analysis, the instrumental contributions to the peak broadening are handled by various physical and mathematical models. Once, the Caglioti relation was mainly used for this purpose (Caglioti et al., Reference Caglioti, Paoletti and Ricci1958; David et al., Reference David, Leoni and Scardi2010).
The angle dependent (θk) X-ray powder peak broadening due to crystallite size can be modeled best by functions that are convolutions of Gaussian and Lorentzian functions (Coelho, Reference Coelho2007; Balzar et al., Reference Balzar1999). In a similar way, the lattice strain contribution to X-ray powder peak broadening can be modeled by convoluting the Gaussian and Lorentzian functions.
Altogether, the microstructural contribution to X-ray peak broadening can be satisfactorily explained by a set of four equations that are dependent on one another


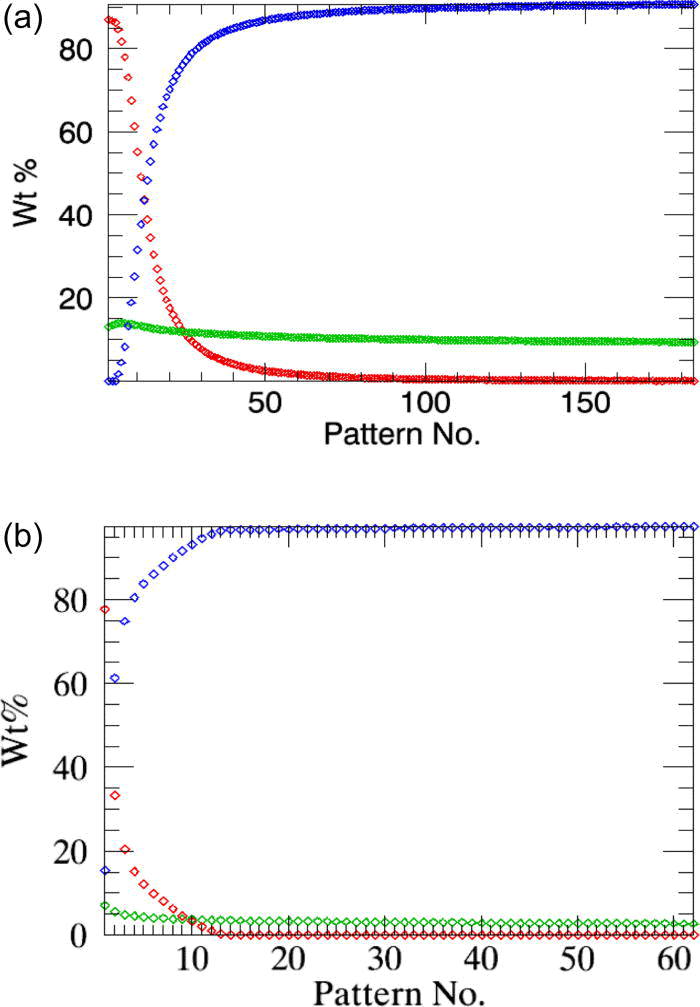
Figure 12.(Color online) The weight fractions of the decaying α-CuPC and the emerging β-CuPC and ɛ-CuPC (very low and almost not changing) at 250 and 270 °C determined from sequential refinements are plotted in (a) and (b).
where (βsz) gauss and (βsz) lor are the Gaussian and Lorentzian related FWHM of the size broadened phase peak, (βsr) gauss and (βsr) lor are the Gaussian and Lorentzian related FWHM of the strain broadened phase peak. (S) gauss and (S) lor are the Gaussian and Lorentzian related crystallite size of the
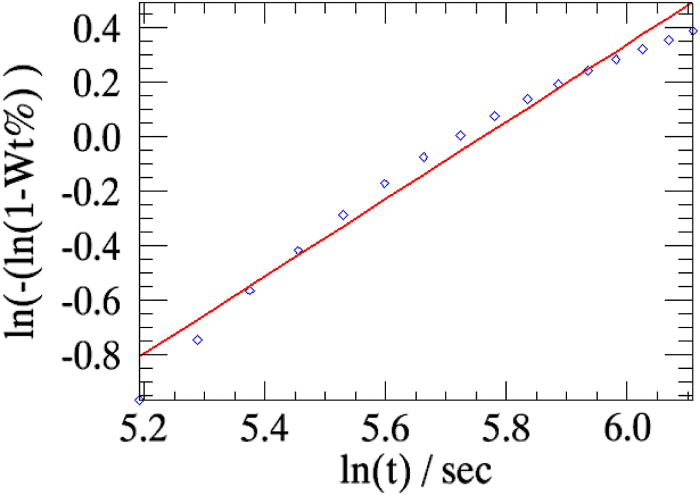
Figure 13.(Color online) The weight fractions of β-CuPC in reaction involving the transformation of α-ɛ-mixture of CuPC to β- CuPC at 250 °C from parametric refinement (line) are compared with the linearized weight fractions of β-CuPC determined from sequential refinements (diamonds). Only 38 out of 184 powder patterns were used in the parametric refinement.
material. (ɛ) gauss and (ɛ) lor are the Gaussian and Lorentzian related lattice strain of the material. λ is the wavelength of the incident X-ray beam, and θk are the phase peak positions.
Depending upon the necessity, some of these equations can be introduced as microstructural convolution models of the material during the Rietveld refinement.
topas launch mode offers a simple way to introduce these models [Eqs. 2a d3b.] during the Rietveld refinement using its built-in macros CS_G, CS_L, Strain_G, and Size_G. These macros can be introduced into the input file to directly refine the Gaussian and/or Lorentzian related crystallite size (or lattice strain) of the material.
Parameterization of one of these equations with respect to time/temperature can be easily accomplished by modifying and rewriting the contents of these macros in the prepared “parametric input file.” For instance, the parameterization of Gaussian related crystallite size versus time/temperature with a quadratic equation [Eq. 4.] can be accomplished by replacing the respective FWHM [Eq. 2a.] by the model equation and rewriting the size term (S gauss) and the FWHM term (βsz)gauss, as in Eq. 5.
where y is the dependent variable, a 0, a 1, a 2 are the refinable (global) model coefficients, and T is the experimental temperature (or other external variable).
The coefficients of the quadratic function (a 0, a 1, and a 2) are refined from multiple powder patterns collected in the experiment; therefore, these variables must be defined in the common part of the “parametric input file” (Sec.III C).
Equation 6. gives the topas macro language statements analogous to Eqs. 4 d5.. These statements will be automatically generated by the program and written in the appropriate locations in the “phase” parts of the “parametric input file” before its execution (as explained in Sec.III C)

where T_298 represents the experimental temperature (298 K), fwhm_1 is the Gaussian related FWHM, and siz1 is the Gaussian related crystallite size. The keywords “Get,” “Lam,” “gauss_fwhm,” “Th” are the reserved topas keywords and macros.
A simple example of parameterization of the Gaussian related crystallite size versus temperature [performed using equations analogous to Eq. 6.] is explained in the following section.
Gaussian crystallite size of TiO2-anatase
The phase transition of the nanocrystalline TiO2 from its anatase to rutile form was studied using in situ XRPD patterns collected at a synchrotron source. In total, 90 powder diffraction patterns in dependence on temperature were collected for this analysis (from 298 to 1123 K, with a heating rate of 6.875 K/min).
The anatase to rutile transition occurs approximately at a temperature of 700 K (Figure 14). Full quantitative sequential Rietveld analysis was performed individually and sequentially on all the patterns (for the two phases) collected in the experiment.
The Gaussian-crystallite sizes of the phase peaks of TiO2-anatase, determined from the sequential refinements, are plotted in Figure 15. As an initial attempt, cubic function was used to model the Gaussian-crystallite size variation with temperature. The Gaussian-crystallite sizes derived from the cubic model are compared with those determined from sequential refinements in Figure 15.
As observed from Figure 15, the cubic function was unable to completely describe the variation of crystallite size versus temperature. In particular, the deviation of the fit is significantly higher in the lower temperature region (roughly from experimental temperature 298 to 409 K).
The crystallite size curve was therefore divided into two different growth regions; the patterns that belong to the two regions are independently parameterized with two different functions.
The crystallite size of TiO2-anatase remains approximately constant from room temperature up to 409 K. This region was parameterized with a linear function. The region from 418 to 659 K that corresponds to the growing stage of TiO2-anatase phase was modeled by a cubic function. The parametrically derived crystallite sizes of both temperature regions are plotted in Figure 16; the model coefficients obtained in the two independent parametric refinements are summarized in Table III.
The relatively smooth high temperature region (from temperatures 418 to 659 K) of the crystallite size curve could be conveniently parameterized by a cubic function. The parameterization of the low temperature region (298–409 K) with the linear model resulted in coefficients
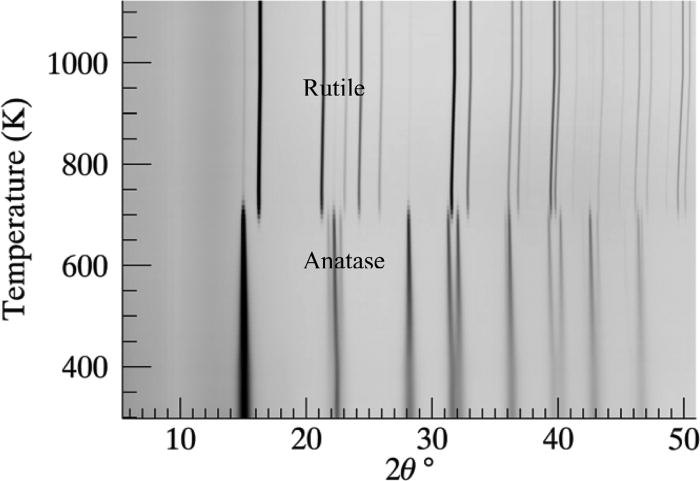
Figure 14. The anatase to rutile phase transformation of TiO2 is shown as a simulated “heating Guinier film plot.” The phase transition occurs approximately at the temperature 700 K.
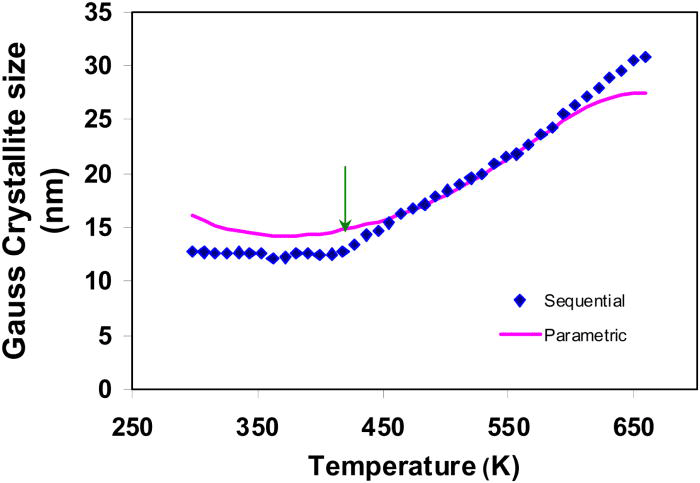
Figure 15.(Color online) The Gaussian-crystallite size of TiO2-anatase obtained in sequential refinements (diamonds) and parametric refinements (curve) using cubic model are compared.
with lower statistical significance, as the growth of the crystallite in this temperature region is nonuniform and also the growth rate is negligibly small.
Surface effects might be considered as a reason for the inhibited growth of the crystallites in the low temperature region (298–409 K).
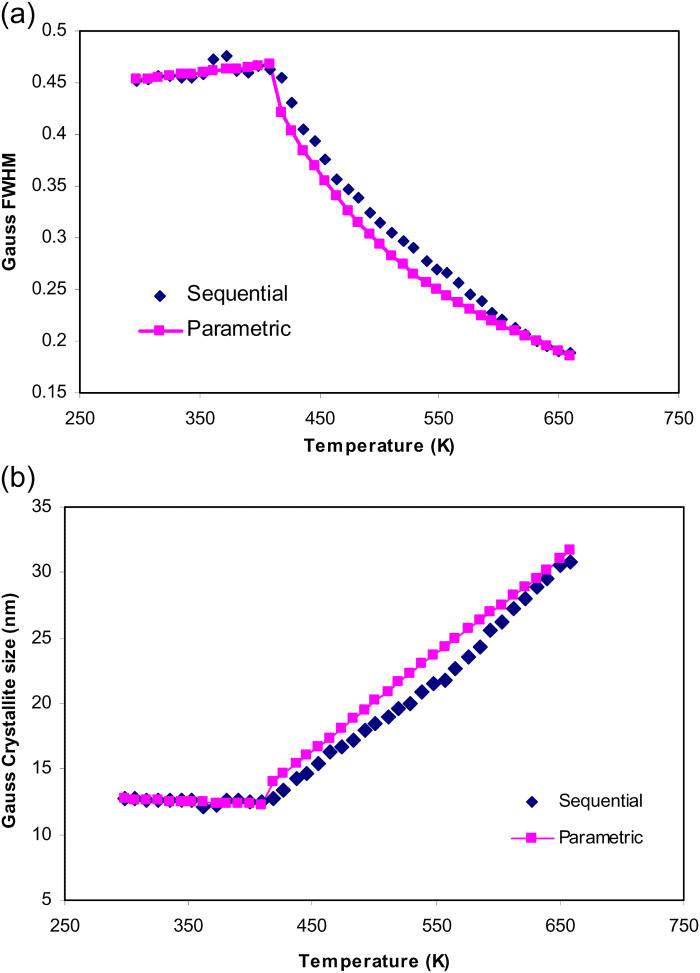
Figure 16.(Color online) The Gaussian related FWHM (top) and Gaussian-crystallite size (bottom) of TiO2-anatase obtained in sequential refinements (diamonds) and parametric refinements (squares & lines) using cubic model are compared.
TABLE III. The coefficients of the linear and cubic functions obtained in the independent parametric refinements of two growth regions of TiO2-anatase are presented.

SUMMARY
Parametric Rietveld refinement is an alternative and robust WPPF approach that opens the possibility to simultaneously refine multiple powder patterns collected in 2D XRPD experiments and thus allows for the introduction of variable models (or constraints), as a function of external variables, into the refinement. The program “powder 3d parametric” described in this paper provides a simple way to perform both parametric and fast sequential refinements of a large number of powder patterns. The use of the program in the two applications has considerably eased the entire sequential/parametric analysis of bulk 2D XRPD data, which would otherwise demand a huge amount of manual effort and prove very time consuming. In total, about 2700 powder patterns in relation to the two applications were successfully evaluated using sequential/parametric refinement methods, assisted by the program. Except for the test refinements, the topas input files required for all other refinements were automatically prepared by the program.
The program also offered a convenient and a quicker way to analyze the data measured between specific time/temperature steps. Many CuPC data used in this analysis also demanded that only certain part of the data to be used in parametric refinement.
On the whole, kinetic analysis of CuPC using parametric refinement could be successfully performed for most CuPC data samples, except that the stability of refinements for many data samples showed dependence on the reactivity of the polymorphs. The activation energies determined for from Avrami’s relation for various reactions characterize the difference in nucleation and crystallite growth processes of the related polymorph. Significant improvements in activation energies can be achieved by performing more experiments at different temperatures.
In the second application, the feasibility of parameterization of microstructural variables (Gaussian-crystallite size) has been verified using the temperature dependent TiO2 data. The input files required for several trials of parametric refinements with various crystallite size models and various time segments were prepared quickly and conveniently using the options provided by the program [(Figures 2b]. The variation of Gaussian-crystallite size versus temperature for the growth region of TiO2-anatase could be successfully parameterized with a higher order polynomial; however, the convergences of these refinements demanded physically sensible starting values for the model coefficients. In most trials, the convergence of parametric refinement showed strong dependence on the smoothness of variation of the crystallite size with respect to temperature and on the quality of the data.
The parameterization of microstructural variables with temperature as introduced in this paper is a basic application. As such, it can be used only to stabilize other refinable variables during parametric refinement, provided that the model used is appropriate.
ACKNOWLEDGMENTS
We acknowledge our colleague Dipl. Min. Melanie Müller for performing the time-dependent measurements with CuPC and also for helping us in preparing the topas input file required for the “test” refinements. Our former colleague Dr. Stefan Ghedia is gratefully acknowledged for carefully proofreading the article.


