Introduction
Intensive agricultural practices have depleted soil carbon (C) pools by up to 75% and contributed ~124 Pg C to the atmosphere over the past 140 years (Houghton and Hackler, Reference Houghton, Hackler and Cushman2001; Lal, Reference Lal2011). Several management practices can replenish the soil C pool (West and Post, Reference West and Post2002; Jarecki and Lal, Reference Jarecki and Lal2003) and one of the most effective is to convert annual row crops to perennial vegetation (Post and Kwon, Reference Post and Kwon2000; McLauchlan et al., Reference McLauchlan, Hobbie and Post2006; Syswerda et al., Reference Syswerda, Corbin, Mokma, Kravchenko and Robertson2011). For example, Post and Kwon (Reference Post and Kwon2000) reported average C accumulation rates following conversion to grasslands of 33.2 g C m−2 yr−1 and Gebhart et al. (Reference Gebhart, Johnson, Mayeux and Polley1994) found rates as high as 110 g C m−2 yr−1 12 years post conversion. Similar estimates have been reported for row crop conversion to forest although rates vary between tropical and temperate stands (Post and Kwon, Reference Post and Kwon2000). Evidence of C accrual in abandoned agricultural fields have also been reported with annual increases of 20 g C m−2 yr−1 (Knops and Tilman, Reference Knops and Tilman2000) to 60 g C m−2 yr−1 (Robertson et al., Reference Robertson, Paul and Harwood2000) in surface soils.
One of the most important drivers of C accumulation following conversion to perennials is an increase in soil organic matter inputs (Post and Kwon, Reference Post and Kwon2000). Perennial systems often have between 3 and 10 times more belowground biomass compared with annual row crops (Zan et al., Reference Zan, Fyles, Girouard and Samson2001; Culman et al., Reference Culman, DuPont, Glover, Buckley, Fick, Ferris and Crews2010; Dupont et al., Reference DuPont, Beniston, Glover, Hodson, Culman, Lal and Ferris2014). Furthermore, C accrual will occur faster in perennial vegetation because perennial crops are usually not tilled and are typically planted for longer intervals compared with annual crops, thus minimizing disturbance and reducing soil C loss (Huggins et al., Reference Huggins, Buyanovsky, Wagner, Brown, Darmody, Peck, Lesoing, Vanotti and Bundy1998). Other important factors that lead to C accumulation under perennials are the inputs of soil organic matter deeper in the soil profile and enhanced physical protection of soil C through aggregation (Six et al., Reference Six, Elliott, Paustian and Doran1998; Grandy and Robertson, Reference Grandy and Robertson2006; Syswerda et al., Reference Syswerda, Corbin, Mokma, Kravchenko and Robertson2011; Tiemann and Grandy, Reference Tiemann and Grandy2015).
Less is known about the length of time required before increases in soil C are detectable or before soil C stabilizes post conversion (McLauchlan et al., Reference McLauchlan, Hobbie and Post2006). In some cases, C accrual is detectable within the first few years post conversion (McLauchlan et al., Reference McLauchlan, Hobbie and Post2006; Rehbein et al., Reference Rehbein, Sandhage-Hofmann and Amelung2015) while in other cases C accumulation among croplands and perennial systems may not be significantly different after 12 years (Syswerda et al., Reference Syswerda, Corbin, Mokma, Kravchenko and Robertson2011). Different C accrual rates between experiments likely result from a number of interacting factors including soil type, climate, fertilization practices, soil spatial variability (Anderson-Teixerira et al., Reference Anderson-Teixeira, Davis, Masters and Delucia2009; Kravchenko and Robertson, Reference Kravchenko and Robertson2011; Tiemann and Grandy, Reference Tiemann and Grandy2015) and how close a system is to reaching C equilibrium (Six et al., Reference Six, Conant, Paul and Paustian2002). Further, soil C comprises of different pools that turn over at different rates (Wander, Reference Wander, Magdoff and Weil2004). For example, organic matter that is readily decomposed by microbial activity is typically associated with labile or active pools of C compared with organic material that is inaccessible to microbial activity either due to inherent chemical recalcitrance (Rasse et al., Reference Rasse, Rumpel and Dignac2005) or physical protection (Schmidt et al., Reference Schmidt, Torn, Abiven, Dittmar, Guggenberger, Janssens, Kleber, Kogel-Knabner, Lehmann, Manning, Nannipieri, Rasse, Weiner and Trumbore2011). The proportion of C in the labile pools compared with more processed C pools is rarely determined and thus C stabilization potential post conversion is poorly understood.
Particulate organic matter (POM) is commonly used to decipher labile and stable soil C pools through physical size fractionation (Cambardella and Elliott, Reference Cambardella and Elliott1992). The large fraction mainly comprises organic materials that are in the initial phases of decomposition that can turnover anywhere from a few days to a year. The medium fraction consists of more processed organic materials that can take a few decades to fully decompose. Given the more stable nature of the medium fraction, it has a greater influence on long-term soil carbon sequestration compared with the labile C pool (Rehbein et al., Reference Rehbein, Sandhage-Hofmann and Amelung2015).
There is widespread interest to accumulate soil C in both labile and stable pools within agricultural systems for both farm-scale and global benefits. One option could be to cultivate perennial grain crops in place of annual grain crops (Asbjornsen et al., Reference Asbjornsen, Hernandez-Santana, Liebman, Bayala, Chen, Helmers, Ong and Schulte2013). Perennial wheat and perennial intermediate wheatgrass (IWG) are being developed to achieve the high yields of annual wheat and have extensive root systems that could potentially increase soil C (Glover et al., Reference Glover, Reganold, Bell, Borevitz, Brummer, Buckler, Cox, Cox, Crews, Culman, DeHaan, Eriksson, Gill, Holland, Hu, Hulke, Ibrahim, Jackson, Jones and Murray2010; Kell, Reference Kell2011). For example, compared with annual wheat, perennial grains developed by DeHaan et al. (Reference DeHaan, Van Tassel and Cox2005) have significantly more coarse and fine roots to 40 cm and 70 cm depths, respectively (Sprunger, Reference Sprunger2015). However, yields from perennial grain crops seem to peak after 2 or 3 years (Wagoner, Reference Wagoner1990; Culman et al., Reference Culman, Snapp, Sprunger, Peralta and DeHaanunpublished), at which point a farmer would need to replant or rotate to another crop. Understanding whether initial gains in soil C can occur within this period is important for determining the value of perennial grains as a plausible strategy for C sequestration.
Here we examine root C and large and medium POM-C fractions under an experimental perennial grain crop (IWG) 4 years post conversion compared with annual winter wheat. We hypothesize that (1) IWG will accumulate more C in both large and medium POM-C fractions compared with wheat because of greater C inputs from both above and belowground sources; and (2) POM-C fractions will be greatest in systems receiving higher levels of more available nitrogen (N).
Methods
Site description
This study was conducted at the W.K. Kellogg Biological Station (KBS) Long-term Ecological Research site, located in southwest Michigan, USA (42o24′N, 85o24′ W, elevation 288 m). Mean annual precipitation and temperature are 1005 mm and 10.1°C. KBS soils are co-mingled Kalamazoo soil series (fine loamy) and Oshtemo (coarse loamy) soil series, mixed, mesic Typic Hapludalfs. These soils typically have an A horizon to a depth of 30 cm, a deep Bt horizon that reaches 80+ cm and a BC horizon that extends to 140 cm (Table 1). Prior to the establishment of this experiment, this field was under a conventionally managed corn (Zea mays L.)-soybean [Glycine max (L.) Meer.]-wheat (Triticum aestivum L.) rotation.
Table 1. Baseline soil profile characteristics taken in the fall of 2009 prior to planting.
Experimental design
The experiment was established in 2009 as a split plot randomized complete block design with four replicated blocks. The main factor was N level and the sub-factor was crop type for a total of 24 plots (3 N levels × 2 crops × 4 blocks). Each plot was 3.0 m × 4.6 m, with 2.4 m buffers in between the plots and 0.9 m buffers on the perimeter. Three N levels included (1) Low N (Organic N), which contained approximately 21 kg of plant available N ha−1 from poultry litter, and will hereafter be referred to as Low N; (2) Mid N, which received 90 kg N ha−1 of urea; and (3) High N, which received 135 kg N ha−1 of urea. Pelletized poultry litter (2.24 Mg ha−1) was applied each October at a total rate of 90 kg N ha−1, with 41% of N available in the first year (A&L Great Lakes Laboratory). The applied poultry litter had an NPK formula of 4–3–2. Manure subsamples were analyzed for C content using Loss on Ignition at 500 °C and analyses revealed that 0.83 Mg C ha-1 was added to the soil each year (A&L Great Lakes Laboratory). The Mid N level is the recommended rate for conventionally grown wheat in the state of Michigan, while the High N level received 50% more N than the Mid N level. In both the Mid N and High N treatments, a starter of 33.6 kg N ha−1 as pelletized urea and 44 kg K2O ha−1 of KCL fertilizer were applied immediately before fall planting. The following spring, typically at the beginning of April and again at the end of May, plots were top-dressed with 28 and 50.4 kg N ha−1 for Mid N and High N, respectively.
Prior to the start of the experiment in fall 2009, the site was chisel plowed to 20 cm and in subsequent years the wheat plots were rototilled to 15 cm depth. Thinopyrum intermedium (Host) Barworkth and D.R. Dewey, “Kernza™ ’’ (IWG) was developed through bulk breeding and mass selection at the Land Institute in Salina, KS (DeHaan et al, Reference DeHaan, Van Tassel and Cox2005; Cox et al., Reference Cox, Van Tassel, Cox and DeHaan2010). IWG was planted in mid November 2009 at a seeding rate of 310 seeds m−2 (1.25 million seeds acre−1) at 15 cm row spacing (Culman et al., Reference Culman, Snapp, Ollenburger, Basso and DeHaan2013). Winter wheat (Triticum aestivum L. var. Caledonia) was planted in early October of 2009, 2010, 2011 and 2012 at a seeding rate of 432 seeds m−2 (1.75 million seeds acre−1). More details regarding planting and chemical application can be found in Culman et al. (Reference Culman, Snapp, Ollenburger, Basso and DeHaan2013).”
Aboveground biomass sampling
We sampled aboveground biomass (seed and straw) during the summer of 2013, when the IWG was in its fourth year and fully established. Aboveground biomass was measured at maturity for both crops. Wheat was harvested on July 15, 2013 and the IWG was harvested on August 26, 2013. Aboveground biomass was determined by randomly placing two 0.25-m2 quadrats in every plot and clipping crop biomass to 10 cm above the soil. The aboveground biomass was separated into seed heads and straw then dried at 60°C for 48 h and weighed. Seeds were separated from their hulls using a custom-made tabletop thresher.
Belowground biomass and soil sampling
Belowground biomass and soil samples were collected on June 7 and 8, 2013, which was near peak aboveground biomass for both wheat and IWG. We used a hydraulic direct-push soil sampler (Geoprobe, Salina, KS) to extract three 6 cm diameter soil cores to 1 m depth from each plot. The three cores per plot were subsequently divided into five depths (0–10 cm, 10–20 cm, 20–40 cm, 40–70 cm and 70–100 cm) and composited by depth interval. From each depth interval a sub-sample of 400 g was taken for root analysis. Roots were separated into two size classes, coarse (>6 mm) and fine (1–6 mm). We obtained coarse roots by gently sieving field moist soil through 6 mm sieves. We obtained fine roots by wet sieving the remaining soil through a 1 mm sieve. We then used tweezers to separate fine roots from plant residues that remained on the 1 mm sieve. We made no attempt to separate live and dead roots. To ensure that roots were soil-free, we hand-washed roots by soaking them in deionized water. Both coarse and fine roots were dried at 60°C for 48 h and then weighed.
Crop C and N analysis
Dried grain and stems were ground separately to a fine powder. Dried roots were frozen in liquid N and then immediately ground to a fine powder using a mortar and pestle. We analyzed both above and belowground crop parts for C and N in a CHNS analyzer (Costech Analyzer ECS 4010, Costech Analytical Technologies, Valencia, CA).
Particulate organic matter C
We used physical size fractionation to determine POM-C, which has been shown to reflect both labile and more stabilized C pools (Cambardella and Elliott, Reference Cambardella and Elliott1992; Culman et al., Reference Culman, Snapp, Freeman, Schipanski, Beniston, Lal, Drinkwater, Franzluebbers, Glover, Grandy, Lee, Six, Maul, Mirksy, Spargo and Wander2012). First, we gently sieved 100 g of soil through a 6 mm screen so as not to disturb soil aggregates (Ontl et al., Reference Ontl, Hofmockel, Cambardella, Schulte and Kolka2013). Next, 10 g of air-dried soil and 30 mL of 0.05 sodium hexametaphospate were combined in a 50 mL centrifuge tube and placed on a shaker for 8 h at 120 oscillations min−1. Using deionized water, we passed the solution of soil and sodium hexametaphospate through a 250 µm sieve (large POM-C), which was placed over a 0.053 µm mesh sieve (medium POM-C). The large POM-C fraction is associated with coarser material and reflects the labile C pool, while the medium POM-C comprises silt and clay particles and is associated with more stabilized C pools. The materials that were retained on both sieves were oven dried at 55°C until samples reached a constant weight. Dried samples were then ground using a mortar and pestle and analyzed for C and N as above. POM-C on an areal basis was determined by multiplying POM-C concentration (g C kg−1 soil), dry weight of POM-C fraction (g)/proportion of total soil sample (g), bulk density (g cm−3) and depth interval (cm).
Statistical analyses
All above and belowground biomass as well as labile soil C data were analyzed separately with the Proc Mixed procedure in SAS (version 9.3; SAS Institute, Cary, NC, USA). Crop, N level, depth and treatment interactions were treated as fixed effects. While, block and treatment ×block interactions were treated as random effects. Significant differences were determined at α = 0.05. For POM-C and roots, depth was analyzed as a repeated measure. The covariance structure assigned in the repeated measures statement was compound symmetry. Means were compared with an adjusted Tukey's pairwise means comparison.
We used a post-hoc statistical power analysis to determine if a type II error occurred during the POM-C statistical analysis. Power analyses have been widely used in soil science to determine if the lack of significance is more likely due to insufficient sampling (number of replications) or an absence of biogeochemical differences between treatments (Kravchenko and Robertson, Reference Kravchenko and Robertson2011; Ladoni et al., Reference Ladoni, Basir and Kravchenko2015). Detailed explanations of power analyses that have been used for soil C studies can be found in Garten and Wullschleger (Reference Garten and Wullschleger1999); Poussart et al. (Reference Poussart, Adro and Olsson2004), and Kravchenko and Robertson (Reference Kravchenko and Robertson2011). In brief, we conducted a post-hoc power analysis that included (1) hypothesizing a size difference in the large POM-C between wheat and IWG; (2) estimating the variability (estimates of variance); (3) specifying a significance level of α = 0.05; (4) specifying the probability of detecting statistical differences (power); and (5) calculating a proposed number of replications. The power analysis was conducted using the PROC MIXED procedure in SAS (version 9.3; SAS Institute, Cary, NC, USA).
Results
Aboveground C
Grain C differed by crop (Table 2; F = 289, P < 0.05), for example, grain C for wheat ranged from 1.28 ± 0.14 (mean ± standard error of the mean) to 1.39 ± 0.15 Mg C ha−1 across N levels and was up to 25 times greater than for IWG, where grain C ranged from 0.07 ± 0.002 to 0.54 ± 0.1 Mg C ha−1. There was no overall N level effect as both crops had statistically similar grain C across N levels (F = 0.5, P = 0.6). Straw C was significantly greater in IWG compared with wheat (Table 2; F = 110, P < 0.05). Averaging across N levels, IWG had 1.9 times greater straw C compared with wheat. Neither the wheat nor IWG aboveground C differed across the three N levels.
Table 2. Grain and straw C Content for wheat and IWG across three N levels (Low N (Organic N), Mid N and High N) at the Kellogg Biological Station in 2013.

Comparisons of means within rows (between crops) followed by same lowercase letters are not significantly different. Different lower case letters denote significant differences between crops and across N levels. Within a column (crop), different lowercase letters denote a significant difference amongst N Levels at P = 0.05. Values in parentheses are standard errors. See Supplementary Materials for ANOVA tables.
Root C content and depth distribution
IWG coarse root C for the entire soil profile was up to 15 times greater than that of wheat, such that coarse root C for IWG ranged from 1.70 ± 0.30 to 2.42 ± 0.13 Mg C ha−1 and for wheat ranged from 0.11 ± 0.05 to 0.29 ± 0.07 Mg C ha−1 (Table 3). Despite no overall N level effect (F = 1.4, P = 0.3), pairwise comparisons revealed that IWG coarse root C under high N was significantly greater than coarse root C under Mid N and Low N (P < 0.03). Wheat coarse root C was statistically similar across N levels. The majority of coarse root C was concentrated at the surface for both crops (Fig. 1). Averaging across N levels, 60% of IWG total coarse root C was in the top 10 cm and 81% was in the top 20 cm. On average 79% of wheat total coarse root C was in the top 0–10 cm and 96% was in the top 20 cm. IWG had significantly greater root C compared with wheat to 40 cm depths under Low N and Mid N levels and to 20 cm depths under the High N level.
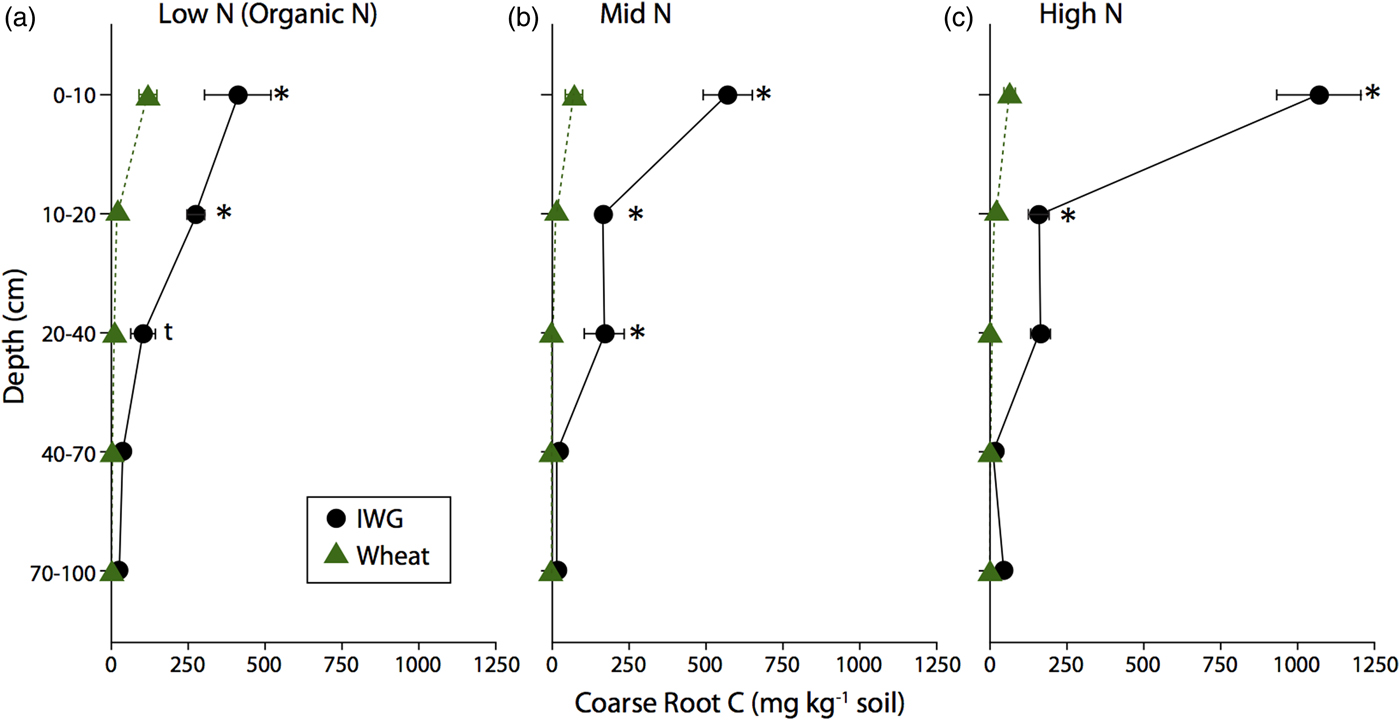
Figure 1. Coarse root C content for annual winter wheat (triangles) and IWG (circles) for three N levels (Low N (Organic N), Mid N and High N) at five different soil depths. Error bars represent the standard error of the mean and asterisks denote significance at P < 0.05 and t denotes significance at P < 0.1.
Table 3. Total coarse and fine root C contents for the entire soil profile (0–100 cm) between wheat and IWG across three N levels (Low N (Organic N), Mid N and High N) at the Kellogg Biological Station in 2013.

Comparisons of means within rows (between crops) followed by same lowercase letters are not significantly different. Different lower case letters denote significant differences between crops and across N levels. Within a column (crop), different lowercase letters denote a significant difference amongst N Levels at P = 0.05. Values in parentheses are standard errors. See Supplementary Materials for ANOVA tables.
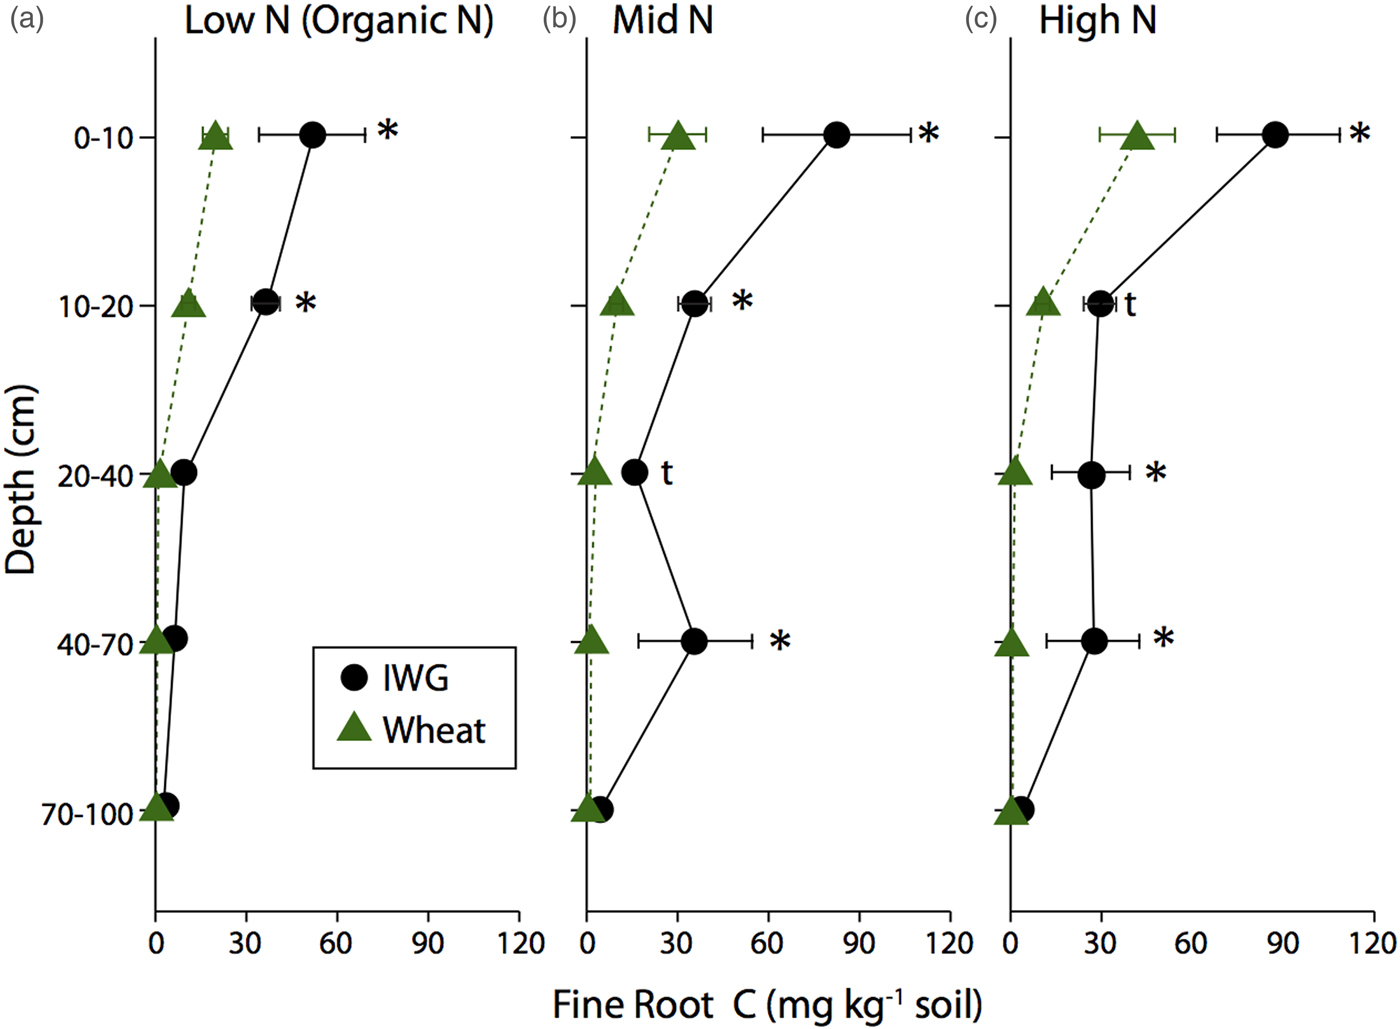
Differences between wheat and IWG were also apparent for fine root C (Table 3), which was four times greater in IWG compared with wheat (F = 34.6, P = 0.0002). Total fine root C for IWG was 0.24 ± 0.02, 0.47 ± 0.09, and 0.47 ± 0.10 Mg C ha−1 for Low N, Mid N and High N, respectively. In contrast, total fine root C for wheat was 0.063 ± 0.001, 0.01 ± 0.01, and 0.11 ± 0.05 Mg C ha−1 for Low N, Mid N and High N, respectively. There was a marginal overall N level effect on fine root C (F = 3.0, P = 0.1). In addition, pairwise comparisons showed that IWG under High N and Mid N had significantly greater root C content compared with IWG under Low N (Table 3).
IWG fine root C was more evenly distributed throughout the soil profile compared with coarse root C, but still a large portion was in the top 20 cm (Fig. 2). For example, averaging across N levels, 48% of IWG fine root C was in the top 10 cm and 72% was in the top 20 cm. Fine root distributions in the wheat systems mirrored the coarse root biomass distributions, with 67% found in the top 10 cm and 92% found in the top 90 cm. IWG had significantly more fine root C compared with wheat to 70 cm depth in Mid N and High N levels (Fig. 2). Within the Low N level, IWG had significantly greater fine root C compared with wheat down to only 20 cm.

Figure 2. Fine root C in annual winter wheat (triangles) and IWG (circles) for three N levels (Low N (Organic N), Mid N and High N) at five different depths throughout the soil profile. Error bars represent the standard error of the mean and asterisks denote significance at P < 0.05 and t denotes significance at P < 0.1.
Root C and N concentrations and C:N ratios
There was a significant crop effect for root C concentrations (F = 98.9, P < 0.0001), but differences between wheat and IWG mainly occurred in the top 10 cm of soil (Table 4). At the surface depth interval, IWG root C concentrations ranged from 28.9 to 33.1% and were greater than in wheat, which ranged from 16.8 to 22.3%. Coarse root C did not significantly differ across N levels (F = 3.1, P = 0.07). Despite significant overall crop and N level effects on fine root C concentrations (F = 8.2, P = 0.01 and F = 3.8, P = 0.05), distinct trends between the two crops for fine root C concentrations were not as apparent compared with those in coarse roots. In general, greater C concentrations were found under the Low N level compared with the Mid N and High N levels (Table 4).
Table 4. The total amount of C in coarse and fine root biomass at five depths associated with wheat and IWG across N levels (Low N (Organic N), Mid N and High N) at the Kellogg Biological Station in 2013.

Comparisons of crop means (between rows) that are followed by different uppercase letters are significantly different at (P = 0.05). Within crop and depth interval (columns), different lowercase letters denote a significant difference among N Level at P = 0.05. Values in parentheses are standard errors. See Supplementary Materials for ANOVA tables.
Coarse root N concentrations were significantly greater in the wheat systems compared with IWG (Table 5; F = 130, P < 0.0001) and decreased significantly by depth (F = 77, P < 0.0001). There was also a strong N level effect, where coarse root N concentrations were typically greatest in the High N level (F = 16, P < 0.0001). There was a significant N level × crop × depth interaction (F = 5.2, P = 0.0002), most likely caused by lack of differences across N level and between crops at depths below 40 cm.
Table 5. Total amount of N in coarse and fine root biomass at five depths associated with wheat and IWG across N levels (Low N (Organic N), Mid N and High N) at the Kellogg Biological Station in 2013.

Comparisons of crop means (between rows) that are followed by different uppercase letters are significantly different at (P = 0.05). Within crop and depth interval (columns), different lowercase letters denote a significant difference among N Level at P = 0.05. Values in parentheses are standard errors. See Supplementary Materials for ANOVA tables.
Fine root N concentrations differed by crop (F = 21, P = 0.0002) but not by N level (F = 4.5, P = 0.2). Wheat had greater N concentrations compared with IWG at almost every depth (Table 5). On average, fine root N concentrations were 36% greater than coarse root N concentrations for both crops.
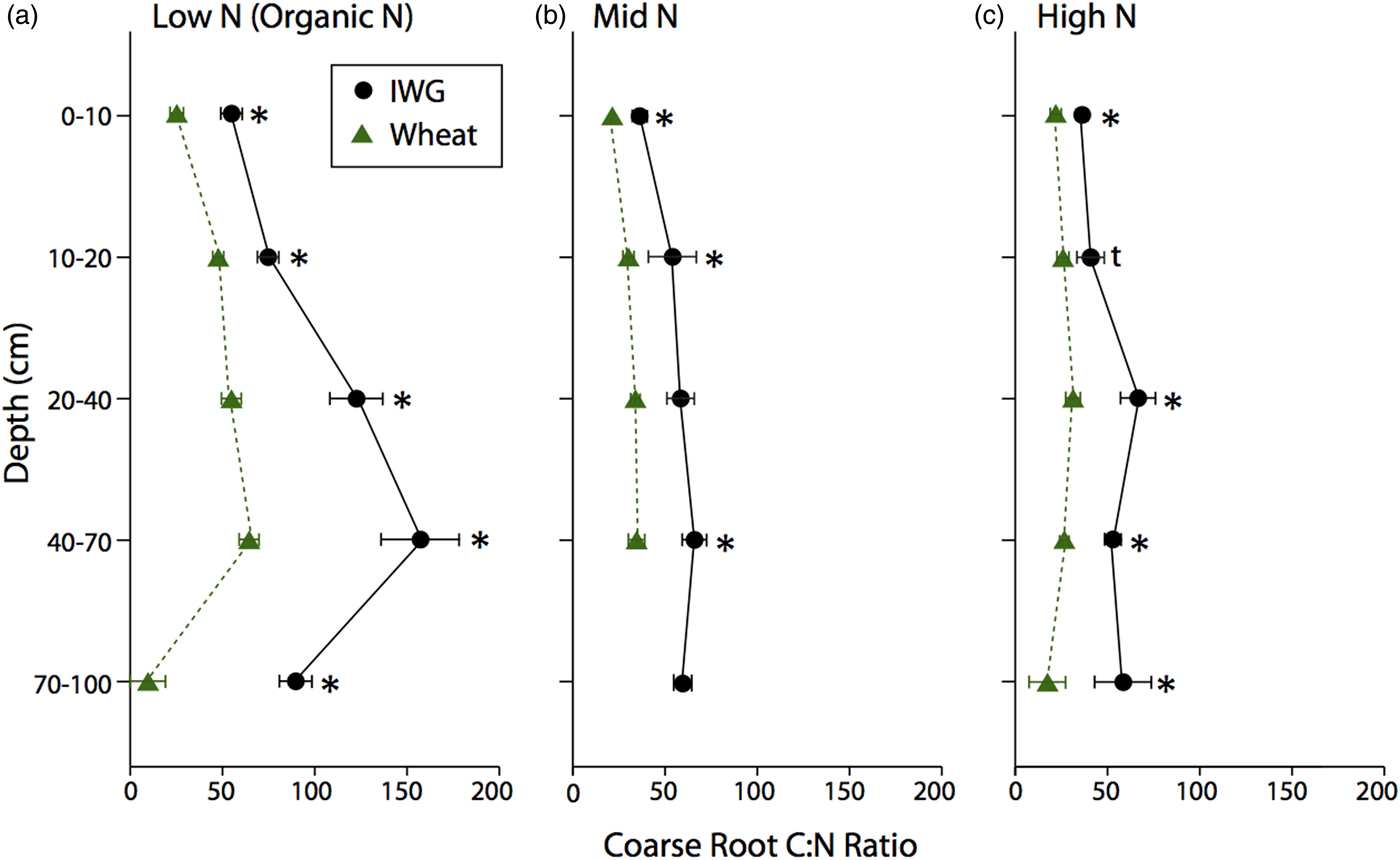
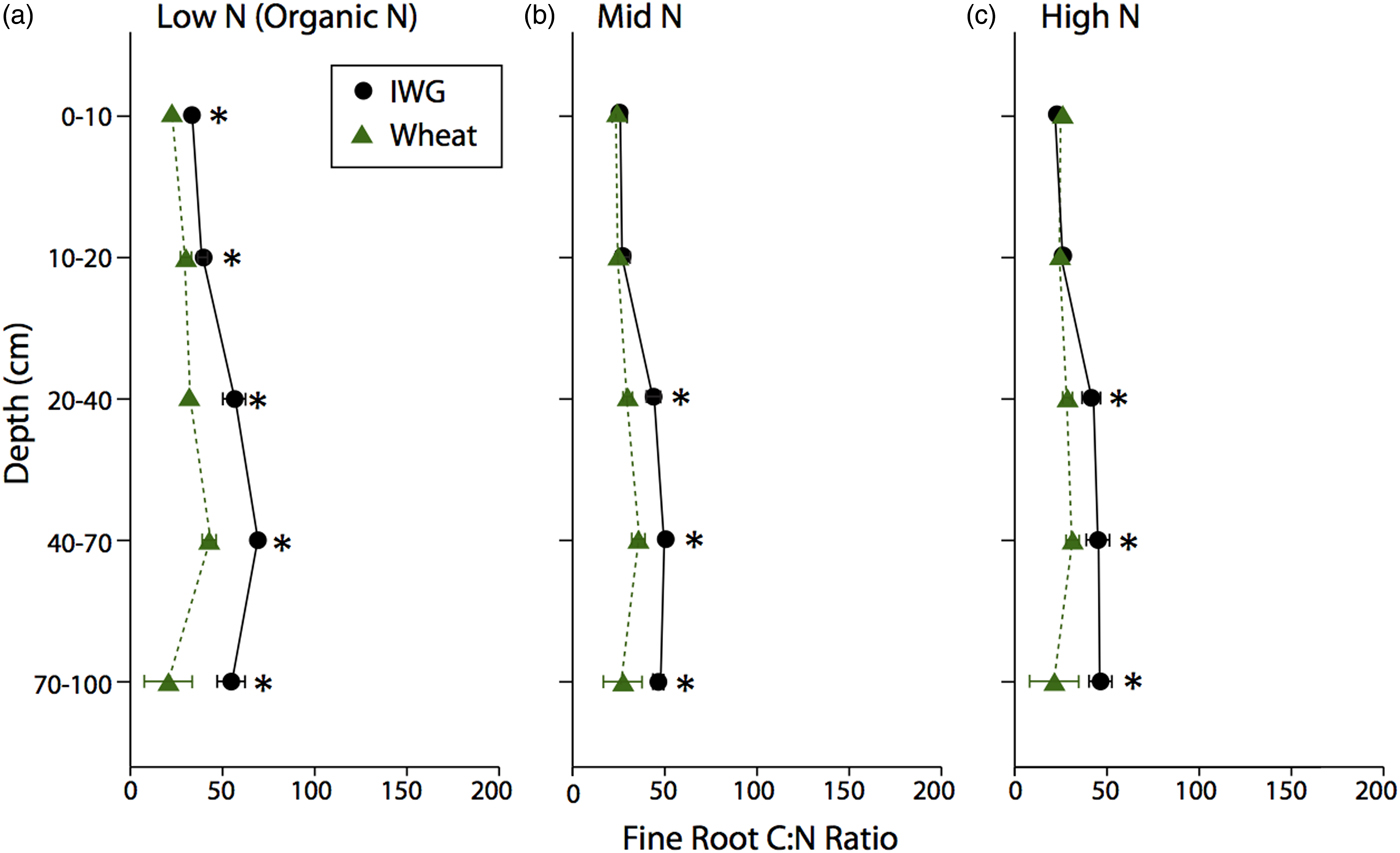
The C:N ratio for coarse roots was significantly greater in IWG systems compared with wheat at almost every depth (Fig. 3; F = 269, P < 0.0001). There was also a strong overall N level effect (F = 74.8, P < 0.0001), where the coarse root C:N ratio was greater under Low N, especially at lower depths. Similarly, there was an overall crop (F = 62.5, P < 0.001) and N level (F = 10.4, P < 0.002) effect for fine root C:N ratio, where IWG had a significantly greater C:N ratio at all depths under Low N and greater C:N ratio in subsurface depths under Mid N and High N (Fig. 4). In addition, there was a significant crop × N level interaction because IWG was more affected by N level compared with wheat (Fig. 4).

Figure 3. Coarse root C:N ratios for annual winter wheat (triangles) and IWG (circles) for three N levels (Low N (Organic N), Mid N and High N) at five different depths throughout the soil profile. Error bars represent the standard error of the mean and asterisks denotes significance at <0.05, and t denotes significance at <0.1.

Figure 4. Fine root C:N ratios for annual winter wheat (triangles) and IWG (circles) for three N levels (Low N (Organic N), Mid N and High N) at five different depths throughout the soil profile. Error bars represent the standard error of the mean and asterisks denote significance at P < 0.05.
Particulate organic matter C
There were no significant differences in large or medium POM-C concentrations between the two crops (Fig. 5; F = 0.5 and P = 0.5 and F = 0, P = 0.9, respectively) or across N levels (F = 0.3, P = 0.8 and F = 0.6, P = 0.9, respectively). Large POM-C concentrations were greatest in the top 0–10 cm of soil beneath both crops compared with other depth intervals. Mean IWG large POM-C concentrations at the surface depth were 3.6 ± 0.4, 3.8 ± 0.8, and 4.0 ± 0.7 g C kg soil−1 for Low N, Mid N and High N, respectively. Wheat POM-C concentrations at 0–10 cm depth ranged from 3.6 ± 1.3 to 4.7 ± 0.7 g C kg soil−1, with greater concentrations found in the Low N treatment.
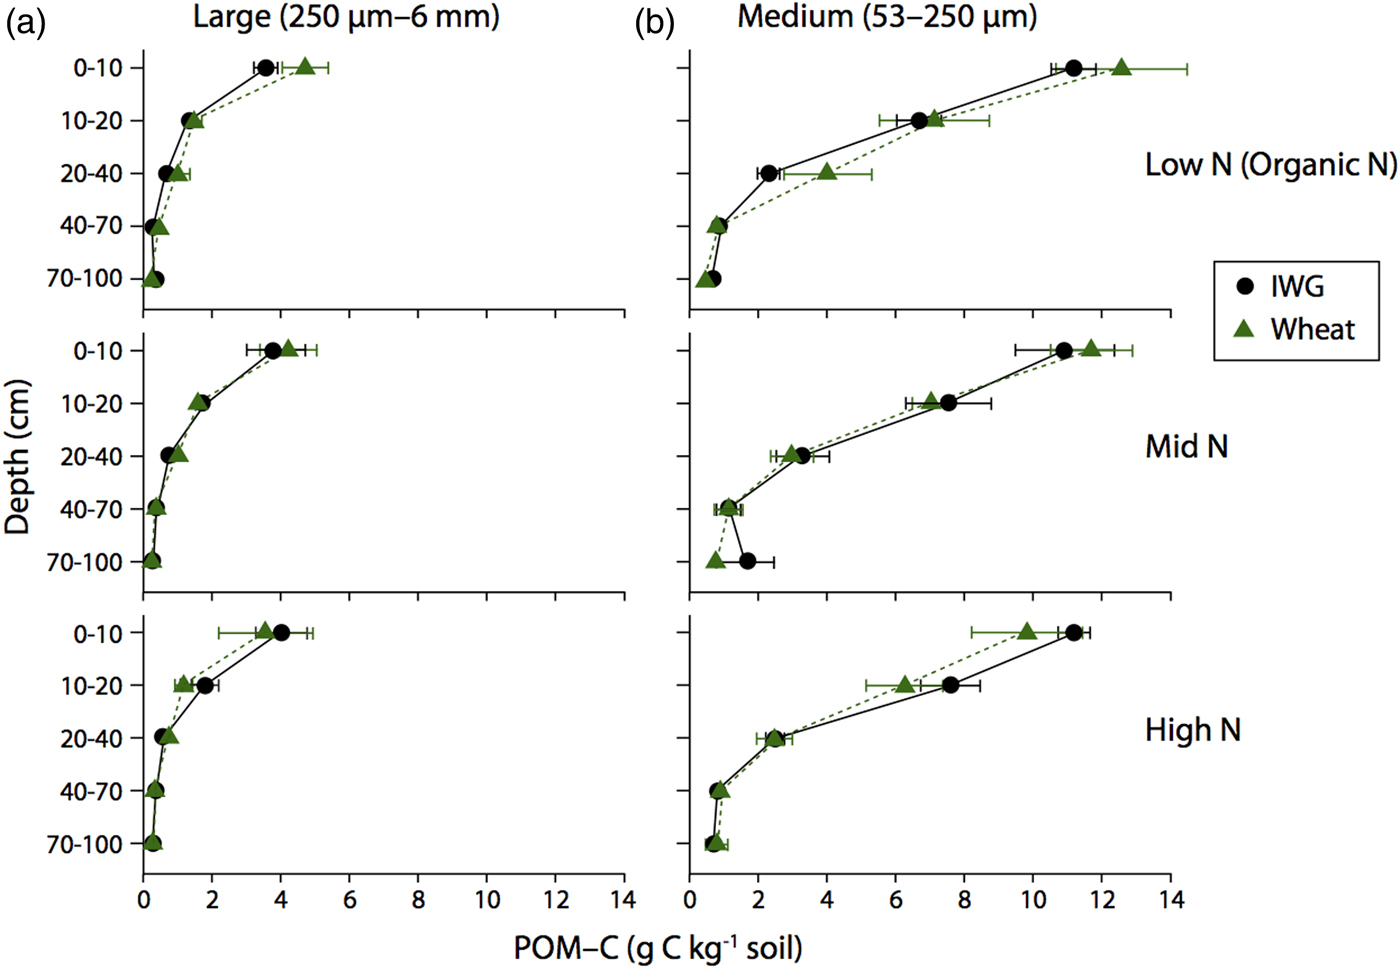
Figure 5. Large and Medium POM-C concentrations for annual winter wheat (triangles) and IWG (circles) for three N levels (Low N (Organic N), Mid N and High N) at five different depths throughout the soil profile. Error bars represent the standard error of the mean.
Medium POM-C was greater than the large POM-C across all N levels. At 0–10 cm, IWG medium POM-C ranged from 10.9 ± 1.4 to 11.2 ± 0.6 g C kg soil−1 across N levels, with the Mid N treatment having the lowest concentrations. Surface soil concentrations were very similar in wheat systems where concentrations ranged from 9.8 ± 1.6 to 12.6 ± 1.9 g C kg soil−1, again with concentrations slightly higher in the Low N (Organic N) treatment. Pairwise comparisons reveal that large POM-C concentrations below the 10 cm depth interval were statistically similar to one another (p > 0.05). In contrast, medium POM-C fractions significantly decreased by depth to 40 cm (P < 0.0001).
POM-C content accounts for the weight of the fraction, C concentration, bulk density and length of depth interval. There was no difference in large or medium POM-C content between the two crops throughout the soil profile to 1 m (Fig. 6, F = 0 and P = 0.9 and F = 0.11, P = 0.7, respectively). Approximately 40% of POM-C was found in the top 0–10 cm for both crops. POM-C below 20 cm was evenly distributed throughout the soil profile in the large fraction, but steadily decreased by depth in the medium fraction (Fig. 6). In addition, POM-C content was statistically similar across N levels for both large and medium fractions (F = 0.8 and P = 0.5, F = 1.6, P = 0.2; respectively).
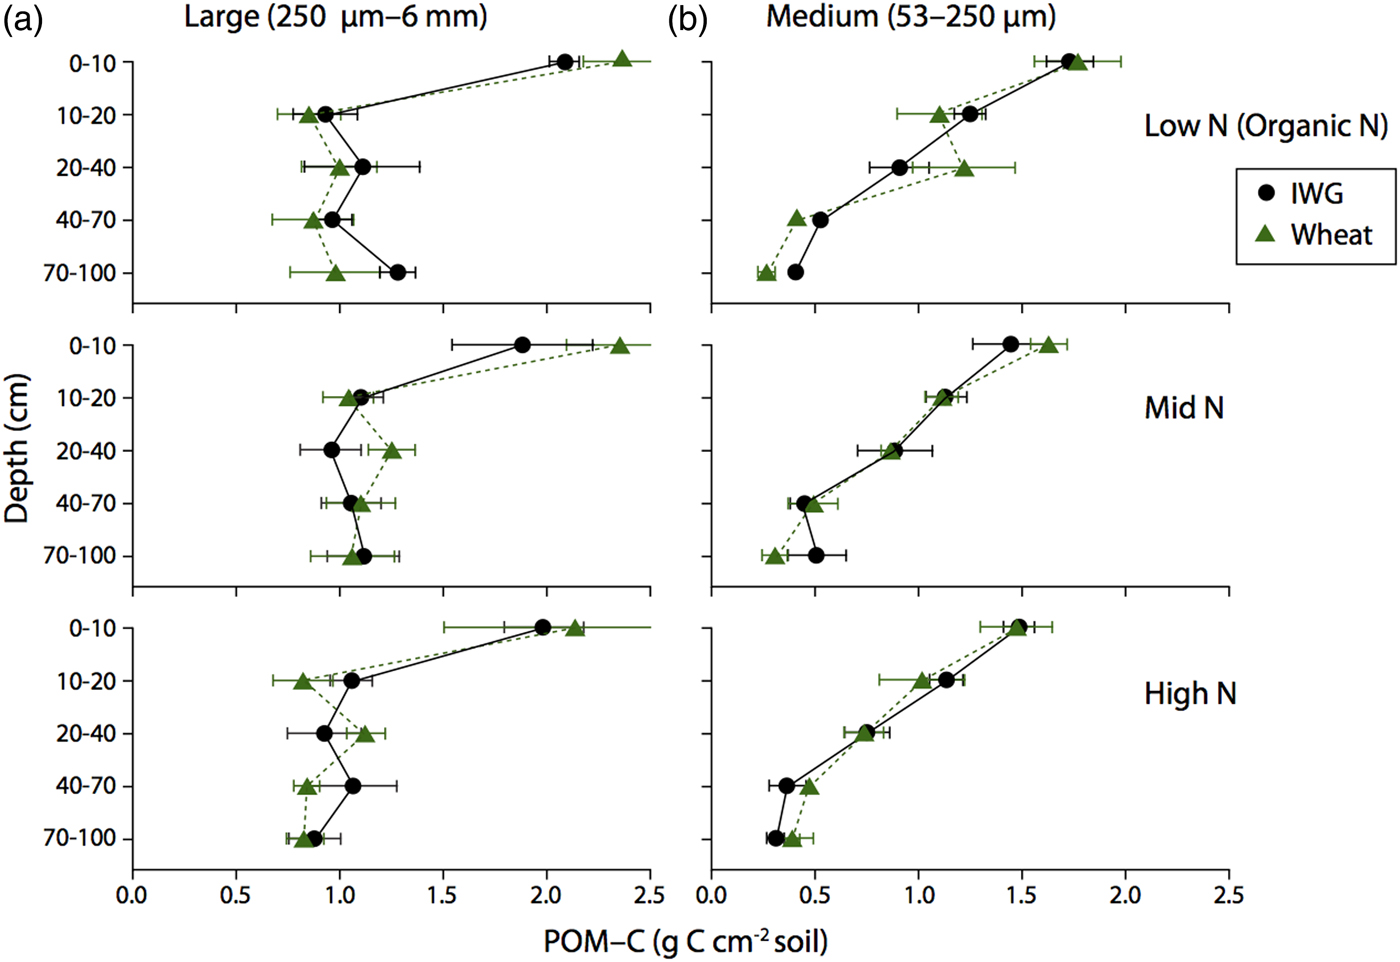
Figure 6. Large and Medium POM-C content for annual winter wheat (triangles) and IWG (circles) for three N levels (Low N (Organic N), Mid N and High N) at five different depths throughout the soil profile. Error bars represent the standard error of the mean.
Power analysis
We conducted a post-hoc power analysis for two different scenarios. First, we used the observed difference between wheat and IWG in the large POM-C at 0–10 cm depth and increased the number of replicates. Secondly, we hypothesized a 15% difference in C between wheat and IWG, while keeping the number of replicates at n = 4. For scenario one, a total of 52 replicates were needed in order to achieve 78% power. For scenario two, a 15% difference between wheat and IWG large POM-C with four replicates was needed to achieve 84% power.
Discussion
Perennial IWG had significantly greater above and belowground biomass compared with annual wheat. Despite this considerable difference in biomass, we did not detect significant differences in large or medium POM-C fractions between wheat and IWG 4 years after establishment.
Crop C and POM-C fractions
Perennial crops are often touted for their greater and more extensive root systems compared with annual crops (Glover et al., Reference Glover, Cox and Reganold2007), which we found here with total coarse and fine root C stores of IWG between 6 and 15 times greater than root C stores of wheat. The magnitude of differences in root C between IWG and wheat is on par with other studies comparing annual and perennial crops (Jarchow and Liebman, Reference Jarchow and Liebman2012; Anderson-Teixeira et al., Reference Anderson-Teixeira, Masters, Black, Zeri, Hussain, Bernacchi and DeLucia2013). Our findings are also consistent with expectations that perennial grains will have greater root C at subsurface depths (Glover et al., Reference Glover, Reganold, Bell, Borevitz, Brummer, Buckler, Cox, Cox, Crews, Culman, DeHaan, Eriksson, Gill, Holland, Hu, Hulke, Ibrahim, Jackson, Jones and Murray2010). Significant root C differences between the two crops were detectable to 70 cm depth and demonstrate that perennials are capable of placing greater amounts of root C deeper in the soil profile compared with annual crops. Although the majority of aboveground biomass is removed in both IWG and wheat, there is a portion of aboveground C that is left on the soil surface. Given that IWG has significantly greater straw C than wheat, there could potentially be more aboveground C contributing to soil C stores in IWG systems compared with wheat.
However, despite greater overall aboveground C and up to 15 times more root C within the IWG systems compared with wheat, we did not find significant differences in the large or medium POM-C fractions between the two crops at any depth. Furthermore, we found similar POM-C concentrations across the three N levels, even though IWG grown under High N had more root C than IWG grown with Low N and Mid N levels.
In our study, the 0–10 cm large POM-C fraction consisted of recently deposited organic material, such as roots and residue and had a C:N of 19 compared with the 0–10 cm medium POM-C fraction, which comprised finer mineral associated particles and had a C:N of 14. These findings are corroborated by others who associate fractions that have high C:N ratios with more labile C pools compared with fractions with lower C:N ratios, that tend to reflect a more stabilized pool of C (Willson et al., Reference Willson, Paul and Harwood2001).
Ultimately, these findings show that IWG does not accumulate more C compared with wheat in labile or stabilized pools, which goes against our initial hypothesis. This is surprising given the widespread evidence for gains in soil C under perennial systems compared with annual row-crops (Zan et al., Reference Zan, Fyles, Girouard and Samson2001; McLauchlan et al., Reference McLauchlan, Hobbie and Post2006; and Anderson-Teixeira et al., Reference Anderson-Teixeira, Davis, Masters and Delucia2009).
Similar soil C under IWG and annual wheat
One reason for similar soil POM-C status in IWG and in annual wheat systems might be the limited time since conversion and/or establishment. Forest and grassland systems that had increased soil C, reviewed by Post and Kwon (Reference Post and Kwon2000), were between 8 and 126 years post-conversion from cropland. In studies that reported soil C accumulation in perennial grasses or cellulosic biofuels compared with annual crops, perennial systems were typically 4–15 years old (Collins et al., Reference Collins, Smith, Fransen, Alva, Kruger and Granatstein2010 and Rehbein et al., Reference Rehbein, Sandhage-Hofmann and Amelung2015). However not all studies report consistent C gains within this time frame. For example, at a site within 1 km of our experiment, Syswerda et al. (Reference Syswerda, Corbin, Mokma, Kravchenko and Robertson2011) found greater (10.3%) surface soil C concentrations 12 years post establishment in alfalfa compared with a conventionally managed corn-soybean-wheat system, but no differences between alfalfa and an organic or no-till corn-soybean-wheat system.
An important consideration here is that our study site has relatively sandy soils with low cation exchange capacity (CEC) relative to most Midwestern soils, resulting in an overall lower capacity to accumulate soil C (Table 1). Sandy soils often require more time to build soil C compared with soils with greater clay content (Schneckenberger and Kuzyakov, Reference Schneckenberger and Kuzyakov2007) and has been shown to be a significant factor in predicting soil C accrual rates (Anderson-Teixeira et al., Reference Anderson-Teixeira, Davis, Masters and Delucia2009). In addition, our perennial sites received annual applications of N, which can influence soil C accrual rates both positively and negatively (Anderson-Teixeira et al., Reference Anderson-Teixeira, Davis, Masters and Delucia2009). Thus, more time may be needed for soil C to accumulate in these coarse loam soils.
The labile C pool comprises recent inputs from aboveground litter and or root rhizodeposition; thus, if we were to see a difference in C between the two crops, we would expect to see it first in the large POM-C fraction. That we did not detect an increase in soil C within the large POM-C fraction could be because the labile soil C pool under IWG may be lower quality due to slower root decomposition compared with wheat. Thus, IWG roots may be adding C into the large POM-C fraction slower than roots of annual wheat. The C:N ratios of both coarse and fine IWG roots were significantly greater than those for wheat throughout the entire profile, which could lead to reduced turnover and smaller C contributions to the large POM-C within the initial years of establishment. A higher C:N ratio within perennial roots compared with annual roots is common (Craine et al., Reference Craine, Wedin, Chapin and Reich2003) and the greater C content could lead to longer root persistence. Over time, as the roots higher in C content turn over, gains in soil C might be detected under IWG.
Another plausible explanation for similar soil C between the two crops is priming under IWG. Priming occurs when increased root exudates stimulate microbial activity, causing an increase in decomposition rates of older soil C (Cheng, Reference Cheng1999). Strickland et al. (Reference Strickland, Leggett, Sucre and Bradford2015) found a 21% decline in total soil C under established switchgrass stands compared with total C prior to planting, mainly due to losses in POM-C. They attributed this loss to priming that occurred due to increased microbial activity. In the present study, omnivore nematodes were greater under IWG (Culman et al., Reference Culman, Snapp, Sprunger, Peralta and DeHaanunpublished), which could have led to increased decomposition and ultimately less C accumulation. In addition, Culman et al. (Reference Culman, Snapp, Ollenburger, Basso and DeHaan2013) found significantly greater C mineralization under IWG compared with wheat in the second year of this study, while we found no difference in C mineralization (data not shown) between the two crops 4 years after establishment. An initial pulse in C mineralization under IWG that has since subsided could be due to priming that has resulted in less C accumulation under IWG than was expected.
Results from a power analysis further help explain the similarity of soil C in the wheat and IWG systems. The power analysis for the large POM-C at the 0–10 cm depth interval, where we most expected to see differences between the two systems, revealed that 52 replicates would likely be needed to reach an acceptable probability (78%) of detecting a significant difference (P = 0.05) in large POM-C at that time. With four replicates in this study, alternatively, a 15% difference in surface soil C between wheat and IWG would be needed to achieve 84% power. Over time, then, soil C might accumulate sufficiently to reveal a 15% difference in POM-C. However, a long-term experiment would be required to capture such differences and in any case would take longer than the expected 3 year perennial grain rotation now projected (Wagoner, Reference Wagoner1990; Culman et al., Reference Culman, Snapp, Sprunger, Peralta and DeHaanunpublished). Thus, the power analysis reinforces our inference that a longer rotation interval would be needed in order to detect a difference in C between wheat and IWG.
Vision of perennial grains as a means to accumulate soil C
The concept of perennial grains as a means to increase yields while providing ecosystem services within agricultural landscapes has garnered much attention (Wagoner, Reference Wagoner1990; Glover et al., Reference Glover, Cox and Reganold2007). In particular, proponents of perennial wheat development argue that a perennial version of wheat could lead to crops that are more productive with less need for fertilizers, that ameliorate erosion and reduce nitrate leaching, and that possess greater water use efficiency (Glover et al., Reference Glover, Reganold, Bell, Borevitz, Brummer, Buckler, Cox, Cox, Crews, Culman, DeHaan, Eriksson, Gill, Holland, Hu, Hulke, Ibrahim, Jackson, Jones and Murray2010; Kell, Reference Kell2011; Culman et al., Reference Culman, Snapp, Ollenburger, Basso and DeHaan2013). Proponents especially tout the potential for soil C accrual throughout the soil profile due to deep roots (Asbjornsen et al., Reference Asbjornsen, Hernandez-Santana, Liebman, Bayala, Chen, Helmers, Ong and Schulte2013; Crews and DeHaan, Reference Crews and DeHaan2015).
Perennial wheat and IWG yields at KBS are 50 and 70% lower than annual winter wheat yields (Jaikumar et al., Reference Jaikumar, Snapp, Murphy and Jones2012; Culman et al., Reference Culman, Snapp, Ollenburger, Basso and DeHaan2013). However, proponents argue that it could still be valuable to farmers who want to improve soil health and other ecosystem services (Adebiyi et al., Reference Adebiyi, Schmitt Olabisi and Snapp2016). Four years post establishment, however, we were unable to detect any gains in C accumulation under IWG compared with wheat in either labile or stabilized pools. Four years was an insufficient amount of time to detect gains in C under IWG, especially given the coarse loam soils at this site. Soil C gains could eventually occur because of the large amount of belowground C content found within IWG. That said, since grain yields often decline after 3 or 4 years, gains in C that fail to show up in this time period may never be realized if farmers till and rotate to another crop.
Nevertheless, soil C sequestration is not the only ecosystem service that IWG can provide. For example, Culman et al. (Reference Culman, Snapp, Ollenburger, Basso and DeHaan2013) found that IWG reduced nitrate leaching up to 99% compared with wheat and Sprunger (Reference Sprunger2015) found that IWG improved crop-level N use efficiency by up to 42%. In addition, there is evidence that perennial roots persist even after a new annual crop is established (Dupont et al., Reference DuPont, Beniston, Glover, Hodson, Culman, Lal and Ferris2014). Perennial roots could, therefore, contribute to soil C pools after conversion to an annual system. However, the lack of detectable soil C accumulation in a coarse loam soil, 4 years post establishment, weakens the appeal of perennial wheat and IWG.
Conclusions
We measured large and medium POM-C fractions in annual wheat and fourth year perennial IWG across three N levels differing in rates and types of N. Coarse and fine root C were up to 15 times greater under IWG compared with wheat. However, we did not detect any soil C gains under IWG in either labile or stabilized pools. Post-hoc power analysis suggests a much longer time is needed to detect significant soil C accumulation in labile C pools. Since grain yields of perennial IWG often decline after 3 or 4 years, it seems unlikely that detectable (>15%) C gains would be achieved in these low CEC soils before IWG is rotated to a different crop.
Supplementary Material
The supplementary material for this article can be found at https://doi.org/10.1017/S1742170517000138
Acknowledgements
We thank M. Freeman, J. Green, and many others for assistance both in the field and laboratory. We thank Lee DeHaan and the Land Institute for supplying Kernza seed and valuable guidance on management. We also thank S. K. Hamilton for suggestions and extensive comments at all stages of this research. In addition, we thank Jane Schuette for help with figure preparation. This work was funded by a USDA Organic Research and Education Initiative grant (2009-51300-05513) and by the NSF Long-Term Ecological Research Program (DEB 1027253) and Michigan State AgBioResearch.