


Summations
-
∙ In structural magnetic resonance imaging (sMRI), there are higher amygdala and hippocampus volumes post-electroconvulsive therapy (ECT).
-
∙ In functional MRI (fMRI), there is a positive correlation between brain networks.
-
∙ ECT in depressive disorder seems to be associated with an increase of fractional anisotropy in dorsal fronto-limbic circuits.
Considerations
-
∙ The studies had small sample sizes.
-
∙ The studies presented do not take into account new ECT techniques such as focal electrically administered seizure therapy (FEAST).
-
∙ No study reported the role of an effective ECT session in brain structure and function
Introduction
One of the main indications for ECT are mood disorders, which include depressive episodes in unipolar (1,Reference Baghai and Möller2) or bipolar depression and depressive decompensation of schizoaffective disorder, catatonia and manic episodes (3).
In a review by Loo (Reference Loo4), ECT was shown to be effective in 50–60% of patients with treatment-resistant depression. The author also noted an improvement in the quality of life in 87% of cases after treatment, and 78% of patients maintained this improvement 6 months after treatment.
Also, in patients presenting a depression [major depressive disorder (MDD)] without any criterion of resistance, ECT shows higher efficiency than antidepressants. A meta-analysis compared the ECT with the group of antidepressants including tricyclic antidepressants (TCA), monoamine oxidase inhibitors (MAOIs) and selective serotonin reuptake inhibitors. The comparison of ECT versus antidepressants in general indicates a significant superior effect of ECT (association χ2=51.88, df=1, p<0.001). The chance of response with ECT is about four times greater than with the antidepressant drugs [odds ratio (OR) 3.72; 95% confidence interval (CI) 2.60, 5.32]. Patients receiving real ECT have nearly three more chances of a positive response than patients using TCA (OR 2.99; 95% CI 1.91, 4.71). A positive response with ECT is approximately six times greater than with MAOIs (OR 6.13; 95% CI 3.82, 9.83) (Reference Pagnin, de Queiroz, Pini and Cassano5).
The aim of ECT is to induce generalised therapeutic brain stimulation using a current delivered by transcranial electrodes.
After general anaesthesia and muscle relaxants, a short-type pulse current is used. Two types of positions can be achieved, namely bitemporal and unilateral; however, bitemporal has greater efficiency (3).
In Europe, two sessions a week are usually performed to obtain a good compromise between therapeutic effects and adverse cognitive effects (3,Reference Gangadhar, Janakiramaiah, Subbakrishna, Praveen and Reddy6–Reference Svensson, Hallin, Broms, Ekstrand and Tingström10). In USA, three sessions a week are performed to obtain quicker results. There would be no difference in the number of sessions of ECT to achieve. So the time, in weeks, would be shorter for the ‘thrice weekly’ group (Reference Siskind, Charlson, Saraf, Scheurer and Lie11,Reference Charlson, Siskind, Doi, McCallum, Broome and Lie12).
The number of sessions during an ECT treatment varies depending on the severity of depression and on the clinical response. Remission is expected after an average of eight sessions of bilateral (BL) ECT (3). Treatment should be prolonged until complete remission is achieved.
Although the efficacy of ECT has been demonstrated to treat MDD (3,Reference Husain, Kevan, Linnell and Scott13) the brain mechanisms underlying this process remain unclear (Reference Hoy and Fitzgerald14).
Various hypotheses can explain the operation of this treatment. The first hypothesis shows that ECT increases the neurobiological levels of serotonin, dopamine, norepinephrine and acetylcholine, as well as opioid and gamma-aminobutyric acid (GABA) activity (Reference Rudorfer, Henry and Sackeim15). ECT reduces the D2 receptor binding potential of dopamine in the anterior cingulate cortex (Reference Saijo, Takano and Suhara16). It also diminishes the binding potential of 5-HT1A receptors in the anterior cingulate cortex, the frontal region of the orbitofrontal cortex, the amygdala and the hippocampus (Reference Saijo, Takano and Suhara17,Reference Lanzenberger, Baldinger and Hahn18).
The second hypothesis is that ECT increases GABAergic action that diminishes excitation (Reference Sackeim19). And the third hypothesis is that ECT also affects neurogenesis, which has been demonstrated in animals with an increased expression in hippocampal brain derived neurotrophic factor serum levels (Reference Chen, Madsen, Wegener and Nyengaard20–Reference Scott, Wojtowicz and Burnham22). Several studies, including animal models of depression, have shown that ECT induces neurotrophic action on the hippocampus (increased neurogenesis and synaptogenesis and proliferation of glial cells) (Reference Chen, Madsen, Wegener and Nyengaard20,Reference Wennström, Hellsten and Tingström23). Some work has highlighted the neuroplasticity mechanisms following an ECT treatment in regions of interest such as the hippocampus (Reference Lekwauwa, McQuoid and Steffens24–Reference Nordanskog, Dahlstrand, Larsson, Larsson, Knutsson and Johanson26).
Neuroimaging data have revealed a multitude of regions and networks involved in depression that reflect the complexity and diversity of depressive states, both in unipolar and bipolar depression. These studies allowed the identification of a wide cortico-limbic network, including the following:
-
∙ The hippocampus, which is involved in memory, emotion or stress (Reference Blumberg, Kaufman and Martin27).
-
∙ The amygdala, which plays a role in emotions and in anxiety (Reference Stone, Baron-Cohen, Calder, Keane and Young28).
-
∙ The dorsolateral, ventrolateral and medial prefrontal cortices, which are involved in attentional processes, working memory and in decision making (Reference Koenigs and Grafman29).
-
∙ The anterior cingulate cortex, which is involved in the motivational system.
-
∙ The basal ganglia, which play a role in learning routine procedures.
The motor slowing and cognitive disorders observed in depressed people may be due to disturbances in the cortico-limbic system (Reference Mayberg30).
At the neuroanatomical level, the major neural systems for understanding the pathophysiology of depression include those involved in the processing and regulation of emotion and rewards. These systems are altered in depression. They include subcortical systems involved in emotion and reward processes (the amygdala and the ventral striatum); the medial prefrontal cortex and the anterior cingulate gyrus are involved in processing and automatic or implicit emotion regulation, and the lateral prefrontal cortical system (prefrontal cortex and lateral dorsal lateral ventral) is involved in cognitive control and voluntary or forced emotion regulation (Reference Phillips, Ladouceur and Drevets31).
These regions can be conceptualised as a medial prefrontal limbic network including the amygdala, anterior cingulate gyrus and the medial prefrontal cortex, which is modulated by serotonergic neurotransmission (Reference Bertolino, Arciero and Rubino32–Reference Heinz, Smolka and Braus34) and a rewards network centred on the ventral striatum in the interconnection with the medial prefrontal cortex and the orbitofrontal cortex, which is modulated by dopamine (Reference Schultz35).
Neuroimaging studies (Reference Dannlowski, Ohrmann and Bauer36–Reference Surguladze, Brammer and Keedwell40) have shown functional abnormalities of those neural systems in adults with MDD.
A meta-analysis (Reference Fitzgerald, Laird, Maller and Daskalakis41) of the neuroimaging of adults with depressive episodes identified a network focused on the dorsolateral prefrontal cortex and the most dorsal regions of the anterior cingulate gyrus, which show decreased activity in the idle state during depression (improved by the treatment). A second network, centred on the medial prefrontal cortex and subcortical regions, is hyperactivated by emotional stimuli in depression (improved with treatment). This meta-analysis provides evidence that there is increased activity of the neural system involved in processing emotions (amygdala and medial prefrontal cortex) and decreased activity of the neural system involved in emotion regulation (dorsolateral prefrontal cortex).
To our knowledge, there are three reviews (Reference Zhuo and Yu42–Reference Abbott, Gallegos, Rediske, Lemke and Quinn44) about the neuroimaging and ECT. These previous studies focus on systematic reviews of all neuroimaging techniques and not on a specific study of MRI and these studies consider different kind of patients. Bolwig’s review did not target depressions in particular, Zhuo’s work focused only on unipolar depression and Abbott et al. described only longitudinal studies of neuroimaging and not specifically the MRI in depression. To our knowledge, there is no review focusing only on the MRI [structural magnetic resonance imaging (MRI), functional MRI (fMRI) and diffusion tensor imaging (DTI)].’
That is why we have tried to identify the changes that were identified by MRI to try to clarify some operating mechanisms of ECT and we have tried to identify the effect of electrode placement on neuroplasticity.
Materials and methods
A systematic search of the international literature was performed using the bibliographic search engines PubMed and Embase. The research focused on papers published up to 30 September 2015. The following Medical Subject Headings (MESH) terms were used: electroconvulsive therapy AND (MRI OR fMRI, OR DTI) AND depression. We also used the ‘related articles’ of PubMed, the bibliography lists, conference abstracts and Google Scholar to identify additional papers. Only papers published in English were included.
Four authors (A.Y., P.P., L.S. and C.A.) searched the database using a predefined strategy to identify potentially eligible studies. First independently and then jointly, these four authors selected studies based on summaries. All online abstracts were reviewed, and full-text papers were retrieved where relevant. This search procedure followed the PRISMA criteria (preferred reporting items for systematic reviews and meta-analyses) (Reference Moher, Liberati, Tetzlaff and Altman45). Figure 1 summarises the organisational structure of the literature research strategy and the process used for selecting studies.
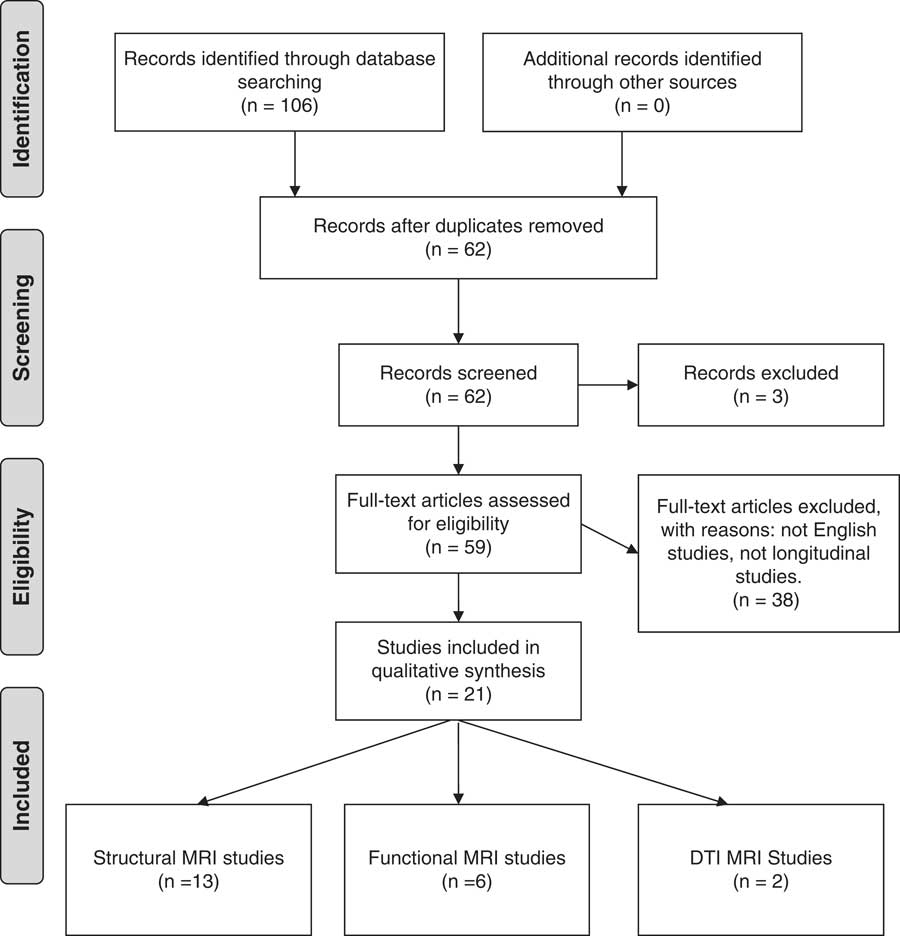
Fig. 1 Flowchart of the search process. DTI, diffusion tensor imging; MRI, magnetic resonance imaging.
Results
General presentation of the results
We identified 24 studies including three reviews. These studies are on sMRI and fMRI.
sMRI (see Table 1)
Table 1 There are 13 studies which are interested in morphological modifications (Reference Nordanskog, Dahlstrand, Larsson, Larsson, Knutsson and Johanson26,Reference Joshi, Espinoza and Pirnia46–Reference Coffey, Figiel, Djang, Cress, Saunders and Weiner57).
Table 1 Structural magnetic resonance imaging (MRI)
ACC, anterior cingulate cortex; CGA, global cortical atrophy; ECT, electroconvulsive therapy; GMV, grey matter volume; MDD, major depressive disorder; MRI, magnetic resonance imaging; RUL, right unilateral; ROI, region of interest; T, Tesla T1, Time 1; VBM, voxel-based morphometry; WMH, white matter hyperintensities.
Only two studies show no change (Reference Kunigiri, Jayakumar, Janakiramaiah and Gangadhar53,Reference Girish, Jayakumar, Murali, Gangadhar, Janakiramaiah and Subbakrishna55).
In different studies, MRIs are performed between 2 h and 6 months after ECT.
There were structural changes according to the sMRI performed before and after ECT treatment. Early studies show changes in the white matter (Reference Coffey, Figiel, Djang, Cress, Saunders and Weiner57).
In the T1 and T2 sequences, there is an immediate increase in volume of the hippocampus and amygdala after ECT (Reference Nordanskog, Dahlstrand, Larsson, Larsson, Knutsson and Johanson26,Reference Abbott, Jones and Lemke50). Second MRIs are performed within 7 days of ECT. There is an increase of subgenual anterior cingulate gyrus as well as right anterior cingulate gyrus (Reference Ota, Noda and Sato47,Reference Dukart, Regen and Kherif49). For these studies, MRIs are performed between 20 days and 3 months after ECT.
Furthermore, there is an increase of grey matter volume (GMV) in insula and posterior superior temporal cortex (1 week after ECT) (Reference Bouckaert, De Winter and Emsell48).These changes do not seem to be entirely due to oedema, as there is no visible modification of these structures on T2 relaxation time. Indeed, there was no significant change in MRI T2 relaxation time with ECT in any of the ROIs studied (thalamus, hippocampus, medial temporal lobe grey matter, medial temporal lobe white matter and dorsolateral frontal cortex) in the most recent studies (Reference Kunigiri, Jayakumar, Janakiramaiah and Gangadhar53). Past studies have hypothesised that ECT produces damage to the blood–brain barrier resulting in the brain oedema (Reference Scott, Douglas, Whitfield and Kendell58). Brain oedema could be detectable by MRI T1 and T2 relaxation times. Oedema is often visible on MRI, and they found no evidence, 2 h after ECT, of oedema in the hippocampus on T2-weighted fluid-attenuated inversion recovery images. These data are not in favour of oedema, contrary to the findings of earlier studies (Reference Kunigiri, Jayakumar, Janakiramaiah and Gangadhar53,Reference Girish, Jayakumar, Murali, Gangadhar, Janakiramaiah and Subbakrishna55,Reference Diehl, Keshavan, Kanal, Nebes, Nichols and Gillen56). The volume of the hippocampus, at baseline, seems indicative of response to ECT (Reference Joshi, Espinoza and Pirnia46). Moreover, a smaller pretreatment regional GMV of the right inferior frontal gyrus seems to be correlated with a faster speed of response. A smaller regional GMV of the left inferior frontal gyrus seems to be correlated with higher remission rates (Reference Oudega, van Exel and Stek59). One study shows that there is an absence of persistent structural change (Reference Szabo, Hirsch and Krause54). Joshi et al. show that lead placement is not shown to significantly influence changes in volume occurring with ECT for the left or right hippocampus or amygdala (Reference Joshi, Espinoza and Pirnia46). Bouckaert et al. (Reference Bouckaert, De Winter and Emsell48), in a post hoc analysis, show the morphometric results remained apparently unchanged when they exclude the four patients in whom right unilateral (RUL) ECT failed and who were switched to BL ECT. Although they find a significant [p<0.05 after family wise errors (FWE) correction] GMV increase only in the right hemisphere (ipsilateral to the stimulation side), they show a GMV increase in both hemispheres using a less conservative uncorrected statistical parametric mapping (SPM) threshold of p<0.001 (cluster-level p<0.05 after FWE correction). BL ECT increases in GMV post-ECT are therefore probable, but these are most pronounced on the right side.
Dukart et al. (Reference Dukart, Regen and Kherif49) show that RUL ECT is correlated with regional increases in local GMV only in the right hemisphere and restricted to (1) the hippocampus, amygdala and anterior temporal pole, (2) the insula and (3) the subgenual cortex. Local GMV decreases associated with ECT were noted in the right middle and inferior frontal cortex and premotor regions. Except for the insula, these results are significant after adjustment for the effects of drug treatment.
Nordanskog et al. (Reference Nordanskog, Dahlstrand, Larsson, Larsson, Knutsson and Johanson26) do not show any correlation between the type of stimulation (unilateral or BL) and structural modification. The increase in volume of the left hippocampus [T1 (before ECT) vs T2 (<7 days after ECT)] was positively correlated to the number of ECT treatments (r=0.67, p<0.05).
A review(Reference Abbott, Gallegos, Rediske, Lemke and Quinn44) concerning sMRI highlights an increase of the hippocampal volume at the 1 week post-ECT imaging assessment. But, hippocampal volume had decreased back to the pre-ECT volumes upon longer follow-up assessments at 180 and 365 days and was not correlated with antidepressant response or side effects (Table 1).
Moreover, it seems that moderate or severe white matter hyperintensities before ECT was associated with higher mortality and global cortical atrophy was possibly associated with cognitive decline upon follow-up. On the other hand, depressed elderly patients with white matter hyperintensities who receive BL ECT are at increased risk of transient cognitive impairment (Reference Oudega, Dols and Adelerhof60,Reference Oudega, van Exel and Wattjes61).
fMRI (see Table 2)
Table 2 There are six studies which are interested in functional modifications (Reference Abbott, Jones and Lemke50,Reference Abbott, Lemke and Gopal62–Reference Christ, Michael and Hihn66). All studies show changes in fMRI.
Table 2 Functional magnetic resonance imaging (MRI)
DLPFC, dorsolateral prefrontal cortex; DMPFC, dorsomedial prefrontal Cortex; ECT, electroconvulsive therapy; fMRI, functional MRI; MRI, magnetic resonance imaging; RUL, right unilateral; ROI, region of interest; T, Tesla T1, Time 1.
This investigation assessed the resting-state functional network connectivity associated with the ECT response in MDD. Abbott et al. show that ECT response reverses the relationship from negative to positive between the two pairs of networks: the relationship from negative to positive between the posterior default mode and the dorsomedial prefrontal cortex, and between the posterior default mode and the dorsolateral prefrontal cortex (DLPFC) (Reference Abbott, Lemke and Gopal62).
There is a consistent increase in connectivity to the right DLPFC and posterior cingulate cortex after ECT during working memory and affective tasks (Reference Beall, Malone and Dale65). In addition, there is a decrease in activity in the frontal, temporal, parietal, occipital gyrus and anterior lobes after ECT using auditory stimuli (Reference Christ, Michael and Hihn66). Right hippocampal connectivity seems to be increased (normalised) after the ECT series and correlated with depressive symptom reduction (Reference Abbott, Jones and Lemke50). Christ et al (Reference Christ, Michael and Hihn66) use tonal stimulation to assess the impact of ECT treatment on auditory related networks. They show that depressed patients reduced activation of several cortical areas during ECT course. This indicates that ECT may elicit an unspecific inhibitory effect on neuronal activity. Moreover, sensory perception is still altered post-ECT, even if ECT is effective.
These two studies (Reference Beall, Malone and Dale65,Reference Christ, Michael and Hihn66) are resumed in the review of Abbott (Reference Abbott, Gallegos, Rediske, Lemke and Quinn44).
Another review (Reference Bolwig43) highlights fMRI studies. In this review, many studies point to an increased intrinsic connectivity in several neuronal networks implicated in different aspects of depression.
Wei et al. (Reference Wei, Tian and Yu63) do not show any correlation between the type of stimulation (unilateral or BL) and modification functional (Table 2).
DTI (see Table 3)
Table 3 There are two studies using MRI DTI. ECT in depressive disorder seems to be associated with an increase of fractional anisotropy in dorsal fronto-limbic circuits encompassing the anterior cingulum, forceps minor and left superior longitudinal fasciculus between baseline and transition to maintenance therapy. And, it seems to be associated with a decrease in radial diffusivity and average diffusivity are observed in overlapping regions and the anterior thalamic radiation (Reference Lyden, Espinoza and Pirnia67). Jorgensen et al. (Reference Jorgensen, Magnusson and Hanson68) show that hippocampal and amygdala volume increased significantly at 1 week after the series of ECT and continued to be increased at 4 weeks.
Table 3 Diffusion tensor imging (DTI)
DLPFC, dorsolateral prefrontal cortex; DTI, diffusion tensor imaging; ECT, electroconvulsive therapy; FA, fractional anisotropy; FOV, field of view; FSL, FMRIB software library; MD, mean diffusivity; MDD, major depressive disorder; MRI, magnetic resonance imaging; MPRAGE, magnetization-prepared rapid acquisition with gradient echo; RD, radial diffusivity; RUL, right unilateral; TBSS, tract-based spatial statistic; VBM, voxel-based morphometry.
DLPFC exhibited atransient volume reduction at 1 week after the series of ECT.
DTI reveal a reduced anisotropy and diffusivity of the hippocampus at 1 week.
Discussion
This systematic review highlights brain structural and functional changes during treatment with ECT. The studies explored in this article can improve the understanding of the most effective therapeutic in MDD. This also allows to improve the understanding of the pathophysiology of depression. There are higher amygdalae and hippocampus volumes post-ECT and, without this increase, there would be long-term oedema. It seems that there is an improvement in functional connectivity in some networks (between the posterior default mode and dorsal medial prefrontal cortex and posterior default mode and the dorsal lateral prefrontal cortex left). In the MRI performed before starting ECT and after ECT remission using auditory stimuli, there was a decrease in the temporal, parietal, occipital gyrus and anterior lobe activities. Moreover, low hippocampal volume and a large volume of grey matter of the inferior frontal gyrus seems to be markers of poor treatment response (Reference Joshi, Espinoza and Pirnia46,Reference Oudega, van Exel and Stek59). There seems to be predictive of response to treatment. However, these results should be put into perspective, because the length of time of the scan after the last ECT varies significantly from one study to another. It is therefore difficult to generalise these results to all patients with ECT.
Our review complements three references (Reference Zhuo and Yu42–Reference Abbott, Gallegos, Rediske, Lemke and Quinn44) that are dedicated to all neuroimaging investigations, focusing on MRI. The results of our review seem coherent with the existing data of the science. The depressive disorder seems to have an echo on the median temporal lobe (in particular hippocampus and amygdala) (Reference Peng, Chen, Yin, Jia and Gong69). The antidepressant treatments seem to act on these structures, too. The action of the ECT, both at the morphological and structural level, could correspond to an antidepressant mechanism of action (Reference Fu, Costafreda and Sankar70). Unlike the repetitive transcranial magnetic stimulation (rTMS) which seems to have a localised effect on fractional anisotropy (FA) values in the prefrontal white matter of the left hemisphere (side stimulated with rTMS) (Reference Kozel, Johnson and Nahas71).
Moreover, the changes reported in these human studies go in the same direction as the animal data. Several studies, including animal models of depression, explain that ECT induce a neurotrophic effect on hippocampus and amygdala (Reference Chen, Madsen, Wegener and Nyengaard20,Reference Wennström, Hellsten and Tingström23).
There were limits in these studies.
First, the limits are for sample sizes. Some of the studies had small sample sizes. The largest study included 36 patients. The small sample sizes (average sample of included studies) limit the ability to detect differences in whole-brain analyses and correlate with symptom improvement. Because patients who receive ECT are mostly patients with a certain level of severity and urgency, the possibility to perform several MRI studies is complicated.
Second, the limits are for ECT. Most studies are done with a unilateral placement of electrodes, or with mixed populations (unilateral and BL placement of electrodes). Only three studies were performed with a bitemporal placement of electrodes (Reference Tendolkar, van Beek and van Oostrom51,Reference Perrin, Merz and Bennett64,Reference Beall, Malone and Dale65) and only one with a bifrontal placement . It would therefore be of considerable interest to conduct a study to investigate the effect of electrode placement on brain plasticity after ECT (particularly taking into account new techniques such as FEAST). However, different parameters of ECTs, in addition to the electrode placement, have a role in the efficacy and tolerance of ECT (Reference Peterchev, Rosa, Deng, Prudic and Lisanby72). But it does not appear that these various parameters have been considered in the data analysis. Only the brief pulse current was used in all studies. We know that there are more cognitive side effects with a bitemporal placement of electrodes than an unilateral placement in the right hemisphere (Reference Sackeim, Prudic, Fuller, Keilp, Lavori and Olfson73,Reference Sackeim, Prudic and Nobler74). Therefore, it is possible that with different parameters, the brain structures involved are not the same or they do not have the same intensity. Indeed, the cognitive findings consistently indicate that electrode placement (RUL vs BL) is a more powerful determinant of short-term and long-term deficits than stimulus dosage. Higher stimulus intensity seems to be associated with greater impairment in a variety of acute (postictal) cognitive measures, and selective measures of anterograde amnesia during the week following ECT. But, BL ECT (independent of dosage) seems to result in more profound anterograde and retrograde amnesia during the week following ECT and greater retrograde amnesia at 2-month post-ECT follow-up. So, the effects of stimulus intensity on cognitive parameters wear off rapidly, whereas the effects of electrode placement are persistent. It is also noteworthy that, for both efficacy and cognitive effects, the degree to which electrical dosage exceeds the threshold (1 vs 2.5) is predictive of outcomes, but absolute electrical dosage has no such relations. Some studies show that the severity of cognitive effects and efficacy of treatment conditions are fully dissociated. A number of studies highlight comparable therapeutic efficiency between RUL ECT with high stimuli intensity and BL ECT. But it would seem that the RUL is better tolerated (Reference Sackeim, Prudic and Devanand75–Reference Sackeim77). UltraBrief stimulus RUL ECT have a clear advantage over UB BL ECT in both cognitive and therapeutic outcomes (Reference Sackeim77). The use of an ultrabrief stimulus markedly reduces adverse cognitive effects, and when coupled with markedly suprathreshold RUL ECT, also preserves efficacy (Reference Sackeim, Prudic and Nobler74).There also seems to be a correlation between the individual threshold and the percentage reduction in Hamilton scores [−0.38 (p=0.05)] (Reference Sackeim, Decina, Portnoy, Neeley and Malitz78). The evaluation of the data of neuroimaging post-ECT seems to be able to be only made according to these various parameters.
Third, the limits are for MRI methods. The studies presented do not take into account new ECT techniques, such as FEAST (Reference Spellman, Peterchev and Lisanby79,Reference Nahas, Short and Burns80), which seem to be interesting in terms of their tolerance and effectiveness. Currently, there is only one study in SPECT imaging after a session of FEAST (Reference Chahine, Short and Spicer81) which shows a much more focused action. It would be interesting to compare classical ECT with FEAST in terms of their relative clinical efficacy and safety, in particular at the cognitive level, and the impact on brain structures involved in mood and in cognition with MRI imaging techniques.
No study reported simultaneously the impact of an effective ECT session in brain structure and function. Currently, the exact operation of ECT in depression remains unclear. In a few studies, DTI imaging sequences were missing. These data would more precisely determine the connectivity that exists after ECT treatment. Similar to the studies of Parkinson’s disease (Reference Péran, Cherubini and Assogna82–Reference Péran, Hagberg and Luccichenti84), multimodal MRI could help us improve our knowledge of ECT. The multimodal MRI is a combination of several quantitative magnetic resonance parameters sensitive to complementary tissue characteristics (i.e. volume atrophy, iron deposition and microstructural damage). These structural biomarkers could be associated to functional markers in the same exam (using resting-state fMRI). So, from a single MRI exam, we can measure several sequences [anatomical three-dimensional T1-weighted images, DTI, and resting-state fMRI] able to provide structural and functional brain indices. Even if DTI is conventionally used to evaluate white matter tracts and to measure the degree of anisotropy by calculating the FA, DTI could also be used to measure mean diffusivity (MD) in the grey matter reflecting microstructural integrity. In addition to classical structural markers of atrophy, MD can bring complementary information about grey matter integrity. Indeed, an increase in MD and decreased fraction anisotropy reflect a progressive loss of barriers restricting the movement of water molecules in tissue compartments, which is associated with neuronal loss and myelin sheath degradation. Previous MRI studies investigating physiological aging (Reference Cherubini, Péran, Caltagirone, Sabatini and Spalletta85), neurodegenerative diseases (Reference Péran, Cherubini and Assogna82,Reference Cherubini, Péran and Spoletini86,Reference Eustache, Nemmi, Saint-Aubert, Pariente and Péran87), or psychiatric diseases (Reference Spoletini, Cherubini and Banfi88) showed the complementary aspect of atropy markers and MD parameter. Another potential MRI technique is the quantification of mineral levels in the brain. MR relaxometry (T2*) is a sensitive method to evaluate the brain iron content in vivo. Iron accumulation has been implicated in the pathogenesis of many neurodegenerative diseases (Reference Péran, Cherubini and Luccichenti83,Reference Cerasa, Cherubini, Peran, Cerasa, Cherubini and Peran89). They could be associated with functional imaging markers extracted from resting-state fMRI (e.g. connectivity strength of the default network mode). Thus, from a single MRI exam, we can measure structural and functional brain changes simultaneously. These imaging results reveal possible future research opportunities in studying the mechanism of action of ECT and the pathophysiology of depression. It seems important to move towards multimodal MRI studies in the future.
We found MRI works separately investigating structural and functional brain changes post-ECT. Because of the limits of previous studies discussed above, it is necessary to conduct investigations using multimodal MRI able to provide complementary aspects about the complex changes linked to ECT. These further studies could provide information concerning the structuro–functional modifications at different steps of the ECT therapy (after a single ECT, after an effective ECT, and after a whole ECT cure).
Acknowledgements
None. Authors’ contributions: four authors (A.Y., P.P., L.S. and C.A.) searched the database using a predefined strategy to identify potentially eligible studies. First independently and then jointly, these four authors selected studies based on summaries. A.Y. and A.S. are co-writing the article based on data selected by A.Y., P.P., L.S. and C.A.
Financial Support
This research received no specific grant from any funding agency or from commercial or not-for-profit sectors.
Conflicts of Interest
None.


