


1 Introduction
When an underwater bubble is generated close to a free surface, the resultant surface wave shows an overall rising jet-like behaviour. During this event, the initial spherical bubble expands, collapses and evolves into a non-spherical bubble (a dented sphere, a hemisphere, a spherical frustum or a toroid), migrating downwards away from the free surface; some parts of the bubble are disintegrated and are left behind. The overall behaviour of the bubble and the surface wave altogether can be understood in the context of the action–reaction momentum principle. These phenomena have potential application areas such as jet printing (Dadvand, Khoo & Shervani-Tabar Reference Dadvand, Khoo and Shervani-Tabar2009), droplet separation (Xiong et al.
Reference Xiong, Chin, Ando, Tandiono, Liu and Ohl2015), micro-surface cleaning (Ohl et al.
Reference Ohl, Arora, Dijkink, Janve and Lohse2006; Reuter & Mettin Reference Reuter and Mettin2016), laser-based printing techniques (Tomita, Kodama & Shima Reference Tomita, Kodama and Shima1991; Duocastella et al.
Reference Duocastella, Fernández-Pradas, Morenza and Serra2009, Reference Duocastella, Patrascioiu, Fernández-Pradas, Morenza and Serra2010; Brown, Kattamis & Arnold Reference Brown, Kattamis and Arnold2011; Patrascioiu et al.
Reference Patrascioiu, Fernández-Pradas, Palla-Papavlu, Morenza and Serra2014) and underwater explosions (Geers & Hunter Reference Geers and Hunter2002; Klaseboer et al.
Reference Klaseboer, Hung, Wang, Wang, Khoo, Boyce, Debono and Charlier2005; Gong et al.
Reference Gong, Ohl, Klaseboer and Khoo2010). Early works focused on concurrent motions of the bubble and unbounded or bounded free surface (Benjamin & Ellis Reference Benjamin and Ellis1966; Chahine Reference Chahine1977; Blake & Gibson Reference Blake and Gibson1981; Best & Kucera Reference Best and Kucera1992; Zhang, Duncan & Chahine Reference Zhang, Duncan and Chahine1993; Wang et al.
Reference Wang, Yeo, Khoo and Lam1996a
,Reference Wang, Yeo, Khoo and Lam
b
; Khoo, Klaseboer & Hung Reference Khoo, Klaseboer and Hung2005; Lew, Klaseboer & Khoo Reference Lew, Klaseboer and Khoo2007; Dadvand et al.
Reference Dadvand, Khoo and Shervani-Tabar2009; Shervani-Tabar et al.
Reference Shervani-Tabar, Dadvand, Khoo and Nobari2009; Dadvand, Shervani-Tabar & Khoo Reference Dadvand, Shervani-Tabar and Khoo2011). In particular, Chahine (Reference Chahine1977) analytically and experimentally studied the bubble-induced surface jet phenomena on the unbounded free surface according to the dimensionless parameter
 $d/R_{m}$
, where
$d/R_{m}$
, where
 $d$
is the inception position of the bubble below the free surface and
$d$
is the inception position of the bubble below the free surface and
 $R_{m}$
is the maximum radius of the bubble. The overall length scales of
$R_{m}$
is the maximum radius of the bubble. The overall length scales of
 $R_{m}$
and
$R_{m}$
and
 $d$
are of the order of a few hundreds of millimetres and the surface tension is neglected in the perturbation analysis. Blake & Gibson (Reference Blake and Gibson1981) numerically and experimentally studied the bubble-induced surface jet phenomena on the unbounded free surface according to the dimensionless parameter
$d$
are of the order of a few hundreds of millimetres and the surface tension is neglected in the perturbation analysis. Blake & Gibson (Reference Blake and Gibson1981) numerically and experimentally studied the bubble-induced surface jet phenomena on the unbounded free surface according to the dimensionless parameter
 $d/R_{m}$
. The overall length scales of
$d/R_{m}$
. The overall length scales of
 $R_{m}$
and
$R_{m}$
and
 $d$
are of the order of a few tens of millimetres and the surface tension is neglected in their numerical simulations. Dadvand et al. (Reference Dadvand, Khoo and Shervani-Tabar2009) experimentally studied mainly on the bubble-induced surface jet phenomena through a hole of a rigid plate overlaid on the free surface according to the dimensionless parameters
$d$
are of the order of a few tens of millimetres and the surface tension is neglected in their numerical simulations. Dadvand et al. (Reference Dadvand, Khoo and Shervani-Tabar2009) experimentally studied mainly on the bubble-induced surface jet phenomena through a hole of a rigid plate overlaid on the free surface according to the dimensionless parameters
 $d/R_{m}$
and
$d/R_{m}$
and
 $D/2R_{m}$
, where
$D/2R_{m}$
, where
 $D$
is the hole diameter of a rigid plate. In their work, there are also two exemplary experimental results regarding the bubble-induced surface jet phenomena on the unbounded free surface according to the dimensionless parameter
$D$
is the hole diameter of a rigid plate. In their work, there are also two exemplary experimental results regarding the bubble-induced surface jet phenomena on the unbounded free surface according to the dimensionless parameter
 $d/R_{m}$
. The overall length scales of
$d/R_{m}$
. The overall length scales of
 $R_{m}$
,
$R_{m}$
,
 $d$
and
$d$
and
 $D$
are of the order of a few millimetres. Dadvand et al. (Reference Dadvand, Shervani-Tabar and Khoo2011) numerically and experimentally studied bubble-induced surface jet phenomena through a hole in a rigid plate overlaid on the free surface and surface jet phenomena on the free surface confined by a cylindrical wall, according to the dimensionless parameters
$D$
are of the order of a few millimetres. Dadvand et al. (Reference Dadvand, Shervani-Tabar and Khoo2011) numerically and experimentally studied bubble-induced surface jet phenomena through a hole in a rigid plate overlaid on the free surface and surface jet phenomena on the free surface confined by a cylindrical wall, according to the dimensionless parameters
 $d/R_{m}$
and
$d/R_{m}$
and
 $D/2R_{m}$
, where
$D/2R_{m}$
, where
 $D$
is the hole diameter of a rigid surface or the diameter of the cylindrical wall. The overall length scales of
$D$
is the hole diameter of a rigid surface or the diameter of the cylindrical wall. The overall length scales of
 $R_{m}$
,
$R_{m}$
,
 $d$
and
$d$
and
 $D$
are of the order of a few millimetres and the surface tension is not neglected in the numerical simulation. In the above works, when
$D$
are of the order of a few millimetres and the surface tension is not neglected in the numerical simulation. In the above works, when
 $d/R_{m}$
is relatively large, the free surface rises and falls with the expansion and collapse of the bubble, i.e. in-phase motion. The shape of the free surface looks like a wide small hump. When
$d/R_{m}$
is relatively large, the free surface rises and falls with the expansion and collapse of the bubble, i.e. in-phase motion. The shape of the free surface looks like a wide small hump. When
 $d/R_{m}$
is relatively small, the free surface rises during the expansion of the bubble (in phase) and continues to rise during and after the collapse of the bubble (out of phase). The shape of the free surface looks like a narrow tall jet. At the tip of the jet-like surface wave, droplets are generated when
$d/R_{m}$
is relatively small, the free surface rises during the expansion of the bubble (in phase) and continues to rise during and after the collapse of the bubble (out of phase). The shape of the free surface looks like a narrow tall jet. At the tip of the jet-like surface wave, droplets are generated when
 $R_{m}$
is a few millimetres (Dadvand et al.
Reference Dadvand, Khoo and Shervani-Tabar2009, Reference Dadvand, Shervani-Tabar and Khoo2011) and no droplets are generated when
$R_{m}$
is a few millimetres (Dadvand et al.
Reference Dadvand, Khoo and Shervani-Tabar2009, Reference Dadvand, Shervani-Tabar and Khoo2011) and no droplets are generated when
 $R_{m}$
is a few tens (Chahine Reference Chahine1977) or hundreds of millimetres (Blake & Gibson Reference Blake and Gibson1981).
$R_{m}$
is a few tens (Chahine Reference Chahine1977) or hundreds of millimetres (Blake & Gibson Reference Blake and Gibson1981).
From the above literature review, we see that the motion of the unbounded free surface induced by a millimetre-size underwater bubble has not been fully studied. As mentioned, in Dadvand et al. (Reference Dadvand, Khoo and Shervani-Tabar2009), whose main interest is in the motion of the bounded free surface induced by a millimetre-size underwater bubble, this unbounded-free-surface case was briefly mentioned by showing only two different sets of snapshots of the surface-jet behaviours for two different values of
 $d/R_{m}$
. One example is the free-surface spike composed of a single main jet inside and splash-like side jets outside. The other example is the free-surface jet with sequential or simultaneous formation of multiple pinched-off droplets at the tip or from some points of the jet column with a certain height. No further attempt is made, however, to observe the various wave phenomena on the unbounded free surface induced by a millimetre-size underwater bubble according to other values of
$d/R_{m}$
. One example is the free-surface spike composed of a single main jet inside and splash-like side jets outside. The other example is the free-surface jet with sequential or simultaneous formation of multiple pinched-off droplets at the tip or from some points of the jet column with a certain height. No further attempt is made, however, to observe the various wave phenomena on the unbounded free surface induced by a millimetre-size underwater bubble according to other values of
 $d/R_{m}$
. Therefore, this is one subject of the present paper. To summarize in advance, when
$d/R_{m}$
. Therefore, this is one subject of the present paper. To summarize in advance, when
 $d/R_{m}>1.3$
, the surface wave shows a simple smooth hump (case 1). When
$d/R_{m}>1.3$
, the surface wave shows a simple smooth hump (case 1). When
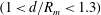
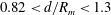 $0.82<d/R_{m}<1.3$
, a single droplet or multiple droplets are pinched off sequentially or simultaneously at the tip or from some points of the jet-like surface wave (case 2). Finally, when
$0.82<d/R_{m}<1.3$
, a single droplet or multiple droplets are pinched off sequentially or simultaneously at the tip or from some points of the jet-like surface wave (case 2). Finally, when
 $d/R_{m}<0.82$
, a series of squirting and jetting phenomena are observed at the top of the jet-like surface wave (case 3).
$d/R_{m}<0.82$
, a series of squirting and jetting phenomena are observed at the top of the jet-like surface wave (case 3).

Figure 1. Schematics for the simplified motion of a 3-D axisymmetric jet-like surface wave induced by the motion of an underwater bubble for case 1. (a) Inception of a bubble. (b) Bubble expansion. (c) Growth of the 3-D axisymmetric jet-like surface wave during the bubble collapse. (d) 3-D axisymmetric jet-like surface wave at its maximum height after the bubble collapse.
Next, in particular for case 1 (a simple smooth hump with no droplets, figure 1), based on behavioural observations, we can experimentally find that there exists the relationship
 $$\begin{eqnarray}\frac{\unicode[STIX]{x1D70C}gh}{\unicode[STIX]{x0394}p}=\text{function}\left(\frac{d}{R_{m}}\right),\end{eqnarray}$$
where
 $h$
is the maximum height of the jet-like surface wave,
$h$
is the maximum height of the jet-like surface wave,
 $\unicode[STIX]{x1D70C}$
is the density of the fluid,
$\unicode[STIX]{x1D70C}$
is the density of the fluid,
 $g$
is gravitational acceleration and
$g$
is gravitational acceleration and
 $\unicode[STIX]{x0394}p=p_{\infty }-p_{v}$
is the difference between the reference atmospheric pressure (
$\unicode[STIX]{x0394}p=p_{\infty }-p_{v}$
is the difference between the reference atmospheric pressure (
 $p_{\infty }$
) and the vapour pressure inside a bubble (
$p_{\infty }$
) and the vapour pressure inside a bubble (
 $p_{v}$
); in the present experimental work, an underwater bubble is made by an electric spark (§ 2). The use of the parameter
$p_{v}$
); in the present experimental work, an underwater bubble is made by an electric spark (§ 2). The use of the parameter
 $\unicode[STIX]{x0394}p=p_{\infty }-p_{v}$
can be found in many previous numerical and experimental works (Blake & Gibson Reference Blake and Gibson1981, Reference Blake and Gibson1987; Wang et al.
Reference Wang, Yeo, Khoo and Lam1996a
,Reference Wang, Yeo, Khoo and Lam
b
; Robinson et al.
Reference Robinson, Blake, Kodama, Shima and Tomita2001; Pearson et al.
Reference Pearson, Cox, Blake and Otto2004; Dadvand et al.
Reference Dadvand, Shervani-Tabar and Khoo2011; Pain et al.
Reference Pain, Hui Terence Goh, Klaseboer, Ohl and Khoo2012). A lot of heat is generated and the pressure inside the bubble is very high at the beginning. Very soon after the bubble expands, the saturated vapour pressure (
$\unicode[STIX]{x0394}p=p_{\infty }-p_{v}$
can be found in many previous numerical and experimental works (Blake & Gibson Reference Blake and Gibson1981, Reference Blake and Gibson1987; Wang et al.
Reference Wang, Yeo, Khoo and Lam1996a
,Reference Wang, Yeo, Khoo and Lam
b
; Robinson et al.
Reference Robinson, Blake, Kodama, Shima and Tomita2001; Pearson et al.
Reference Pearson, Cox, Blake and Otto2004; Dadvand et al.
Reference Dadvand, Shervani-Tabar and Khoo2011; Pain et al.
Reference Pain, Hui Terence Goh, Klaseboer, Ohl and Khoo2012). A lot of heat is generated and the pressure inside the bubble is very high at the beginning. Very soon after the bubble expands, the saturated vapour pressure (
 $p_{v}$
) will be achieved, which is found to be about 20 kPa (vapour pressure at
$p_{v}$
) will be achieved, which is found to be about 20 kPa (vapour pressure at
 $60\,^{\circ }\text{C}$
), or
$60\,^{\circ }\text{C}$
), or
 $\unicode[STIX]{x0394}p=p_{\infty }-p_{v}=80~\text{kPa}$
(§ 3.4). Other values of vapour pressures were used in previous works, for example,
$\unicode[STIX]{x0394}p=p_{\infty }-p_{v}=80~\text{kPa}$
(§ 3.4). Other values of vapour pressures were used in previous works, for example,
 $p_{v}=50~\text{kPa}$
(Buogo & Cannelli Reference Buogo and Cannelli2002; Dadvand et al.
Reference Dadvand, Shervani-Tabar and Khoo2011) and
$p_{v}=50~\text{kPa}$
(Buogo & Cannelli Reference Buogo and Cannelli2002; Dadvand et al.
Reference Dadvand, Shervani-Tabar and Khoo2011) and
 $p_{v}=30~\text{kPa}$
(Turangan et al.
Reference Turangan, Ong, Klaseboer and Khoo2006). To the present authors’ knowledge, the functional relationship (1.1) has not been reported for the unbounded free-surface wave induced by a millimetre-size underwater bubble. Therefore, this is another subject of the present paper.
$p_{v}=30~\text{kPa}$
(Turangan et al.
Reference Turangan, Ong, Klaseboer and Khoo2006). To the present authors’ knowledge, the functional relationship (1.1) has not been reported for the unbounded free-surface wave induced by a millimetre-size underwater bubble. Therefore, this is another subject of the present paper.
Although the gravity and the surface tension can be neglected in terms of the bubble dynamics, those may be important in the motion of a jet-like surface wave after a bubble collapses and migrates far away from the free surface. The third subject of the present paper is the verification of whether this jet-like surface wave observed in the experiment is a gravity wave, a gravity–capillary wave or a capillary wave. For this purpose, we solve the relevant Cauchy–Poisson problem. The original Cauchy–Poisson problem is a two-dimensional initial-value problem for the resultant gravity waves on deep water for a given locally confined initial wave elevation (Miles Reference Miles1968; Lamb Reference Lamb1993; Debnath Reference Debnath1994; Stoker Reference Stoker2011). In the present case, the relevant Cauchy–Poisson problem to be solved is a three-dimensional one where the initial condition is a 3-D axisymmetric jet-like surface wave at its maximum height generated by an underwater bubble. The comparison between the analytical wave solution to the Cauchy–Poisson problem and the experimental result is new.
In § 2 the experimental set-up will be described for the study on the jet-like wave motion of a free surface caused by the motion of an electric-spark-generated millimetre-sized underwater bubble near the free surface. In the experiment, the overall length scales of the inception position of the bubble (
 $d$
) below the free surface and the maximum radius of the bubble (
$d$
) below the free surface and the maximum radius of the bubble (
 $R_{m}$
) are of the order of a few millimetres. The maximum height of the resultant after-collapse jet-like surface wave is a few times larger than the lengths scales of
$R_{m}$
) are of the order of a few millimetres. The maximum height of the resultant after-collapse jet-like surface wave is a few times larger than the lengths scales of
 $d$
and
$d$
and
 $R_{m}$
. In § 3 we will present three different jet-like surface-wave phenomena according to
$R_{m}$
. In § 3 we will present three different jet-like surface-wave phenomena according to
 $d/R_{m}$
during the whole time from the inception of a bubble to the after-collapse of the bubble. In addition to these behavioural observations, we will present a proportional relationship between
$d/R_{m}$
during the whole time from the inception of a bubble to the after-collapse of the bubble. In addition to these behavioural observations, we will present a proportional relationship between
 $\unicode[STIX]{x1D70C}gh/\unicode[STIX]{x0394}p$
and
$\unicode[STIX]{x1D70C}gh/\unicode[STIX]{x0394}p$
and
 $(d/R_{m})^{-4.4}$
. In § 4 the experimentally found relationship is explained semi-analytically using a scaling argument and conservation of momentum and energy, with the help of the Kelvin impulse theory. In § 5 we solve the relevant axisymmetric Cauchy–Poisson problem where the initial condition is a jet-like surface wave near its maximum height. By comparing the analytical wave solution with the observed surface wave pattern, it is found that the resultant surface waves are indeed gravity–capillary waves where both the gravity and the surface tension are equally important. Finally, § 6 provides a summary.
$(d/R_{m})^{-4.4}$
. In § 4 the experimentally found relationship is explained semi-analytically using a scaling argument and conservation of momentum and energy, with the help of the Kelvin impulse theory. In § 5 we solve the relevant axisymmetric Cauchy–Poisson problem where the initial condition is a jet-like surface wave near its maximum height. By comparing the analytical wave solution with the observed surface wave pattern, it is found that the resultant surface waves are indeed gravity–capillary waves where both the gravity and the surface tension are equally important. Finally, § 6 provides a summary.

Figure 2. (a) Schematic of the experimental set-up, (b) discharged electric energy between the two electrodes (
 $E$
) and the maximum radius of the bubble (
$E$
) and the maximum radius of the bubble (
 $R_{m}$
), (c) three different behavioural cases.
$R_{m}$
), (c) three different behavioural cases.
2 Experimental set-up
We experimentally observe the various motions of jet-like surface waves according to various values of
 $d/R_{m}$
, where
$d/R_{m}$
, where
 $d$
is the vertical position of the spark point or the inception position of the bubble below the free surface and
$d$
is the vertical position of the spark point or the inception position of the bubble below the free surface and
 $R_{m}$
is the maximum radius of the bubble generated. Figure 2(a) shows the schematic of the experimental set-up. Experiments were carried out in a transparent acrylic water tank whose length, width and height are all 20 cm and whose wall thickness is 1 cm. The tank was filled with distilled water (
$R_{m}$
is the maximum radius of the bubble generated. Figure 2(a) shows the schematic of the experimental set-up. Experiments were carried out in a transparent acrylic water tank whose length, width and height are all 20 cm and whose wall thickness is 1 cm. The tank was filled with distilled water (
 $0.073~\text{N}~\text{m}^{-1}$
at
$0.073~\text{N}~\text{m}^{-1}$
at
 $20\,^{\circ }\text{C}$
by a Du Noüy ring-type tensiometer (Du Noüy Reference Du Noüy1925)) and the water depth was 16 cm. An electric circuit was prepared to create an underwater bubble between two electrodes where the electric energy was discharged in the form of a spark. Similar kinds of experimental set-up were used in previous works (Lew et al.
Reference Lew, Klaseboer and Khoo2007; Dadvand et al.
Reference Dadvand, Khoo and Shervani-Tabar2009, Reference Dadvand, Shervani-Tabar and Khoo2011; Shervani-Tabar et al.
Reference Shervani-Tabar, Dadvand, Khoo and Nobari2009; Pain et al.
Reference Pain, Hui Terence Goh, Klaseboer, Ohl and Khoo2012). The circuit has two loops: an energy-charging loop and a energy-discharging loop. The energy-charging loop consists of a DC power supply (
$20\,^{\circ }\text{C}$
by a Du Noüy ring-type tensiometer (Du Noüy Reference Du Noüy1925)) and the water depth was 16 cm. An electric circuit was prepared to create an underwater bubble between two electrodes where the electric energy was discharged in the form of a spark. Similar kinds of experimental set-up were used in previous works (Lew et al.
Reference Lew, Klaseboer and Khoo2007; Dadvand et al.
Reference Dadvand, Khoo and Shervani-Tabar2009, Reference Dadvand, Shervani-Tabar and Khoo2011; Shervani-Tabar et al.
Reference Shervani-Tabar, Dadvand, Khoo and Nobari2009; Pain et al.
Reference Pain, Hui Terence Goh, Klaseboer, Ohl and Khoo2012). The circuit has two loops: an energy-charging loop and a energy-discharging loop. The energy-charging loop consists of a DC power supply (
 $V_{1}=55~\text{V}$
), a capacitor (
$V_{1}=55~\text{V}$
), a capacitor (
 $C=5000~\unicode[STIX]{x03BC}\text{F}$
), a resistor (
$C=5000~\unicode[STIX]{x03BC}\text{F}$
), a resistor (
 $R=1~\text{k}\unicode[STIX]{x03A9}$
) and a switch. The energy-discharging loop consists of the same capacitor, two electrodes and the switch. The submerged part of the energy-discharging loop including two copper-alloy electrodes (0.05, 0.08, 0.102, 0.127 and 0.16 mm in diameter) is firmly held using a custom-made structure. When the switch is connected to node 1, the energy-charging loop is closed in series and the capacitor is charged with the electric potential
$R=1~\text{k}\unicode[STIX]{x03A9}$
) and a switch. The energy-discharging loop consists of the same capacitor, two electrodes and the switch. The submerged part of the energy-discharging loop including two copper-alloy electrodes (0.05, 0.08, 0.102, 0.127 and 0.16 mm in diameter) is firmly held using a custom-made structure. When the switch is connected to node 1, the energy-charging loop is closed in series and the capacitor is charged with the electric potential
 $V_{1}=55~\text{V}$
. Then the switch is disconnected from node 1 and is connected to node 2. Then the energy-charging loop is open and the energy-discharging loop is closed in series, making the electric potential between the capacitor the value of
$V_{1}=55~\text{V}$
. Then the switch is disconnected from node 1 and is connected to node 2. Then the energy-charging loop is open and the energy-discharging loop is closed in series, making the electric potential between the capacitor the value of
 $V_{2}=47.5{-}53.7~\text{V}$
. As a result, the electric energy
$V_{2}=47.5{-}53.7~\text{V}$
. As a result, the electric energy
 $E=C(V_{1}^{2}-V_{2}^{2})/2=0.35{-}1.92~\text{J}$
is discharged instantly between the two electrodes, generating a bubble with a certain size (1.5–3.6 mm) (figure 2
b). This is much larger than the diameter of the electrode (0.05, 0.08, 0.102, 0.127 and 0.16 mm), thus its influence on the bubble can be assumed to be negligible, and it really is so from observation. We found that, when the two electrodes slightly touch each other at an angle of about 140
$E=C(V_{1}^{2}-V_{2}^{2})/2=0.35{-}1.92~\text{J}$
is discharged instantly between the two electrodes, generating a bubble with a certain size (1.5–3.6 mm) (figure 2
b). This is much larger than the diameter of the electrode (0.05, 0.08, 0.102, 0.127 and 0.16 mm), thus its influence on the bubble can be assumed to be negligible, and it really is so from observation. We found that, when the two electrodes slightly touch each other at an angle of about 140
 $^{\circ }$
, a single intact bubble is best generated at the spark point. For other touching angles, a mis-spark or unintended sequential bubbles are generated. In the experiment, the vertical position (d) of the spark point below the free surface is varied (0.28–7 mm) and its horizontal position from the wall is fixed at 4 cm, which is confirmed to be far enough for both motions of an underwater bubble and the induced jet-like surface wave not to be influenced from the existence of the wall. For the shadow images of those motions, the adopted overall configuration is ‘camera’, ‘objects (bubble and the free surface above it)’ and ‘light source’ in spatial order. For a better shadow image, a translucent light diffusion plate is placed before the light source (MME-250, Moritex). For the real-time recording, two high-speed cameras (Phantom v310, Phantom v9.1, Vision Research) with zoom lenses (AF Micro Nikkor 105 mm) are used, each focusing on the bubble and the free surface, respectively. The focused motion of the bubble is recorded using Phantom v310 (100 000 fps, each pixel:
$^{\circ }$
, a single intact bubble is best generated at the spark point. For other touching angles, a mis-spark or unintended sequential bubbles are generated. In the experiment, the vertical position (d) of the spark point below the free surface is varied (0.28–7 mm) and its horizontal position from the wall is fixed at 4 cm, which is confirmed to be far enough for both motions of an underwater bubble and the induced jet-like surface wave not to be influenced from the existence of the wall. For the shadow images of those motions, the adopted overall configuration is ‘camera’, ‘objects (bubble and the free surface above it)’ and ‘light source’ in spatial order. For a better shadow image, a translucent light diffusion plate is placed before the light source (MME-250, Moritex). For the real-time recording, two high-speed cameras (Phantom v310, Phantom v9.1, Vision Research) with zoom lenses (AF Micro Nikkor 105 mm) are used, each focusing on the bubble and the free surface, respectively. The focused motion of the bubble is recorded using Phantom v310 (100 000 fps, each pixel:
 $0.05~\text{mm}\times 0.05~\text{mm}$
or
$0.05~\text{mm}\times 0.05~\text{mm}$
or
 $0.04~\text{mm}\times 0.04~\text{mm}$
) and the focused motion of the free surface is recorded using Phantom v9.1 (10 000 fps, each pixel:
$0.04~\text{mm}\times 0.04~\text{mm}$
) and the focused motion of the free surface is recorded using Phantom v9.1 (10 000 fps, each pixel:
 $0.1~\text{mm}\times 0.1~\text{mm}$
or
$0.1~\text{mm}\times 0.1~\text{mm}$
or
 $0.08~\text{mm}\times 0.08~\text{mm}$
). To summarize in advance (figure 2
c), when
$0.08~\text{mm}\times 0.08~\text{mm}$
). To summarize in advance (figure 2
c), when
 $d/R_{m}>1.3$
, the surface wave shows a simple smooth hump (case 1). When
$d/R_{m}>1.3$
, the surface wave shows a simple smooth hump (case 1). When
 $0.82<d/R_{m}<1.3$
, a single droplet or multiple droplets are pinched off sequentially or simultaneously at the tip or from some points of the jet-like surface wave (case 2). Finally, when
$0.82<d/R_{m}<1.3$
, a single droplet or multiple droplets are pinched off sequentially or simultaneously at the tip or from some points of the jet-like surface wave (case 2). Finally, when
 $d/R_{m}<0.82$
, a series of squirting and jetting phenomena are observed at the top of the jet-like surface wave (case 3). The boundary values 1.3 and 0.82 between each case are taken as the average of two extreme values of
$d/R_{m}<0.82$
, a series of squirting and jetting phenomena are observed at the top of the jet-like surface wave (case 3). The boundary values 1.3 and 0.82 between each case are taken as the average of two extreme values of
 $d/R_{m}$
in the overlap regions of cases 1, 2, and 3. The overlap regions are
$d/R_{m}$
in the overlap regions of cases 1, 2, and 3. The overlap regions are
 $1.25<d/R_{m}<1.35$
(cases 1 and 2) and
$1.25<d/R_{m}<1.35$
(cases 1 and 2) and
 $0.79<d/R_{m}<0.85$
(cases 2 and 3).
$0.79<d/R_{m}<0.85$
(cases 2 and 3).
3 Experimental results
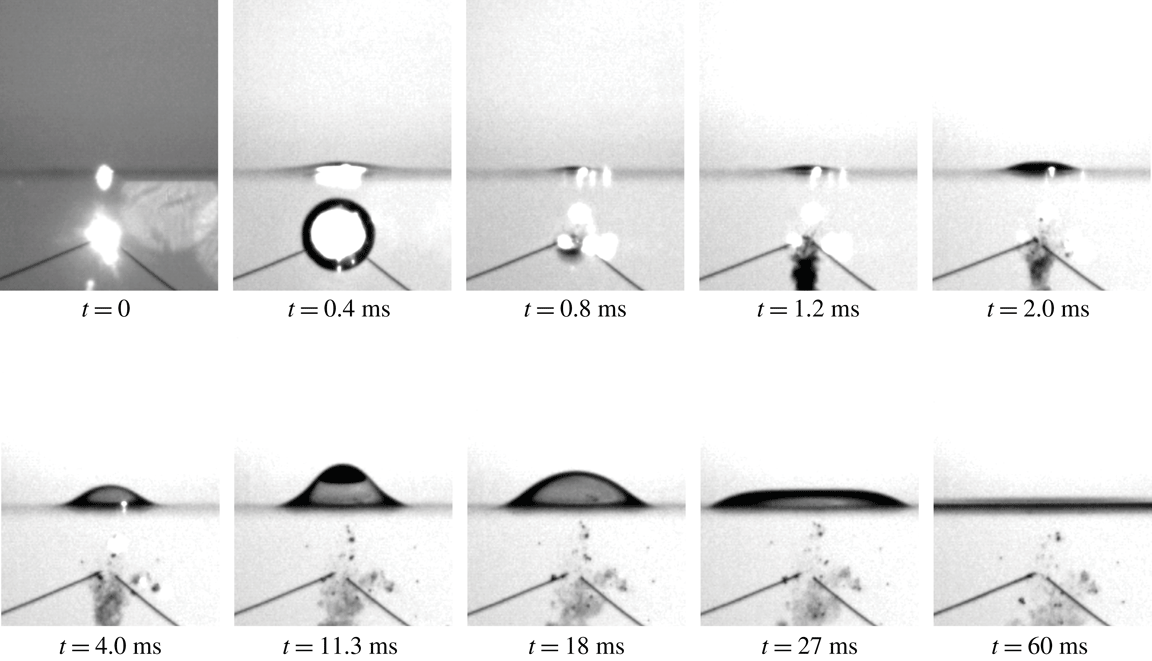
3.1 Case 1
 $(d/R_{m}>1.3)$

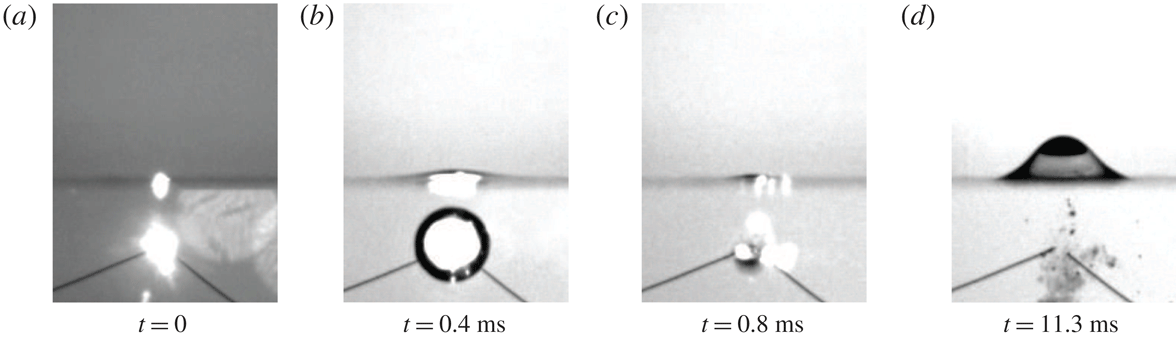
When the spark point (d) is far from the free surface and/or the maximum radius of the bubble (
 $R_{m}$
) is small enough not to touch the free surface, jet-like surface waves featuring a simple smooth hump (maximum height,
$R_{m}$
) is small enough not to touch the free surface, jet-like surface waves featuring a simple smooth hump (maximum height,
 $h$
) are observed. Figure 3 shows a set of snapshots of motions of the bubble and the free surface together when the spark point
$h$
) are observed. Figure 3 shows a set of snapshots of motions of the bubble and the free surface together when the spark point
 $d=4.1~\text{mm}$
at
$d=4.1~\text{mm}$
at
 $t=0~\text{s}$
and
$t=0~\text{s}$
and
 $R_{m}=2.44~\text{mm}$
at
$R_{m}=2.44~\text{mm}$
at
 $t=0.38~\text{ms}$
(
$t=0.38~\text{ms}$
(
 $d/R_{m}=1.68$
and
$d/R_{m}=1.68$
and
 $h/R_{m}=1.23$
). The height of the jet-like surface wave has its maximum
$h/R_{m}=1.23$
). The height of the jet-like surface wave has its maximum
 $h=3~\text{mm}$
at
$h=3~\text{mm}$
at
 $t=11.3~\text{ms}$
. Associated with figure 3, the detailed repeated expansion–collapse motions of the bubble are shown in figure 4; expansion (
$t=11.3~\text{ms}$
. Associated with figure 3, the detailed repeated expansion–collapse motions of the bubble are shown in figure 4; expansion (
 $t=0{-}0.38~\text{ms}$
), collapse (
$t=0{-}0.38~\text{ms}$
), collapse (
 $t=0.38{-}0.78~\text{ms}$
), expansion (
$t=0.38{-}0.78~\text{ms}$
), expansion (
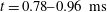 $t=0.78{-}0.96~\text{ms}$
), collapse (
$t=0.78{-}0.96~\text{ms}$
), collapse (
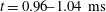 $t=0.96{-}1.04~\text{ms}$
), expansion (
$t=0.96{-}1.04~\text{ms}$
), expansion (
 $t=1.04{-}1.2~\text{ms}$
). During the first expansion phase of the bubble (
$t=1.04{-}1.2~\text{ms}$
). During the first expansion phase of the bubble (
 $t=0{-}0.38~\text{ms}$
), the bubble maintains a spherical shape while expanding and the free surface slightly rises in phase with the expanding motion of the bubble. In the ensuing collapse phase of the bubble (
$t=0{-}0.38~\text{ms}$
), the bubble maintains a spherical shape while expanding and the free surface slightly rises in phase with the expanding motion of the bubble. In the ensuing collapse phase of the bubble (
 $t=0.38{-}0.78~\text{ms}$
), the free surface still shows a rising motion instead of a falling-down motion. Until the end of the first collapse phase, the position of the bubble changes little, and, as a reaction to the rising motion of the free surface, the fluid motion below develops a downward jet (Bjerknes jet) impacting on the top of the bubble (Wang et al.
Reference Wang, Yeo, Khoo and Lam1996a
,Reference Wang, Yeo, Khoo and Lam
b
; Pearson et al.
Reference Pearson, Cox, Blake and Otto2004). As a result, the shape of the bubble becomes a top-flat hemisphere (at
$t=0.38{-}0.78~\text{ms}$
), the free surface still shows a rising motion instead of a falling-down motion. Until the end of the first collapse phase, the position of the bubble changes little, and, as a reaction to the rising motion of the free surface, the fluid motion below develops a downward jet (Bjerknes jet) impacting on the top of the bubble (Wang et al.
Reference Wang, Yeo, Khoo and Lam1996a
,Reference Wang, Yeo, Khoo and Lam
b
; Pearson et al.
Reference Pearson, Cox, Blake and Otto2004). As a result, the shape of the bubble becomes a top-flat hemisphere (at
 $t=0.78~\text{ms}$
); admittedly, since the image is two-dimensional, the downward jet may impact from top to the bottom of the bubble. Then the real shape of the bubble may be top-concave hemispherical. Afterwards, while migrating away from the free surface, still repeatedly expanding and collapsing, the bottom of the bubble also becomes flat, and, finally, the overall shape looks like a spherical frustum. During this event, after
$t=0.78~\text{ms}$
); admittedly, since the image is two-dimensional, the downward jet may impact from top to the bottom of the bubble. Then the real shape of the bubble may be top-concave hemispherical. Afterwards, while migrating away from the free surface, still repeatedly expanding and collapsing, the bottom of the bubble also becomes flat, and, finally, the overall shape looks like a spherical frustum. During this event, after
 $t=0.96~\text{ms}$
in particular, the disintegrated bubbly vestige is left behind the downwardly migrating bubble. Meanwhile, the height of the jet-like surface wave progressively increases with maximum
$t=0.96~\text{ms}$
in particular, the disintegrated bubbly vestige is left behind the downwardly migrating bubble. Meanwhile, the height of the jet-like surface wave progressively increases with maximum
 $h=3~\text{mm}$
at
$h=3~\text{mm}$
at
 $t=11.3~\text{ms}$
, after which the jet-like surface wave falls down while being flattened, featuring a spherical cap (
$t=11.3~\text{ms}$
, after which the jet-like surface wave falls down while being flattened, featuring a spherical cap (
 $t=18~\text{ms}$
), a plateau (
$t=18~\text{ms}$
), a plateau (
 $t=27~\text{ms}$
) and returning to the still water surface (
$t=27~\text{ms}$
) and returning to the still water surface (
 $t=60~\text{ms}$
). The snapshot images of rising and falling motions are not mirror images of each other. The above-mentioned behaviour is observed when
$t=60~\text{ms}$
). The snapshot images of rising and falling motions are not mirror images of each other. The above-mentioned behaviour is observed when
 $d/R_{m}>1.3$
and we refer to this behaviour as case 1. In case 1, we found that the width of the jet-like surface wave (
$d/R_{m}>1.3$
and we refer to this behaviour as case 1. In case 1, we found that the width of the jet-like surface wave (
 $w$
: horizontal width of the surface wave on the free surface in figure 1
d) is linearly proportional to the maximum radius of the bubble (
$w$
: horizontal width of the surface wave on the free surface in figure 1
d) is linearly proportional to the maximum radius of the bubble (
 $R_{m}$
), where the proportional constant is about 3.85 (figure 5). We also found that the rising time of the jet-like surface wave (
$R_{m}$
), where the proportional constant is about 3.85 (figure 5). We also found that the rising time of the jet-like surface wave (
 $t_{r}$
from (c) to (d) in figure 1) is linearly proportional to the quantity
$t_{r}$
from (c) to (d) in figure 1) is linearly proportional to the quantity
 $(h/g)^{1/2}$
, where the proportional constant is about 0.7 (figure 6).
$(h/g)^{1/2}$
, where the proportional constant is about 0.7 (figure 6).

Figure 3. Case 1 (
 $d/R_{m}>1.3$
): snapshots of motions of the bubble and the free surface when
$d/R_{m}>1.3$
): snapshots of motions of the bubble and the free surface when
 $d/R_{m}=1.68$
and
$d/R_{m}=1.68$
and
 $h/R_{m}=1.23$
(
$h/R_{m}=1.23$
(
 $d=4.1~\text{mm}$
at
$d=4.1~\text{mm}$
at
 $t=0~\text{s}$
,
$t=0~\text{s}$
,
 $R_{m}=2.44~\text{mm}$
at
$R_{m}=2.44~\text{mm}$
at
 $t=0.38~\text{ms}$
,
$t=0.38~\text{ms}$
,
 $h=3~\text{mm}$
at
$h=3~\text{mm}$
at
 $t=11.3~\text{ms}$
). The physical dimension of each picture is 20 mm (height) by 15 mm (width).
$t=11.3~\text{ms}$
). The physical dimension of each picture is 20 mm (height) by 15 mm (width).

Figure 4. Case 1 (
 $d/R_{m}>1.3$
): snapshots of detailed motion of the bubble in figure 3. The physical dimension of each picture is 10 mm (height) by 10 mm (width).
$d/R_{m}>1.3$
): snapshots of detailed motion of the bubble in figure 3. The physical dimension of each picture is 10 mm (height) by 10 mm (width).

Figure 5. Proportional relationship between the width of the jet-like surface wave (
 $w$
) and the maximum radius of the bubble (
$w$
) and the maximum radius of the bubble (
 $R_{m}$
) in case 1 (
$R_{m}$
) in case 1 (
 $d/R_{m}>1.3$
).
$d/R_{m}>1.3$
).

Figure 6. Proportional relationship between the rising time of the jet-like surface wave (
 $t_{r}$
) and
$t_{r}$
) and
 $(h/g)^{1/2}$
in case 1 (
$(h/g)^{1/2}$
in case 1 (
 $d/R_{m}>1.3$
).
$d/R_{m}>1.3$
).
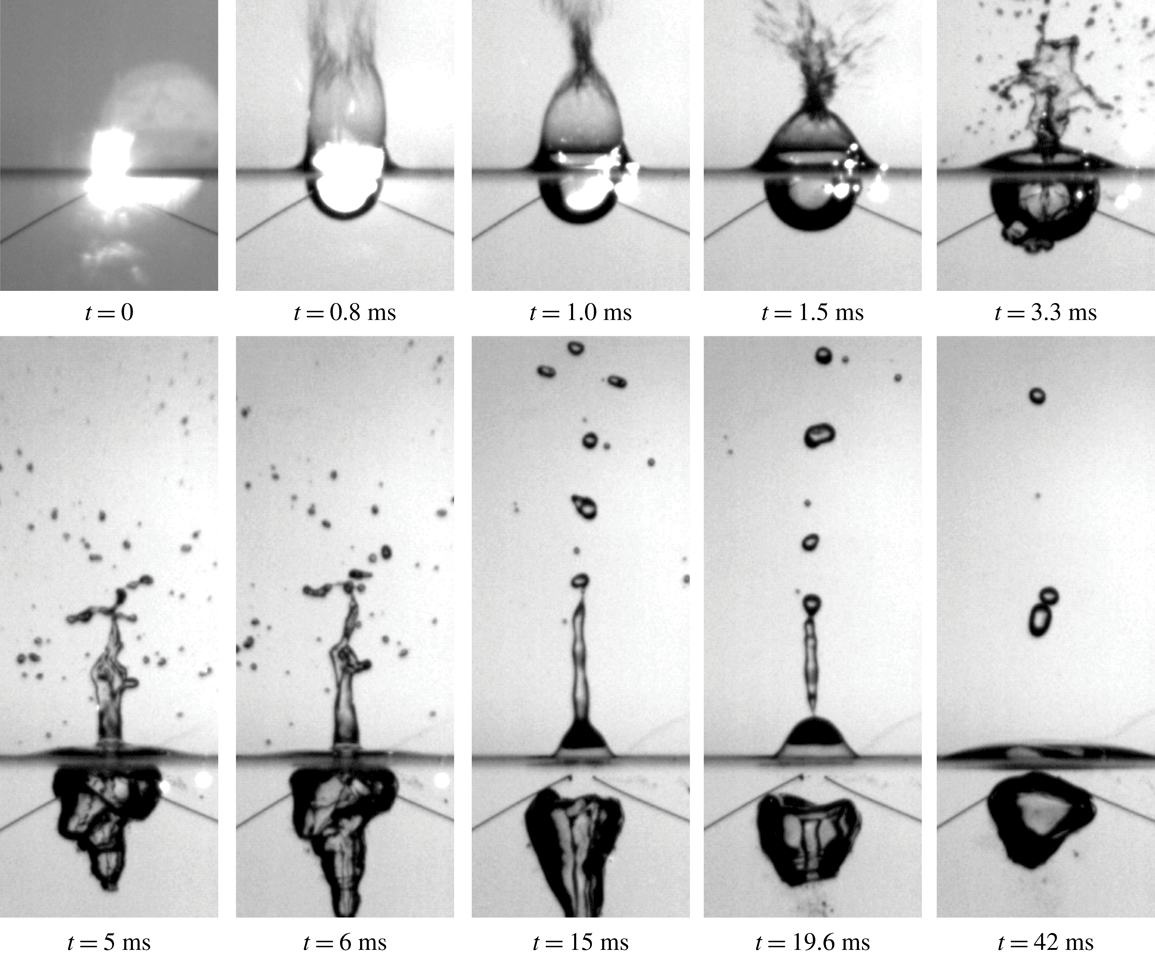
3.2 Case 2
$(0.82<d/R_{m}<1.3)$

Compared to case 1, when the spark point (d) is closer to the free surface and/or the maximum radius of the bubble (
 $R_{m}$
) is bigger, but still small enough not to touch
$R_{m}$
) is bigger, but still small enough not to touch
 $(1<d/R_{m}<1.3)$
or slightly touch
$(1<d/R_{m}<1.3)$
or slightly touch
 $(0.82<d/R_{m}<1)$
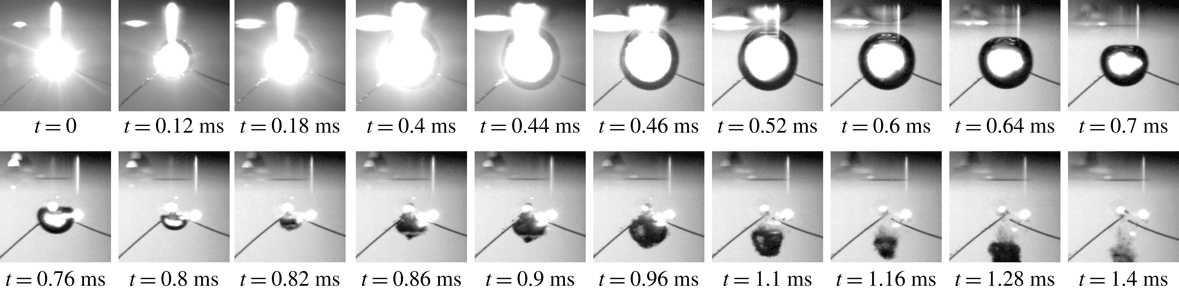
the free surface, jet-like surface waves are observed making a single droplet or multiple droplets pinched off sequentially or simultaneously at the tip or from some points of the surface jet. Figure 7 shows a set of motion snapshots of the bubble and the free surface when the spark point
$(0.82<d/R_{m}<1)$
the free surface, jet-like surface waves are observed making a single droplet or multiple droplets pinched off sequentially or simultaneously at the tip or from some points of the surface jet. Figure 7 shows a set of motion snapshots of the bubble and the free surface when the spark point
 $d=3~\text{mm}$
at
$d=3~\text{mm}$
at
 $t=0~\text{s}$
and
$t=0~\text{s}$
and
 $R_{m}=2.35~\text{mm}$
at
$R_{m}=2.35~\text{mm}$
at
 $t=0.32~\text{ms}$
(
$t=0.32~\text{ms}$
(
 $d/R_{m}=1.28$
and
$d/R_{m}=1.28$
and
 $h/R_{m}=4.55$
). On the verge of pinching off a single droplet, the height of the jet-like surface wave has its maximum
$h/R_{m}=4.55$
). On the verge of pinching off a single droplet, the height of the jet-like surface wave has its maximum
 $h=10.7~\text{mm}$
at
$h=10.7~\text{mm}$
at
 $t=32.5~\text{ms}$
. Associated with figure 7, the detailed motion of the bubble is shown in figure 8. At
$t=32.5~\text{ms}$
. Associated with figure 7, the detailed motion of the bubble is shown in figure 8. At
 $t=0.70~\text{ms}$
, due to the simultaneous development of the jet-like surface wave and the downward underwater jet below it, the top side of the bubble becomes flattened. In this case, due to the bubble’s proximity to the free surface compared to case 1, the strength of the downward underwater jet is strong enough to make a prominent involution of the bubble clearly visible as shown from the snapshots at
$t=0.70~\text{ms}$
, due to the simultaneous development of the jet-like surface wave and the downward underwater jet below it, the top side of the bubble becomes flattened. In this case, due to the bubble’s proximity to the free surface compared to case 1, the strength of the downward underwater jet is strong enough to make a prominent involution of the bubble clearly visible as shown from the snapshots at
 $t=0.70$
,
$t=0.70$
,
 $0.84~\text{ms}$
, i.e. the upper part of the bubble, on which the downward underwater jet makes an impact, pushes down and almost penetrates through the lower part of the bubble. At the final stage of the involution or pushing down (
$0.84~\text{ms}$
, i.e. the upper part of the bubble, on which the downward underwater jet makes an impact, pushes down and almost penetrates through the lower part of the bubble. At the final stage of the involution or pushing down (
 $t=0.84~\text{ms}$
), the bubble’s shape looks like a toroid with an attached overhanging cylinder. Afterwards, during
$t=0.84~\text{ms}$
), the bubble’s shape looks like a toroid with an attached overhanging cylinder. Afterwards, during
 $t=$
0.90–0.94 ms, the bubble’s shape evolves into a figure of eight, maintaining its overall position. At
$t=$
0.90–0.94 ms, the bubble’s shape evolves into a figure of eight, maintaining its overall position. At
 $t=1.00~\text{ms}$
and thereafter, the bubble begins migrating away from the free surface while the upper part of the bubble is being disintegrated into tiny bubbles. Meanwhile, the free-surface jet keeps growing and, at an instance
$t=1.00~\text{ms}$
and thereafter, the bubble begins migrating away from the free surface while the upper part of the bubble is being disintegrated into tiny bubbles. Meanwhile, the free-surface jet keeps growing and, at an instance
 $t=14~\text{ms}$
, the shape looks like the well-known Worthington jet, which is sometimes called a ‘back jet’, as witnessed in the case of a falling droplet impacting on a liquid. After a while, at
$t=14~\text{ms}$
, the shape looks like the well-known Worthington jet, which is sometimes called a ‘back jet’, as witnessed in the case of a falling droplet impacting on a liquid. After a while, at
 $t=32.5~\text{ms}$
, a necking phenomenon happens near the head of the jet and a single droplet is about to be pinched off at the tip of the jet. The droplet diameter is comparable to the diameter of the jet column. Thereafter, the pinched-off droplet falls freely down onto the free surface. Meanwhile, the remaining body of the jet-like surface wave gently collapses and returns to the still water surface. Similar phenomena occur in cases for two, three, and multiple (more than four) droplet generations and are shown in the Appendix. All the above-mentioned behaviours are observed when
$t=32.5~\text{ms}$
, a necking phenomenon happens near the head of the jet and a single droplet is about to be pinched off at the tip of the jet. The droplet diameter is comparable to the diameter of the jet column. Thereafter, the pinched-off droplet falls freely down onto the free surface. Meanwhile, the remaining body of the jet-like surface wave gently collapses and returns to the still water surface. Similar phenomena occur in cases for two, three, and multiple (more than four) droplet generations and are shown in the Appendix. All the above-mentioned behaviours are observed when
 $0.82<d/R_{m}<1.3$
and we refer to this behaviour as case 2. Similar bubble-surface behaviours were also observed for the case of a laser-induced bubble whose maximum radius is of the order of a few hundreds of micrometers with a condition of
$0.82<d/R_{m}<1.3$
and we refer to this behaviour as case 2. Similar bubble-surface behaviours were also observed for the case of a laser-induced bubble whose maximum radius is of the order of a few hundreds of micrometers with a condition of
 $d/R_{m}<1$
(Duocastella et al.
Reference Duocastella, Patrascioiu, Fernández-Pradas, Morenza and Serra2010; Patrascioiu et al.
Reference Patrascioiu, Fernández-Pradas, Palla-Papavlu, Morenza and Serra2014).
$d/R_{m}<1$
(Duocastella et al.
Reference Duocastella, Patrascioiu, Fernández-Pradas, Morenza and Serra2010; Patrascioiu et al.
Reference Patrascioiu, Fernández-Pradas, Palla-Papavlu, Morenza and Serra2014).

Figure 7. Case 2 (
 $0.82<d/R_{m}<1.3$
): snapshots of motions of the bubble and the free surface when
$0.82<d/R_{m}<1.3$
): snapshots of motions of the bubble and the free surface when
 $d/R_{m}=1.28$
and
$d/R_{m}=1.28$
and
 $h/R_{m}=4.55$
(
$h/R_{m}=4.55$
(
 $d=3~\text{mm}$
at
$d=3~\text{mm}$
at
 $t=0~\text{s}$
,
$t=0~\text{s}$
,
 $R_{m}=2.35~\text{mm}$
at
$R_{m}=2.35~\text{mm}$
at
 $t=0.32~\text{ms}$
,
$t=0.32~\text{ms}$
,
 $h=10.7~\text{mm}$
at
$h=10.7~\text{mm}$
at
 $t=32.5~\text{ms}$
). The physical dimension of each picture is 20 mm (height) by 15 mm (width).
$t=32.5~\text{ms}$
). The physical dimension of each picture is 20 mm (height) by 15 mm (width).

Figure 8. Case 2 (
 $0.82<d/R_{m}<1.3$
): snapshots of detailed motion of the bubble in figure 7. The physical dimension of each picture is 10 mm (height) by 10 mm (width).
$0.82<d/R_{m}<1.3$
): snapshots of detailed motion of the bubble in figure 7. The physical dimension of each picture is 10 mm (height) by 10 mm (width).
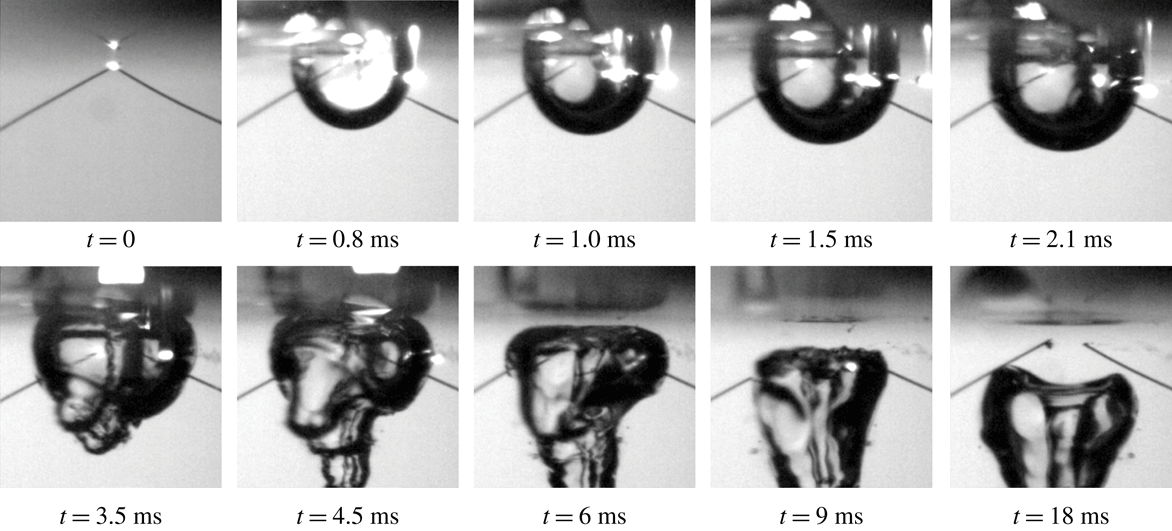
3.3 Case 3
$(d/R_{m}<0.82)$

Compared to cases 1 and 2, when the spark point (d) is very close to the free surface and/or the maximum radius of the bubble (
 $R_{m}$
) is large enough for the growing bubble to touch the free surface, a series of sprinkling/squirting and jetting phenomena are observed on the free surface. Figure 9 shows a set of motion snapshots of the bubble and the free surface when the spark point
$R_{m}$
) is large enough for the growing bubble to touch the free surface, a series of sprinkling/squirting and jetting phenomena are observed on the free surface. Figure 9 shows a set of motion snapshots of the bubble and the free surface when the spark point
 $d=1~\text{mm}$
at
$d=1~\text{mm}$
at
 $t=0~\text{s}$
and
$t=0~\text{s}$
and
 $R_{m}=3.6~\text{mm}$
at
$R_{m}=3.6~\text{mm}$
at
 $t=2.1~\text{ms}$
(
$t=2.1~\text{ms}$
(
 $d/R_{m}=0.28$
). Associated with figure 9, the detailed motion of the bubble is shown in figure 10. During the early stage (
$d/R_{m}=0.28$
). Associated with figure 9, the detailed motion of the bubble is shown in figure 10. During the early stage (
 $t=0{-}0.8~\text{ms}$
), a crater is formed on the free surface, around which a cylindrical rising water sheet can be seen. During the next stage (
$t=0{-}0.8~\text{ms}$
), a crater is formed on the free surface, around which a cylindrical rising water sheet can be seen. During the next stage (
 $t=0.8{-}1.0~\text{ms}$
), the upper rim of the water sheet converges to a point, from which dispersed water begins to be sprinkled. The overall shape looks like a water bell, in which the air (from the bubble) is trying to escape through the sprinkle point. Next (
$t=0.8{-}1.0~\text{ms}$
), the upper rim of the water sheet converges to a point, from which dispersed water begins to be sprinkled. The overall shape looks like a water bell, in which the air (from the bubble) is trying to escape through the sprinkle point. Next (
 $t=1.5{-}5~\text{ms}$
), the overall bell size continuously diminishes as the inside air escapes through the sprinkle point, manifesting as a violent fountain with random scattering motions of tiny water droplets. Afterwards (
$t=1.5{-}5~\text{ms}$
), the overall bell size continuously diminishes as the inside air escapes through the sprinkle point, manifesting as a violent fountain with random scattering motions of tiny water droplets. Afterwards (
 $t=6{-}15~\text{ms}$
), the upper fountain region develops a jet column in the air and the lower water-bell region develops into a hump jet on the free surface. During this event, the jet column shows multiple-droplet generation. The overall jet height and hump height both increase with time. These free-surface jetting phenomena are probably due to the reaction of the developing underwater jet which is evidenced from the evolving shapes of the underwater bubble. From
$t=6{-}15~\text{ms}$
), the upper fountain region develops a jet column in the air and the lower water-bell region develops into a hump jet on the free surface. During this event, the jet column shows multiple-droplet generation. The overall jet height and hump height both increase with time. These free-surface jetting phenomena are probably due to the reaction of the developing underwater jet which is evidenced from the evolving shapes of the underwater bubble. From
 $t=19.6~\text{ms}$
onwards, the free-surface hump falls down and finally returns to the still water surface (after
$t=19.6~\text{ms}$
onwards, the free-surface hump falls down and finally returns to the still water surface (after
 $t=42~\text{ms}$
). Compared to the above case (
$t=42~\text{ms}$
). Compared to the above case (
 $d/R_{m}=0.28$
), rather different squirting and jetting phenomena for the case
$d/R_{m}=0.28$
), rather different squirting and jetting phenomena for the case
 $d/R_{m}=0.67$
are shown in the Appendix. All the above-mentioned behaviours are observed when
$d/R_{m}=0.67$
are shown in the Appendix. All the above-mentioned behaviours are observed when
 $d/R_{m}<0.82$
and we refer to these behaviours as case 3. For readers’ information, similar kinds of phenomena can be found in figure 8 in Pain et al. (Reference Pain, Hui Terence Goh, Klaseboer, Ohl and Khoo2012), where
$d/R_{m}<0.82$
and we refer to these behaviours as case 3. For readers’ information, similar kinds of phenomena can be found in figure 8 in Pain et al. (Reference Pain, Hui Terence Goh, Klaseboer, Ohl and Khoo2012), where
 $R_{m}=3.64~\text{mm}$
and
$R_{m}=3.64~\text{mm}$
and
 $d=1.17~\text{mm}$
, i.e.
$d=1.17~\text{mm}$
, i.e.
 $d/R_{m}=0.32$
.
$d/R_{m}=0.32$
.

Figure 9. Case 3 (
 $d/R_{m}<0.82$
): snapshots of motions of the bubble and the free surface when
$d/R_{m}<0.82$
): snapshots of motions of the bubble and the free surface when
 $d/R_{m}=0.28$
(
$d/R_{m}=0.28$
(
 $d=1~\text{mm}$
at
$d=1~\text{mm}$
at
 $t=0~\text{s}$
,
$t=0~\text{s}$
,
 $R_{m}=3.6~\text{mm}$
at
$R_{m}=3.6~\text{mm}$
at
 $t=2.1~\text{ms}$
). The physical dimension of each picture is 20 mm (height) by 15 mm (width), or 40 mm (height) by 15 mm (width).
$t=2.1~\text{ms}$
). The physical dimension of each picture is 20 mm (height) by 15 mm (width), or 40 mm (height) by 15 mm (width).

Figure 10. Case 3 (
 $d/R_{m}<0.82$
): snapshots of detailed motion of the bubble in figure 9. The physical dimension of each picture is 10 mm (height) by 10 mm (width).
$d/R_{m}<0.82$
): snapshots of detailed motion of the bubble in figure 9. The physical dimension of each picture is 10 mm (height) by 10 mm (width).
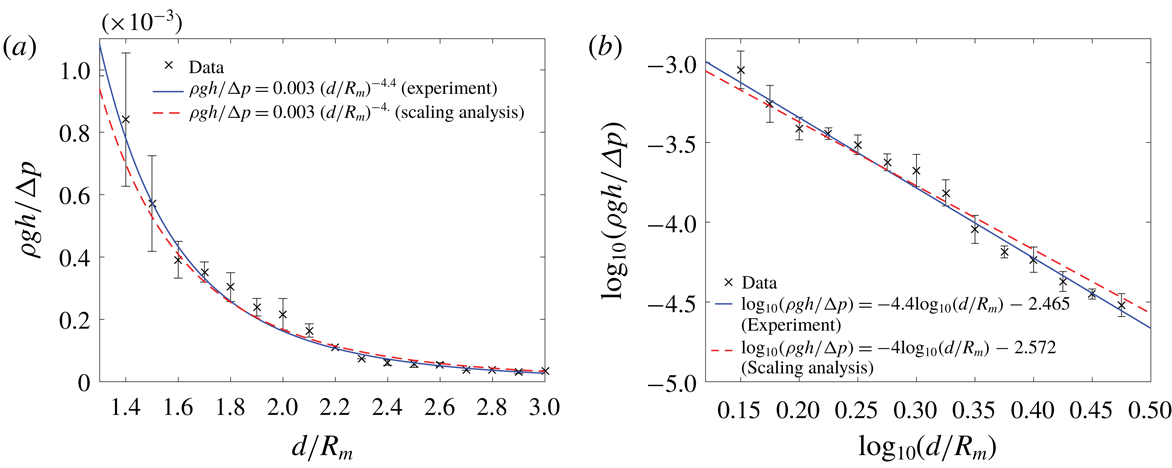
3.4 Relationship between
$\unicode[STIX]{x1D70C}gh/\unicode[STIX]{x0394}p$
and
$d/R_{m}$
in case 1


In addition to the behavioural observations in the previous subsections, for case 1, we present the quantitative relationship between
 $\unicode[STIX]{x1D70C}gh/\unicode[STIX]{x0394}p$
and
$\unicode[STIX]{x1D70C}gh/\unicode[STIX]{x0394}p$
and
 $d/R_{m}$
in (1.1). For given
$d/R_{m}$
in (1.1). For given
 $\unicode[STIX]{x1D70C}$
,
$\unicode[STIX]{x1D70C}$
,
 $g$
and
$g$
and
 $\unicode[STIX]{x0394}p$
, one may intuitively expect that
$\unicode[STIX]{x0394}p$
, one may intuitively expect that
 $h$
increases (decreases) as
$h$
increases (decreases) as
 $d$
decreases (increases). In addition,
$d$
decreases (increases). In addition,
 $h$
increases (decreases) as
$h$
increases (decreases) as
 $R_{m}$
increases (decreases). As a first step towards finding the functional relationship between
$R_{m}$
increases (decreases). As a first step towards finding the functional relationship between
 $\unicode[STIX]{x1D70C}gh/\unicode[STIX]{x0394}p$
and
$\unicode[STIX]{x1D70C}gh/\unicode[STIX]{x0394}p$
and
 $d/R_{m}$
, we need to estimate the value of
$d/R_{m}$
, we need to estimate the value of
 $\unicode[STIX]{x0394}p$
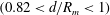
. For this purpose, in terms of the collapse speed of a bubble, the present experimental results and some theoretical results (Rayleigh Reference Rayleigh1917; Plesset & Chapman Reference Plesset and Chapman1971; Lamb Reference Lamb1993) are compared with each other (figure 11). In figure 11, based on snapshots, the instantaneous collapse speed of the bubble (
$\unicode[STIX]{x0394}p$
. For this purpose, in terms of the collapse speed of a bubble, the present experimental results and some theoretical results (Rayleigh Reference Rayleigh1917; Plesset & Chapman Reference Plesset and Chapman1971; Lamb Reference Lamb1993) are compared with each other (figure 11). In figure 11, based on snapshots, the instantaneous collapse speed of the bubble (
 $V$
) is measured as
$V$
) is measured as
 $$\begin{eqnarray}V(t)=\frac{R(t)-R(t+\unicode[STIX]{x0394}t)}{\unicode[STIX]{x0394}t},\end{eqnarray}$$
where
 $R(t)$
is the instantaneous radius of the bubble. The shape of a bubble is a spheroid (major radius,
$R(t)$
is the instantaneous radius of the bubble. The shape of a bubble is a spheroid (major radius,
 $R_{major}(t)$
; minor radius,
$R_{major}(t)$
; minor radius,
 $R_{minor}(t)$
) and
$R_{minor}(t)$
) and
 $R(t)$
is defined as the average of the two. On the other hand, the theoretical speed in an unbounded fluid is given by the formula (Rayleigh Reference Rayleigh1917; Plesset & Chapman Reference Plesset and Chapman1971)
$R(t)$
is defined as the average of the two. On the other hand, the theoretical speed in an unbounded fluid is given by the formula (Rayleigh Reference Rayleigh1917; Plesset & Chapman Reference Plesset and Chapman1971)
 $$\begin{eqnarray}V(t)=\sqrt{\frac{2}{3}\frac{\unicode[STIX]{x0394}p}{\unicode[STIX]{x1D70C}}\left(\frac{R_{m}^{3}}{R^{3}}-1\right)+\frac{2\unicode[STIX]{x1D70E}}{\unicode[STIX]{x1D70C}R}\left(\frac{R_{m}^{2}}{R^{2}}-1\right)}.\end{eqnarray}$$
It is found that for
 $\unicode[STIX]{x0394}p=p_{\infty }-p_{v}=80~\text{kPa}$
, the surface-tension-related term in (3.2) is negligible and (3.1) and (3.2) show reasonable agreement with each other, as seen in figure 11. Using this
$\unicode[STIX]{x0394}p=p_{\infty }-p_{v}=80~\text{kPa}$
, the surface-tension-related term in (3.2) is negligible and (3.1) and (3.2) show reasonable agreement with each other, as seen in figure 11. Using this
 $\unicode[STIX]{x0394}p=80~\text{kPa}$
, for case 1, a proportional relationship is found as shown in figures 12(a) and 12(b):
$\unicode[STIX]{x0394}p=80~\text{kPa}$
, for case 1, a proportional relationship is found as shown in figures 12(a) and 12(b):
 $$\begin{eqnarray}\frac{\unicode[STIX]{x1D70C}gh}{\unicode[STIX]{x0394}p}\sim \left(\frac{d}{R_{m}}\right)^{-4.4}.\end{eqnarray}$$
The straight line with a slope of
 $-4.4$
is the linear regression line of the experimental data with a minimum root-mean-squared error of 0.08 (figure 12
b). The dashed straight line with a slope of
$-4.4$
is the linear regression line of the experimental data with a minimum root-mean-squared error of 0.08 (figure 12
b). The dashed straight line with a slope of
 $-4$
is the line from the scaling analysis (§ 4), with a minimum root-mean-squared error of 0.07. We add this theoretical line to compare how different those two lines are. Dimensionally speaking,
$-4$
is the line from the scaling analysis (§ 4), with a minimum root-mean-squared error of 0.07. We add this theoretical line to compare how different those two lines are. Dimensionally speaking,
 $$\begin{eqnarray}h\sim \frac{R_{m}^{4.4}}{\unicode[STIX]{x1D70C}gd^{4.4}}\unicode[STIX]{x0394}p,\end{eqnarray}$$
which agrees with one’s intuition.


Figure 12. Relationship between
 $\unicode[STIX]{x1D70C}gh/\unicode[STIX]{x0394}p$
and
$\unicode[STIX]{x1D70C}gh/\unicode[STIX]{x0394}p$
and
 $d/R_{m}$
for case 1. (a) Natural scale. (b) Logarithmic scale.
$d/R_{m}$
for case 1. (a) Natural scale. (b) Logarithmic scale.

Figure 13. Schematics for the simplified motion of a 3-D axisymmetric jet-like surface wave induced by the motion of an underwater bubble for case 1. (a) Inception of a bubble. (b) Bubble expansion. (c) Growth of the 3-D axisymmetric jet-like surface wave during the bubble collapse. (d) 3-D axisymmetric jet-like surface wave at its maximum height after the bubble collapse.

Figure 14. Experimental snapshots corresponding to figure 13 for case 1 (from figure 3). Each snapshot (from left to right) represents the inception of a bubble (figure 13 a), bubble expansion (figure 13 b), the growth of the 3-D axisymmetric jet-like surface wave (figure 13 c) during the bubble collapse, and the 3-D axisymmetric jet-like surface wave at its maximum height (figure 13 d).
4 Scaling analysis
To understand the proportional relationship (3.3) or (3.4), let us consider the schematics in figure 13, showing the simplified motion of a 3-D axisymmetric jet-like surface wave induced by the motion of an underwater bubble for case 1. Initially, the inception of the bubble occurs at a point whose distance is
 $d$
below the free surface (figure 13
a). Next, the bubble slightly expands with its maximum radius
$d$
below the free surface (figure 13
a). Next, the bubble slightly expands with its maximum radius
 $R_{m}$
. The free surface above the bubble rises in response to the bubble’s motion (figure 13
b). Next, the bubble collapses while migrating away from the free surface. During this event, the 3-D axisymmetric jet-like surface wave grows with an initial upward velocity
$R_{m}$
. The free surface above the bubble rises in response to the bubble’s motion (figure 13
b). Next, the bubble collapses while migrating away from the free surface. During this event, the 3-D axisymmetric jet-like surface wave grows with an initial upward velocity
 $U$
and the corresponding downward counter-jet in the fluid makes an impact on the bubble (figure 13
c). Finally, the 3-D axisymmetric jet-like surface wave reaches its maximum height (
$U$
and the corresponding downward counter-jet in the fluid makes an impact on the bubble (figure 13
c). Finally, the 3-D axisymmetric jet-like surface wave reaches its maximum height (
 $h$
) before the pinch-off of droplets, if any (figure 13
d). Snapshots corresponding to figure 13 for case 1 are shown in figure 14. These snapshots come from figure 3. The concurrent motions of the jet-like surface wave and the underwater bubble with opposite moving directions (and the downward counter-jet in water) can be explained using the conservation of momentum or the action–reaction principle. To begin with, let us consider the exemplary snapshots of case 1 (figures 3, 4, and 14). The characteristic speed during the expansion is
$h$
) before the pinch-off of droplets, if any (figure 13
d). Snapshots corresponding to figure 13 for case 1 are shown in figure 14. These snapshots come from figure 3. The concurrent motions of the jet-like surface wave and the underwater bubble with opposite moving directions (and the downward counter-jet in water) can be explained using the conservation of momentum or the action–reaction principle. To begin with, let us consider the exemplary snapshots of case 1 (figures 3, 4, and 14). The characteristic speed during the expansion is
 $V=R_{m}/\unicode[STIX]{x0394}t=2.44~\text{mm}/0.38~\text{ms}=6.42~\text{m}~\text{s}^{-1}$
(figure 4). Then the relevant Reynolds number based on the mean radius (
$V=R_{m}/\unicode[STIX]{x0394}t=2.44~\text{mm}/0.38~\text{ms}=6.42~\text{m}~\text{s}^{-1}$
(figure 4). Then the relevant Reynolds number based on the mean radius (
 $L=R_{m}/2$
) of the bubble during the expansion is
$L=R_{m}/2$
) of the bubble during the expansion is
 $$\begin{eqnarray}Re=\frac{VL}{\unicode[STIX]{x1D708}}=\frac{6.42\cdot (2.44\times 10^{-3}/2)}{10^{-6}}=7832\gg 1,\end{eqnarray}$$
where
 $\unicode[STIX]{x1D708}=10^{-6}~\text{m}^{2}~\text{s}^{-1}$
is the kinematic viscosity of water. From figure 3, during the bubble collapse, since the collapse time (0.78 ms
$\unicode[STIX]{x1D708}=10^{-6}~\text{m}^{2}~\text{s}^{-1}$
is the kinematic viscosity of water. From figure 3, during the bubble collapse, since the collapse time (0.78 ms
 $-$
0.38 ms
$-$
0.38 ms
 $=0.40~\text{ms}$
) is similar to the expansion time, the relevant Reynolds number is also similar to (4.1). Since the medium is water (incompressible) and
$=0.40~\text{ms}$
) is similar to the expansion time, the relevant Reynolds number is also similar to (4.1). Since the medium is water (incompressible) and
 $Re\gg 1$
(inviscid), one may model this flow as irrotational, or a potential flow. During the expansion phase of the bubble, the bubble does not move (no downward force) and the free surface above rises only slightly, with its maximum elevation (
$Re\gg 1$
(inviscid), one may model this flow as irrotational, or a potential flow. During the expansion phase of the bubble, the bubble does not move (no downward force) and the free surface above rises only slightly, with its maximum elevation (
 $h_{r}$
) being much less than the distance between the inception point and the still free surface (d), i.e.
$h_{r}$
) being much less than the distance between the inception point and the still free surface (d), i.e.
 $h_{r}/d\ll 1$
. The concurrent motions of the bubble and the free surface during the bubble’s expansion (figures 13
a and 13
b) are of little concern. Rather, the main interest here is the rising jet-like surface wave which is observed while and after the bubble collapses and migrates downwards (figures 13
c and 13
d). The rising jet-like wave is observed on a local circular region of the free surface which is just above the collapsing bubble, and the rest of the free surface shows a negligible motion (figure 14). Apart from the rising jet-like surface wave, the downward motion of the bubble (and the downward counter-jet in water) can be explained by the Kelvin impulse theory of a potential flow (Blake & Cerone Reference Blake and Cerone1982; Cerone & Blake Reference Cerone and Blake1984; Blake & Gibson Reference Blake and Gibson1987; Blake, Leppinen & Wang Reference Blake, Leppinen and Wang2015). During the collapse phase of the bubble, one possible configuration of the potential flow is the combination of a 3-D collapsing sink (bubble) and an imaginary 3-D source with the same intensity
$h_{r}/d\ll 1$
. The concurrent motions of the bubble and the free surface during the bubble’s expansion (figures 13
a and 13
b) are of little concern. Rather, the main interest here is the rising jet-like surface wave which is observed while and after the bubble collapses and migrates downwards (figures 13
c and 13
d). The rising jet-like wave is observed on a local circular region of the free surface which is just above the collapsing bubble, and the rest of the free surface shows a negligible motion (figure 14). Apart from the rising jet-like surface wave, the downward motion of the bubble (and the downward counter-jet in water) can be explained by the Kelvin impulse theory of a potential flow (Blake & Cerone Reference Blake and Cerone1982; Cerone & Blake Reference Cerone and Blake1984; Blake & Gibson Reference Blake and Gibson1987; Blake, Leppinen & Wang Reference Blake, Leppinen and Wang2015). During the collapse phase of the bubble, one possible configuration of the potential flow is the combination of a 3-D collapsing sink (bubble) and an imaginary 3-D source with the same intensity
 $|q(t)|$
(unit: volume flow rate,
$|q(t)|$
(unit: volume flow rate,
 $q(t)<0$
) separated by a distance
$q(t)<0$
) separated by a distance
 $2d$
. Between the sink and the source, there exists a free surface. Following Blake & Cerone (Reference Blake and Cerone1982), the relevant velocity potential
$2d$
. Between the sink and the source, there exists a free surface. Following Blake & Cerone (Reference Blake and Cerone1982), the relevant velocity potential
 $\unicode[STIX]{x1D711}$
can be written as
$\unicode[STIX]{x1D711}$
can be written as
 $$\begin{eqnarray}\unicode[STIX]{x1D711}=-\frac{q(t)}{4\unicode[STIX]{x03C0}}\left[\frac{1}{\sqrt{(z+d)^{2}+r^{2}}}-\frac{1}{\sqrt{(z-d)^{2}+r^{2}}}\right],\quad r=\sqrt{x^{2}+y^{2}},\end{eqnarray}$$
where
 $q(t)<0$
,
$q(t)<0$
,
 $x$
and
$x$
and
 $y$
are horizontal Cartesian coordinates on the free-surface plane,
$y$
are horizontal Cartesian coordinates on the free-surface plane,
 $z$
is the vertical coordinate (positive upward from the free surface) and
$z$
is the vertical coordinate (positive upward from the free surface) and
 $r$
is the horizontal cylindrical coordinate (figure 13). From (4.2), the velocity components on the free surface (
$r$
is the horizontal cylindrical coordinate (figure 13). From (4.2), the velocity components on the free surface (
 $z=0$
) are found to be
$z=0$
) are found to be
 $$\begin{eqnarray}u_{z}|_{z=0}=\left.\frac{\unicode[STIX]{x2202}\unicode[STIX]{x1D711}}{\unicode[STIX]{x2202}z}\right|_{z=0}=\frac{q(t)d}{2\unicode[STIX]{x03C0}(d^{2}+r^{2})^{3/2}}<0,\quad u_{r}|_{z=0}=\left.\frac{\unicode[STIX]{x2202}\unicode[STIX]{x1D711}}{\unicode[STIX]{x2202}r}\right|_{z=0}=0.\end{eqnarray}$$
Then the downward force
 $F_{z}$
exerted on the bubble can be obtained from the Kelvin impulse theory (Blake & Cerone Reference Blake and Cerone1982):
$F_{z}$
exerted on the bubble can be obtained from the Kelvin impulse theory (Blake & Cerone Reference Blake and Cerone1982):
 $$\begin{eqnarray}F_{z}=-\boldsymbol{e}_{z}\boldsymbol{\cdot }\unicode[STIX]{x1D70C}\int _{S_{f}}\left[\frac{1}{2}|\unicode[STIX]{x1D735}\unicode[STIX]{x1D711}|^{2}\boldsymbol{n}-\frac{\unicode[STIX]{x2202}\unicode[STIX]{x1D711}}{\unicode[STIX]{x2202}n}\unicode[STIX]{x1D735}\unicode[STIX]{x1D711}\right]\,\text{d}S,\end{eqnarray}$$
where
 $\boldsymbol{e}_{z}$
is the unit normal vector in the
$\boldsymbol{e}_{z}$
is the unit normal vector in the
 $z$
direction,
$z$
direction,
 $\boldsymbol{n}$
is the unit outward normal vector on the free surface (
$\boldsymbol{n}$
is the unit outward normal vector on the free surface (
 $\boldsymbol{n}=\boldsymbol{e}_{z}$
),
$\boldsymbol{n}=\boldsymbol{e}_{z}$
),
 $S_{f}$
represents the free surface and
$S_{f}$
represents the free surface and
 $\unicode[STIX]{x1D70C}$
is the density of the liquid surrounding the bubble. By substituting (4.3) into (4.4),
$\unicode[STIX]{x1D70C}$
is the density of the liquid surrounding the bubble. By substituting (4.3) into (4.4),
 $$\begin{eqnarray}F_{z}=\unicode[STIX]{x1D70C}\unicode[STIX]{x03C0}\int _{r=0}^{\infty }r(u_{r}^{2}-u_{z}^{2})\,\text{d}r=-\frac{\unicode[STIX]{x1D70C}q^{2}(t)}{16\unicode[STIX]{x03C0}d^{2}}<0\quad (\text{downward}).\end{eqnarray}$$
Then, the associated momentum of the bubble can be obtained as
 $$\begin{eqnarray}M_{bubble}=\int _{0}^{t_{c}}F_{z}\,\text{d}t=-\frac{\unicode[STIX]{x1D70C}}{16\unicode[STIX]{x03C0}d^{2}}\int _{0}^{t_{c}}q^{2}(t^{\prime })\,\text{d}t^{\prime }<0\quad (\text{downward}),\end{eqnarray}$$
where
 $t_{c}$
is the time during the collapse of the bubble while the jet-like free surface rises. As already mentioned, the expansion time (
$t_{c}$
is the time during the collapse of the bubble while the jet-like free surface rises. As already mentioned, the expansion time (
 $t_{e}$
) and the collapse time (
$t_{e}$
) and the collapse time (
 $t_{c}$
) are comparable to each other:
$t_{c}$
) are comparable to each other:
 $$\begin{eqnarray}t_{c}\sim R_{m}\sqrt{\frac{\unicode[STIX]{x1D70C}}{\unicode[STIX]{x0394}p}},\end{eqnarray}$$
where (4.7) comes from the well-known Rayleigh–Plesset equation neglecting the surface tension in an unbounded fluid and is also valid in the present free-surface-bounded experiment (see § 3.4). The order of magnitude of the intensity
 $q(t)$
is
$q(t)$
is
 $$\begin{eqnarray}q\sim \frac{R_{m}^{3}}{t_{c}}.\end{eqnarray}$$
Then, from (4.6)–(4.8), the order of magnitude of the downward momentum of the bubble is
 $$\begin{eqnarray}M_{bubble}\sim \frac{\unicode[STIX]{x1D70C}}{d^{2}}q^{2}t_{c}\sim \frac{\unicode[STIX]{x1D70C}}{d^{2}}\frac{R_{m}^{6}}{t_{c}^{2}}t_{c}\sim \frac{\unicode[STIX]{x1D70C}}{d^{2}}\frac{R_{m}^{6}}{R_{m}\unicode[STIX]{x1D70C}^{1/2}}(\unicode[STIX]{x0394}p)^{1/2}\sim \frac{\unicode[STIX]{x1D70C}^{1/2}}{d^{2}}R_{m}^{5}(\unicode[STIX]{x0394}p)^{1/2}.\end{eqnarray}$$
On the other hand, the upward momentum of the surface jet is estimated as follows. At the end of the bubble’s expansion, the shape of the free surface above is a simple hump (figures 13
b and 14
b). During the collapse of the bubble, the height of this hump-like free surface increases and shows a jet-like surface wave (figures 13
c and 14
c), before reaching its maximum height (figures 13
d and 14
d). According to numerical work by Cerone & Blake (Reference Cerone and Blake1984), at each instant of the growth of the surface jet, there exists a stagnation point which is located at about a middle point between the top of the surface jet and the still water level. Only above the stagnation point does the streamline represent an upward motion, i.e. the growth of the surface jet. By adopting their numerical findings, we assume that the effective mass (
 $m_{jet}$
) with an upward motion is the mass of the surface jet above the half-line at its maximum height (figures 13
d and 14
d). We also assume that this effective mass has an initial rising speed
$m_{jet}$
) with an upward motion is the mass of the surface jet above the half-line at its maximum height (figures 13
d and 14
d). We also assume that this effective mass has an initial rising speed
 $U$
. Therefore, the upward momentum of the surface jet is approximately
$U$
. Therefore, the upward momentum of the surface jet is approximately
 $$\begin{eqnarray}M_{jet}\sim m_{jet}U=\unicode[STIX]{x1D70C}(\text{Vol}_{jet})U,\end{eqnarray}$$
where
 $\text{Vol}_{jet}$
is the volume of the effective mass (
$\text{Vol}_{jet}$
is the volume of the effective mass (
 $m_{jet}$
). Figure 15 shows the measurement of
$m_{jet}$
). Figure 15 shows the measurement of
 $\text{Vol}_{jet}$
in terms of
$\text{Vol}_{jet}$
in terms of
 $R_{m}$
for different inception positions (d). As shown, the relationship is approximately
$R_{m}$
for different inception positions (d). As shown, the relationship is approximately
 $$\begin{eqnarray}\text{Vol}_{jet}\sim R_{m}^{3}.\end{eqnarray}$$
The above relationship can also be semi-qualitatively explained by considering the counter-jet migrating away from the free surface towards the bubble. While the counter-jet penetrates through the bubble, the surface jet continues to move upwards, reaching a height at the instance of the counter-jet impact equal to
 $R_{m}$
(Robinson et al.
Reference Robinson, Blake, Kodama, Shima and Tomita2001). Since the width of the surface jet is proportional to
$R_{m}$
(Robinson et al.
Reference Robinson, Blake, Kodama, Shima and Tomita2001). Since the width of the surface jet is proportional to
 $R_{m}$
(§ 3.1), the volume of the effective mass will be proportional to the cube of
$R_{m}$
(§ 3.1), the volume of the effective mass will be proportional to the cube of
 $R_{m}$
.
$R_{m}$
.
Also, an approximation of the initial rising speed of the jet
 $U$
can be obtained from the conservation of kinetic and potential energies as
$U$
can be obtained from the conservation of kinetic and potential energies as
 $$\begin{eqnarray}U\sim (gh)^{1/2}.\end{eqnarray}$$
Therefore, from (4.10)–(4.12),
 $$\begin{eqnarray}M_{jet}\sim m_{jet}U\sim (\unicode[STIX]{x1D70C}R_{m}^{3})(gh)^{1/2}\sim \unicode[STIX]{x1D70C}R_{m}^{3}g^{0.5}h^{0.5}.\end{eqnarray}$$
From the conservation of momentum principle, the surface jet will have the same magnitude of momentum
 $M_{jet}$
in (4.13) as
$M_{jet}$
in (4.13) as
 $M_{bubble}$
in (4.9):
$M_{bubble}$
in (4.9):
 $$\begin{eqnarray}\frac{\unicode[STIX]{x1D70C}^{1/2}}{d^{2}}R_{m}^{5}(\unicode[STIX]{x0394}p)^{1/2}\sim \unicode[STIX]{x1D70C}R_{m}^{3}g^{0.5}h^{0.5}.\end{eqnarray}$$
Rearranging (4.14),
 $$\begin{eqnarray}\frac{\unicode[STIX]{x1D70C}gh}{\unicode[STIX]{x0394}p}\sim \left(\frac{d}{R_{m}}\right)^{-4},\end{eqnarray}$$
which is very close to (3.3) observed in the experiment. Although a definitive relationship like (4.15) is not given, the evolution of the height of the surface jet is numerically investigated based on the boundary integral method with consideration of the Kelvin impulse theory by Robinson et al. (Reference Robinson, Blake, Kodama, Shima and Tomita2001) and Pearson et al. (Reference Pearson, Cox, Blake and Otto2004). Although streamlines are not shown, high-pressure regions are numerically observed between the free surface and the bubble during the bubble collapse, making the surface jet. In these works, however, for the parameter
 $d/R_{m}<1.3$
, no droplet generation is shown (they neglect both the viscosity and the surface tension), whereas droplet generations are observed for our present case 2 where
$d/R_{m}<1.3$
, no droplet generation is shown (they neglect both the viscosity and the surface tension), whereas droplet generations are observed for our present case 2 where
 $0.82<d/R_{m}<1.3$
.
$0.82<d/R_{m}<1.3$
.

Figure 15. The volume of the effective mass of the surface jet (
 $\text{Vol}_{jet}$
) according to
$\text{Vol}_{jet}$
) according to
 $R_{m}$
. (a) Dimensional. (b) Dimensionless.
$R_{m}$
. (a) Dimensional. (b) Dimensionless.
5 Cauchy–Poisson problem
Although the gravity and the surface tension can be neglected in terms of the bubble dynamics, they may not be neglected in the motion of a jet-like surface wave after a bubble collapses and migrates far away from the surface. Recall that, in the experiment, the height of the jet-like surface wave is of the order of a few millimetres, where both the gravity and the surface tension are potentially equally important. To see whether the resultant 3-D axisymmetric jet-like surface wave is a gravity, gravity–capillary or capillary wave, we consider the so-called Cauchy–Poisson problem, where the governing equation in terms of the velocity potential, the associated linearized boundary conditions at the free surface (including both gravity and surface tension), the deep-water bottom boundary condition and the initial conditions are as follows:
 $$\begin{eqnarray}\displaystyle & \displaystyle \unicode[STIX]{x1D6FB}^{2}\unicode[STIX]{x1D711}=\frac{\unicode[STIX]{x2202}^{2}\unicode[STIX]{x1D711}}{\unicode[STIX]{x2202}r^{2}}+\frac{1}{r}\frac{\unicode[STIX]{x2202}\unicode[STIX]{x1D711}}{\unicode[STIX]{x2202}r}+\frac{\unicode[STIX]{x2202}^{2}\unicode[STIX]{x1D711}}{\unicode[STIX]{x2202}z^{2}}=0,\quad 0<r<\infty ,~-h\leqslant z\leqslant 0,~t>0, & \displaystyle\end{eqnarray}$$
 $$\begin{eqnarray}\displaystyle & \displaystyle \frac{\unicode[STIX]{x2202}\unicode[STIX]{x1D702}}{\unicode[STIX]{x2202}t}-\frac{\unicode[STIX]{x2202}\unicode[STIX]{x1D711}}{\unicode[STIX]{x2202}z}=0\quad \text{at }z=0,~t>0, & \displaystyle\end{eqnarray}$$
 $$\begin{eqnarray}\displaystyle & \displaystyle \frac{\unicode[STIX]{x2202}\unicode[STIX]{x1D711}}{\unicode[STIX]{x2202}t}+g\unicode[STIX]{x1D702}-\frac{\unicode[STIX]{x1D70E}}{\unicode[STIX]{x1D70C}}\left(\frac{\unicode[STIX]{x2202}^{2}\unicode[STIX]{x1D702}}{\unicode[STIX]{x2202}r^{2}}+\frac{1}{r}\frac{\unicode[STIX]{x2202}\unicode[STIX]{x1D702}}{\unicode[STIX]{x2202}r}\right)=0\quad \text{at }z=0,~t>0, & \displaystyle\end{eqnarray}$$
 $$\begin{eqnarray}\displaystyle & \displaystyle \frac{\unicode[STIX]{x2202}\unicode[STIX]{x1D711}}{\unicode[STIX]{x2202}z}=0\quad \text{at }z=-h,~h\rightarrow \infty , & \displaystyle\end{eqnarray}$$
 $$\begin{eqnarray}\displaystyle & \displaystyle \unicode[STIX]{x1D702}(r,t=0)=\unicode[STIX]{x1D702}_{0}(r), & \displaystyle\end{eqnarray}$$
 $$\begin{eqnarray}\displaystyle & \displaystyle \unicode[STIX]{x1D711}(r,z,t=0)=\unicode[STIX]{x1D711}_{0}(r,z)=0, & \displaystyle\end{eqnarray}$$
where
 $\unicode[STIX]{x1D702}(r,t)$
is the wave elevation. The present theoretical Cauchy–Poisson problem is the one in the unbounded fluid domain both in the horizontal (
$\unicode[STIX]{x1D702}(r,t)$
is the wave elevation. The present theoretical Cauchy–Poisson problem is the one in the unbounded fluid domain both in the horizontal (
 $0<r<\infty$
, (5.1)) and in the vertical (
$0<r<\infty$
, (5.1)) and in the vertical (
 $-h\leqslant z\leqslant 0$
,
$-h\leqslant z\leqslant 0$
,
 $h\rightarrow \infty$
, (5.4)) directions. These conditions are consistent with experimental conditions where the water depth (from the free surface to the bottom wall) is 16 cm and the widths of the tank side walls are 20 cm, which are much larger than the wavelengths of the resulting gravity–capillary waves (of the order of a few millimetres) whose positions are near the centre of the free surface. If one takes the joint Hankel–Laplace transform on (5.1)–(5.6), the following equations hold:
$h\rightarrow \infty$
, (5.4)) directions. These conditions are consistent with experimental conditions where the water depth (from the free surface to the bottom wall) is 16 cm and the widths of the tank side walls are 20 cm, which are much larger than the wavelengths of the resulting gravity–capillary waves (of the order of a few millimetres) whose positions are near the centre of the free surface. If one takes the joint Hankel–Laplace transform on (5.1)–(5.6), the following equations hold:
 $$\begin{eqnarray}\displaystyle & \displaystyle -k^{2}\widetilde{\overline{\unicode[STIX]{x1D711}}}+\frac{\text{d}^{2}\widetilde{\overline{\unicode[STIX]{x1D702}}}}{\text{d}z^{2}}=0,\quad 0<r<\infty ,~-h\leqslant z\leqslant 0,~t>0, & \displaystyle\end{eqnarray}$$
 $$\begin{eqnarray}\displaystyle & \displaystyle s\widetilde{\overline{\unicode[STIX]{x1D702}}}-\widetilde{\unicode[STIX]{x1D702}}_{0}(k)-\frac{\text{d}\widetilde{\overline{\unicode[STIX]{x1D711}}}}{\text{d}z}=0\quad \text{at }z=0,~t>0, & \displaystyle\end{eqnarray}$$
 $$\begin{eqnarray}\displaystyle & \displaystyle s\widetilde{\overline{\unicode[STIX]{x1D711}}}+g\widetilde{\overline{\unicode[STIX]{x1D702}}}+\frac{\unicode[STIX]{x1D70E}}{\unicode[STIX]{x1D70C}}k^{2}\widetilde{\overline{\unicode[STIX]{x1D702}}}=0\quad \text{at }z=0,~t>0, & \displaystyle\end{eqnarray}$$
 $$\begin{eqnarray}\displaystyle & \displaystyle \frac{\text{d}\widetilde{\overline{\unicode[STIX]{x1D711}}}}{\text{d}z}=0\quad \text{at }z=-h,~h\rightarrow \infty , & \displaystyle\end{eqnarray}$$
where the joint Hankel–Laplace transform on
 $\unicode[STIX]{x1D711}$
and
$\unicode[STIX]{x1D711}$
and
 $\unicode[STIX]{x1D702}$
and the Laplace transform on
$\unicode[STIX]{x1D702}$
and the Laplace transform on
 $\unicode[STIX]{x1D702}_{0}$
are defined as follows:
$\unicode[STIX]{x1D702}_{0}$
are defined as follows:
 $$\begin{eqnarray}\overline{\widetilde{\unicode[STIX]{x1D702}}}=L\{\widetilde{\unicode[STIX]{x1D702}}\}=\int _{0}^{\infty }\widetilde{\unicode[STIX]{x1D702}}\text{e}^{-st}\,\text{d}t,\quad \widetilde{\unicode[STIX]{x1D702}}=H\{\unicode[STIX]{x1D702}\}=\int _{0}^{\infty }\unicode[STIX]{x1D702}r\text{J}_{0}(kr)\,\text{d}r,\end{eqnarray}$$
 $$\begin{eqnarray}\overline{\widetilde{\unicode[STIX]{x1D711}}}=L\{\widetilde{\unicode[STIX]{x1D711}}\}=\int _{0}^{\infty }\widetilde{\unicode[STIX]{x1D711}}\text{e}^{-st}\,\text{d}t,\quad \widetilde{\unicode[STIX]{x1D711}}=H\{\unicode[STIX]{x1D711}\}=\int _{0}^{\infty }\unicode[STIX]{x1D711}r\text{J}_{0}(kr)\,\text{d}r,\end{eqnarray}$$
 $$\begin{eqnarray}\widetilde{\unicode[STIX]{x1D702}}_{0}=H\{\unicode[STIX]{x1D702}_{0}\}=\int _{0}^{\infty }\unicode[STIX]{x1D702}_{0}r\text{J}_{0}(kr)\,\text{d}r,\end{eqnarray}$$
where
 $\text{J}_{0}(kr)$
is the zeroth-order Bessel function and
$\text{J}_{0}(kr)$
is the zeroth-order Bessel function and
 $k$
is the wavenumber of the resultant surface wave. Then solving (5.7)–(5.10) yields
$k$
is the wavenumber of the resultant surface wave. Then solving (5.7)–(5.10) yields
 $$\begin{eqnarray}\overline{\widetilde{\unicode[STIX]{x1D702}}}=\frac{s}{s^{2}+\unicode[STIX]{x1D714}^{2}}\widetilde{\unicode[STIX]{x1D702}}_{0}.\end{eqnarray}$$
Finally, from the relevant inverse Hankel and Laplace transforms, the wave elevation is obtained:
 $$\begin{eqnarray}\unicode[STIX]{x1D702}(r,t)=H^{-1}\left[L^{-1}\left\{\frac{s}{s^{2}+\unicode[STIX]{x1D714}^{2}}\widetilde{\unicode[STIX]{x1D702}}_{0}\right\}\right]=H^{-1}[\widetilde{\unicode[STIX]{x1D702}}_{0}\cos \unicode[STIX]{x1D714}t]=\int _{0}^{\infty }k\text{J}_{0}(kr)\widetilde{\unicode[STIX]{x1D702}}_{0}(k)\cos \unicode[STIX]{x1D714}t\,\text{d}k,\end{eqnarray}$$
where
 $\unicode[STIX]{x1D714}=\unicode[STIX]{x1D714}(k)$
is the dispersion relation as follows.
$\unicode[STIX]{x1D714}=\unicode[STIX]{x1D714}(k)$
is the dispersion relation as follows.
 $$\begin{eqnarray}\displaystyle & \displaystyle \unicode[STIX]{x1D714}^{2}=gk\quad \text{(gravity waves)}, & \displaystyle\end{eqnarray}$$
 $$\begin{eqnarray}\displaystyle & \displaystyle \unicode[STIX]{x1D714}^{2}=gk+\frac{\unicode[STIX]{x1D70E}}{\unicode[STIX]{x1D70C}}k^{3}\quad \text{(gravity{-}capillary waves)}, & \displaystyle\end{eqnarray}$$
 $$\begin{eqnarray}\displaystyle & \displaystyle \unicode[STIX]{x1D714}^{2}=\frac{\unicode[STIX]{x1D70E}}{\unicode[STIX]{x1D70C}}k^{3}\quad \text{(capillary waves)}. & \displaystyle\end{eqnarray}$$
 $t=18~\text{ms}$
in figure 3), then it can be expressed as the following Gaussian function:
$t=18~\text{ms}$
in figure 3), then it can be expressed as the following Gaussian function:  $$\begin{eqnarray}\unicode[STIX]{x1D702}_{0}(r)=\unicode[STIX]{x1D702}(r,t=0)=c_{1}\exp (-r^{2}/{c_{2}}^{2}),\end{eqnarray}$$
where
 $c_{1}=2.59~\text{mm}$
and
$c_{1}=2.59~\text{mm}$
and
 $c_{2}=3.56~\text{mm}$
. Then, from (5.15)–(5.17), the wave elevations (
$c_{2}=3.56~\text{mm}$
. Then, from (5.15)–(5.17), the wave elevations (
 $t>0$
) are computed as shown in figure 16(a) (gravity waves), figure 16(b) (gravity–capillary waves) and figure 16(c) (capillary waves) which show different wave-propagation characteristics. Direct comparison between these figures with experimental snapshots reveals that the resultant waves are indeed gravity–capillary waves as shown in figure 17, where the dashed curves are those in figure 16(b).
$t>0$
) are computed as shown in figure 16(a) (gravity waves), figure 16(b) (gravity–capillary waves) and figure 16(c) (capillary waves) which show different wave-propagation characteristics. Direct comparison between these figures with experimental snapshots reveals that the resultant waves are indeed gravity–capillary waves as shown in figure 17, where the dashed curves are those in figure 16(b).

Figure 17. Direct comparison between analytical results (dashed curves: gravity–capillary waves from figure 16 b) with experimental snapshots for case 1.
6 Summary
Jet-like surface waves generated by an electric-spark-generated underwater bubble are experimentally studied. Three different motions of jet-like surface waves are observed depending on the inception position of the bubble (
 $d$
: 0.28–7 mm) below the free surface and the maximum radius of the bubble (
$d$
: 0.28–7 mm) below the free surface and the maximum radius of the bubble (
 $R_{m}$
: 1.4–3.6 mm). When
$R_{m}$
: 1.4–3.6 mm). When
 $d/R_{m}>1.3$
, the surface wave shows a simple smooth hump (case 1). When
$d/R_{m}>1.3$
, the surface wave shows a simple smooth hump (case 1). When
 $0.82<d/R_{m}<1.3$
, a single droplet or multiple droplets are pinched off sequentially or simultaneously at the tip or from some points of the jet-like surface wave (case 2). Finally, when
$0.82<d/R_{m}<1.3$
, a single droplet or multiple droplets are pinched off sequentially or simultaneously at the tip or from some points of the jet-like surface wave (case 2). Finally, when
 $d/R_{m}<0.82$
, a series of squirting and jetting phenomena are observed at the top of the jet-like surface wave (case 3). For case 1, a proportional relationship is found between
$d/R_{m}<0.82$
, a series of squirting and jetting phenomena are observed at the top of the jet-like surface wave (case 3). For case 1, a proportional relationship is found between
 $\unicode[STIX]{x1D70C}gh/\unicode[STIX]{x0394}p$
and
$\unicode[STIX]{x1D70C}gh/\unicode[STIX]{x0394}p$
and
 $(d/R_{m})^{-4.4}$
. This proportional relationship is explained semi-analytically using a scaling argument, conservation of momentum and energy with the help of the Kelvin impulse theory. In addition, we solve the relevant axisymmetric Cauchy–Poisson problem where the initial condition is a jet-like surface wave near its maximum height. By comparing the analytical wave solution with the observed surface wave pattern, it is found that the resultant surface waves are indeed gravity–capillary waves where both the gravity and the surface tension are equally important. New findings in the present work can be useful in validating the relevant numerical simulation for jet-like waves on the unbounded free surface generated by the motion of a millimetre-sized underwater bubble.
$(d/R_{m})^{-4.4}$
. This proportional relationship is explained semi-analytically using a scaling argument, conservation of momentum and energy with the help of the Kelvin impulse theory. In addition, we solve the relevant axisymmetric Cauchy–Poisson problem where the initial condition is a jet-like surface wave near its maximum height. By comparing the analytical wave solution with the observed surface wave pattern, it is found that the resultant surface waves are indeed gravity–capillary waves where both the gravity and the surface tension are equally important. New findings in the present work can be useful in validating the relevant numerical simulation for jet-like waves on the unbounded free surface generated by the motion of a millimetre-sized underwater bubble.
As a final remark, in the present work, we focused on the formation of a single jet in case 1 which is caused by the downward jet in water while and after a bubble collapses and migrates downwards (figures 13 c and 13 d). Comparatively, in cases 2 and 3, we observed the formation of double jets while and after a bubble collapses and migrates downwards, such as frame 4 in figure 7, frame 6 in figure 18, frame 5 in figure 20, frame 5 in figure 22 and frame 5 in figure 24. These are interesting unexplained new phenomena. We conjecture that there will be two sequential pressure build-ups which are associated with the downward jet in water while a bubble collapses. An axisymmetric gravity–capillary boundary element method (BEM) numerical simulation may be useful to confirm this conjecture, and we leave this for future work.
Acknowledgements
This work was supported by National Research Foundation of Korea (NRF-2017R1D1A1B03028299).
Appendix A. Case 2: generation of two, three and multiple (more than four) droplets

Figure 18. Case 2
 $(0.82<d/R_{m}<1.3)$
: generation of two droplets when
$(0.82<d/R_{m}<1.3)$
: generation of two droplets when
 $d/R_{m}=1.18$
and
$d/R_{m}=1.18$
and
 $h/R_{m}=6.31$
(
$h/R_{m}=6.31$
(
 $d=2.5~\text{mm}$
at
$d=2.5~\text{mm}$
at
 $t=0~\text{s}$
,
$t=0~\text{s}$
,
 $R_{m}=2.13~\text{mm}$
at
$R_{m}=2.13~\text{mm}$
at
 $t=0.29~\text{ms}$
,
$t=0.29~\text{ms}$
,
 $h=13.4~\text{mm}$
at
$h=13.4~\text{mm}$
at
 $t=23.6~\text{ms}$
). The physical dimension of each picture is 20 mm (height) by 15 mm (width).
$t=23.6~\text{ms}$
). The physical dimension of each picture is 20 mm (height) by 15 mm (width).

Figure 19. Case 2
 $(0.82<d/R_{m}<1.3)$
: snapshots of detailed motion of the bubble in figure 18. The physical dimension of each picture is 10 mm (height) by 10 mm (width).
$(0.82<d/R_{m}<1.3)$
: snapshots of detailed motion of the bubble in figure 18. The physical dimension of each picture is 10 mm (height) by 10 mm (width).

Figure 20. Case 2
 $(0.82<d/R_{m}<1.3)$
: generation of three droplets when
$(0.82<d/R_{m}<1.3)$
: generation of three droplets when
 $d/R_{m}=1.06$
and
$d/R_{m}=1.06$
and
 $h/R_{m}=6.56$
(
$h/R_{m}=6.56$
(
 $d=2.95~\text{mm}$
at
$d=2.95~\text{mm}$
at
 $t=0~\text{s}$
,
$t=0~\text{s}$
,
 $R_{m}=2.78~\text{mm}$
at
$R_{m}=2.78~\text{mm}$
at
 $t=0.42~\text{ms}$
,
$t=0.42~\text{ms}$
,
 $h=18.2~\text{mm}$
at
$h=18.2~\text{mm}$
at
 $t=38.5~\text{ms}$
). The physical dimension of each picture is 30 mm (height) by 15 mm (width).
$t=38.5~\text{ms}$
). The physical dimension of each picture is 30 mm (height) by 15 mm (width).

Figure 21. Case 2
 $(0.82<d/R_{m}<1.3)$
: snapshots of detailed motion of the bubble in figure 20. The physical dimension of each picture is 10 mm (height) by 10 mm (width).
$(0.82<d/R_{m}<1.3)$
: snapshots of detailed motion of the bubble in figure 20. The physical dimension of each picture is 10 mm (height) by 10 mm (width).

Figure 22. Case 2
 $(0.82<d/R_{m}<1.3)$
: generation of multiple droplets when
$(0.82<d/R_{m}<1.3)$
: generation of multiple droplets when
 $d/R_{m}=1.04$
and
$d/R_{m}=1.04$
and
 $h/R_{m}=8.43$
(
$h/R_{m}=8.43$
(
 $d=2.9~\text{mm}$
at
$d=2.9~\text{mm}$
at
 $t=0~\text{s}$
,
$t=0~\text{s}$
,
 $R_{m}=2.8~\text{mm}$
at
$R_{m}=2.8~\text{mm}$
at
 $t=0.46~\text{ms}$
,
$t=0.46~\text{ms}$
,
 $h=23.6~\text{mm}$
at
$h=23.6~\text{mm}$
at
 $t=33.1~\text{ms}$
). The physical dimension of each picture is 20 mm (height) by 15 mm (width) or 30 mm (height) by 15 mm (width).
$t=33.1~\text{ms}$
). The physical dimension of each picture is 20 mm (height) by 15 mm (width) or 30 mm (height) by 15 mm (width).

Figure 23. Case 2
 $(0.82<d/R_{m}<1.3)$
: snapshots of detailed motion of the bubble in figure 22. The physical dimension of each picture is 10 mm (height) by 10 mm (width).
$(0.82<d/R_{m}<1.3)$
: snapshots of detailed motion of the bubble in figure 22. The physical dimension of each picture is 10 mm (height) by 10 mm (width).
Appendix B. Case 3: different squirting and jetting phenomena

Figure 24. Case 3
 $(d/R_{m}<0.82)$
: squirting and jetting phenomena when
$(d/R_{m}<0.82)$
: squirting and jetting phenomena when
 $d/R_{m}=0.67$
(
$d/R_{m}=0.67$
(
 $d=1.4~\text{mm}$
at
$d=1.4~\text{mm}$
at
 $t=0~\text{s}$
,
$t=0~\text{s}$
,
 $R_{m}=2.1~\text{mm}$
at
$R_{m}=2.1~\text{mm}$
at
 $t=0.38~\text{ms}$
). The physical dimension of each picture is 30 mm (height) by 15 mm (width) or 40 mm (height) by 15 mm (width).
$t=0.38~\text{ms}$
). The physical dimension of each picture is 30 mm (height) by 15 mm (width) or 40 mm (height) by 15 mm (width).

Figure 25. Case 3
 $(d/R_{m}<0.82)$
: snapshots of detailed motion of the bubble in figure 24. The physical dimension of each picture is 10 mm (height) by 10 mm (width).
$(d/R_{m}<0.82)$
: snapshots of detailed motion of the bubble in figure 24. The physical dimension of each picture is 10 mm (height) by 10 mm (width).