


Physical activity is important in the management of type 2 diabetes mellitus. Previous studies (Reference Boulé, Haddad, Kenny, Wells and Sigal2;Reference Eves and Plotnikoff12;Reference Snowling and Hopkins21;Reference Thomas, Elliott and Naughton23) have found that structured aerobic exercise (walking, jogging, or cycling) and resistance exercise (weightlifting) are effective in reducing absolute hemoglobin A1c (HbA1c). Reductions in HbA1c are associated with a decrease in major cardiovascular events (Reference Selvin, Marinopoulos and Berkenblit19) and in microvascular complications (Reference Stratton, Adler and Neil22).
The DARE (Diabetes Aerobic and Resistance Exercise) clinical trial (Reference Sigal, Kenny and Boulé20) was designed to determine the effects on glycemic control and other risk factors for cardiovascular disease of aerobic and resistance training alone and in combination compared with a sedentary control group. The study found that in comparison to the control group, HbA1c was lower in the aerobic training group (mean reduction = 0.51 percent: 95 percent confidence interval [CI], –0.87 to –0.14) and in the resistance group (mean reduction = 0.38 percent: 95 percent CI, –0.72 to –0.22). Furthermore, combined exercise training resulted in an additional reduction in HbA1c of 0.46 percent (CI, –0.83 to –0.09) compared with aerobic training alone and 0.59 percent (CI, –0.95 to –0.23) compared with resistance training alone. Differences in blood pressure and lipid values between groups were not statistically significantly. An hypothesis that those randomized to combined aerobic and resistance exercise training or resistance exercise alone would show greater change in well-being and health status was only partially supported (Reference Reid, Tulloch and Sigal16).
Thus the DARE trial demonstrated that either aerobic or resistance training alone improves glycemic control in type 2 diabetes, but the improvements are greatest with combined aerobic and resistance training. Stemming from this trial, the focus of this study is to assess the cost-effectiveness of aerobic and resistance exercise, both alone and in combination versus a sedentary waiting list control in the treatment of nonexercising persons with type 2 diabetes.
METHODS
Patient Population
The patient population for the model was the same as the DARE clinical trial (Reference Sigal, Kenny and Boulé20). In the trial, 251 subjects aged 39 to 70 with a diagnosis of type 2 diabetes were randomly assigned to one of three exercise programs (aerobic exercise, resistance exercise, or combined) or a sedentary control. Exercise training was performed three times weekly at community based facilities.
The clinical trial included type 2 diabetes, as defined by the American Diabetes Association (17). Exclusion criteria related to current insulin therapy, previous exercise and resistance training, changes during the previous 2 months in oral medications, and significant changes in body weight, serum creatinine, proteinuria, or blood pressure. Patients in the trial had a mean age of 54.2 with an average duration of diabetes of 5.4 years. There were more males (65.1 percent) than females. Mean HbA1c was 7.7 percent, and mean body mass index (BMI) was 33.5 kg/m2. The mean SF-36 physical and mental component summary scores were 49.2 and 51.0, respectively. Full inclusion and exclusion criteria as well as more detailed information on the patient population are available from the original trial paper (Reference Sigal, Kenny and Boulé20).
Treatment Comparators
Analysis compared the three exercise programs from DARE with the control group with no supervised exercise program: aerobic exercise, resistance exercise, and a combination of aerobic and resistance exercise. Subjects exercised three times per week and training progressed gradually in length and intensity. Individual supervision was provided by an exercise specialist. After the prerandomization initial run-in period, eleven personal training sessions were provided by the exercise specialist over the course of the first 6 months. At the end of the 6-month period, subjects were given a maintenance program and re-examined 6 months later. During this period, all patients had the option to follow whichever exercise program they wanted and there were no further restrictions on changes in medication. Therefore, the effect of the exercise programs is reflected to a greater extent in the 6-month results rather than the 12-month results. Adherence with exercise training within the clinical trial was high–median exercise training attendance was 86 percent in the combined exercise training group, 80 percent in the aerobic training group, and 85 percent in the resistance training group (Reference Sigal, Kenny and Boulé20).
Analytical Framework
Analysis was conducted to estimate both the mean lifetime costs of each of the exercise programs and the mean effectiveness, which was expressed as both life-years and quality-adjusted life-years (QALYs) (7). Lifetime costs, life expectancy, and QALYs were estimated for each patient within the DARE clinical trial using a computer simulation model described below. Cost-effectiveness was assessed by incremental cost-effectiveness ratios (ICER). The primary perspective of the study was societal in that it incorporates both the costs of healthcare services and the costs of the exercise program. Future costs and benefits were discounted at 5 percent per annum (7).
Decision Model
Analysis was conducted by adapting the United Kingdom Prospective Diabetes Study (UKPDS) Health Outcomes Model (Reference Clarke, Gray and Briggs9) to the Canadian context. The UKPDS model predicts the transition of patients into different health states which are combination states incorporating seven diabetes-related complications; myocardial infarction (MI), other ischemic heart disease (IHD), stroke, heart failure, amputation, renal failure, and eye disease as well as death. The model was developed using data from 3642 patients with newly diagnosed type 2 diabetes who participated in the UKPDS and were followed up for between 6 and 20 years. It incorporates information regarding risk factors which include age, sex, ethnicity, duration of diabetes, height, weight, smoking status, total cholesterol, HDL cholesterol, systolic blood pressure, and HbA1c to predict the likely outcomes. The cycle time for the model is 12 months with a 40-year simulation duration which is assumed to approximate the maximum life expectancy of the patient population.
The UKPDS model estimates the discounted time an individual will spend in each health state (Reference Clarke, Gray and Briggs9). Thus, the model can be used to estimate discounted life expectancy. By weighting life expectancy by appropriate costs and utility values, the model can estimate both discounted lifetime costs and discounted quality-adjusted life-years.
For each individual patient, both the individual baseline data for the patients from the trial and the 6-month follow-up data are entered into the model. The model is then used to predict lifetime costs, life expectancy, and QALYs for the cohort of patients in the clinical trial. The model was adapted to the Canadian context by estimating costs associated with the specific diabetes complications modeled within the UKPDS model, as described below under “Costs.”
The predicted outcomes for each cohort are obtained through Monte Carlo simulation where repeated estimates of the outcomes based on the individual patient characteristics are obtained (Reference Doubilet, Begg and Weinstein11). In this analysis, 1,000 estimates of outcomes per patient were obtained to derive expected lifetime costs, life expectancy, and QALYs. From this, mean estimates for all four treatment comparators were obtained.
Information on some risk factors, specifically ethnicity and presence of atrial fibrillation and peripheral vascular disease (PVD) was not collected systematically as part of the clinical trial. For the base case scenario, all patients were assumed to be Caucasian nonsmokers with neither atrial fibrillation nor PVD. These assumptions were tested within the sensitivity analysis.
Costs
Both the healthcare costs associated with diabetes complications and the cost of the exercise program were incorporated within the model. Costs that were the same for all four programs (e.g., management during the run in period) were excluded from the analysis. All costs are reported in 2008 Canadian dollars.
A detailed literature review was conducted to determine the costs to the healthcare system for each of the disease states within the model: that is, the costs of managing diabetes without complications and the incremental costs associated with each diabetes-related complication. The most recent relevant Canadian estimates were used in the analysis (Reference Coyle, Palmer and Tam10;Reference Goeree, Lim and Hopkins13;Reference Lamy, Yusuf, Pogue and Gafni15) (Table 1).
Table 1. Annual Costs and Utility Values for Disease State
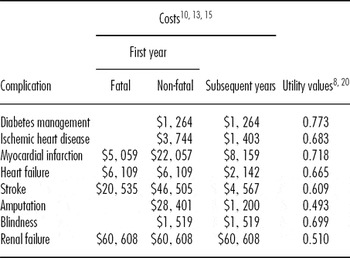
Note. The table provides the annual costs and utility values associated with each complication of diabetes reported in 2008 Canadian dollars. Different costs are provided for an incident event, subsequent years post event and a fatal event. Costs for each complication are additional to the costs associated with diabetes management. Utilities are obtained by subtracting the decrement associated with each complication from the mean utility value from the DARE study which is used as the utility value for no complications.
The costs of the exercise program were based on the clinical trial program. Analysis assumed life time membership to a health club, the YMCA, at a cost of $449 per annum and a cost of $250 per annum for 13 one-hour Exercise Specialist sessions. Sensitivity analysis included alternative estimates of this cost.
Utilities
Utility values were necessary for all possible health states within the model. For the time when patients experience no complications, the utility value was derived from the DARE clinical trial (Reference Sigal, Kenny and Boulé20). In the trial, all patients completed the SF-36 questionnaire at baseline (Reference Ware, Snow, Kolinski and Gandeck25). The responses to this questionnaire were used to estimate a mean baseline utility value for all patients based on the SF6D scoring algorithm (Reference Brazier, Roberts and Deverill3) (Table 1).
For the time when patients experienced diabetes-related complications, the baseline utility was reduced by an estimated utility deficit for the relevant complications. The utility deficits associated with the seven diabetes-related complications had been previously estimated from the UKPDS study (Reference Clarke, Gray and Holman8) (Table 1).
Sensitivity Analysis
Univariate sensitivity analysis was conducted with respect to the following factors: (Reference Briggs, Sculpher and Buxton4)
• Patients’ smoking status, ethnicity, and the presence of atrial fibrillation or PVD.
• Based on outcomes at 12 months (6 months after the end of the randomized portion of the trial) rather than 6 months.
• Different durations of gym membership and number of regular sessions with an exercise specialist.
• Increasing the costs of gym membership and exercise specialist sessions.
• Increasing and decreasing the cost of complications by 50 percent.
• Excluding the costs of the exercise programs.
• Alternative discount rates for future costs and benefits.
In addition to univariate sensitivity analysis, probabilistic sensitivity analysis was conducted through Monte Carlo simulation using the 1,000 estimates of lifetime costs and outcomes for each patient (Reference Doubilet, Begg and Weinstein11). This allowed presentation of the second order uncertainty around the results through cost-effectiveness acceptability curves (Reference Briggs5;Reference van Hout, Al and Gordon24). A cost-effectiveness acceptability curve shows the probability that each intervention is cost-effective based on alternative values for a QALY, given the available data and their uncertainty.
RESULTS
Base Results
In terms of total lifetime costs, including the costs of the exercise programs and downstream healthcare resource usage, the combined exercise program was the most expensive ($40,050), followed by the aerobic program ($39,250), the resistance program ($38,300), and no program ($31,075) (Table 2). Both life expectancy and quality-adjusted life expectancy were highest for the combined exercise program (life-years = 11.79, QALYs = 8.94) compared with aerobic training (life-years = 11.57, QALYs = 8.77), resistance training (life-years = 11.51, QALYs = 8.73), and no program (life-years = 11.48, QALYs = 8.70).
Table 2. Base Results: Cost-Effectiveness

Note. QALY, quality-adjusted life-year.
The resistance, aerobic, and combined programs were more effective and more costly compared with no exercise program. The incremental cost per QALY was $206,985, $116,793, and $37,872 for the resistance, aerobic, and combined programs, respectively, as compared with no exercise program. The incremental cost per QALY for the combined program was $4,792 compared with the aerobic program and $8,570 compared with the resistance program.
Sensitivity Analysis
The results were consistent across each of the univariate sensitivity analyses (Table 3). In all cases, the combined exercise program resulted in the greatest increase in life expectancy and quality-adjusted life expectancy. At a maximum value of $50,000 per QALY (Reference Sapsford18) the combined exercise program remained cost-effective as compared with the three alternatives across all sensitivity analyses.
Table 3. Sensitivity Analysis

Note. # Caucasian, non-smokers without PVD or atrial fibrillation, lifetime gym membership with exercise specialists, from societal perspective.
PVD, peripheral vascular disease.
The cost-effectiveness acceptability curve depicts the probability that each of the interventions is cost-effective for values of a QALY ranging from $0 to $100,000. (Figure 1) For a ceiling of $50,000 per QALY (Reference Sapsford18), the probability that the combined program is the most cost-effective is 55.5 percent.

Figure 1. Cost-effectiveness acceptability curve, depicting the probability of each of the four comparators which is the most cost-effective given different thresholds relating to a decision maker's willingness to pay for a quality-adjusted life-year (QALY) gained. The probability for resistance and aerobic was 0% for all ratios.
DISCUSSION
Exercise has been shown to have a positive effect for individuals with type 2 diabetes. Previous studies have shown that aerobic exercise training and resistance exercise training significantly affect HbA1c values. This was confirmed by the DARE clinical trial which also found that a combined aerobic and resistance exercise program is more effective than programs involving only one form of exercise. In this study, we used data from the DARE clinical trial combined with a computer simulation model and Canadian specific cost data to examine the cost-effectiveness of exercise programs for persons with type 2 diabetes.
Our study found that the combined exercise program was the most cost-effective of the alternatives compared with the cost per QALY gained being less than $50,000 against all comparators. Sensitivity analysis confirmed that this finding was robust to all changes in assumptions.
There are limitations when conducting economic analysis in chronic diseases when based on clinical trials of short duration. Analysis incorporated the 6-month outcomes which may not be sustained over the long-term. However, the sensitivity analysis incorporated the 12-month outcomes which allows for noncompliance with exercise program beyond the initial 6-month period. It should be noted that examining 12-month outcomes may involve dilution of the original differences between exercise programs and controls because subjects (including controls) were allowed to follow any exercise program they chose during months 7–12 and there were no restrictions on medication changes during this period. The results of the sensitivity analysis found that analysis based on the 12-month outcomes led to the same interpretation as the analysis based on 6-month outcomes. There may still be concerns that the benefits obtained within the first 12 months might not be sustained over a longer period of time, although the base analysis assumes that continued gym membership and exercise specialist sessions would be funded for the patient's lifetime.
A limitation of the clinical trial is that the duration may not have been long enough to determine any quality of life benefits from exercise. In a previous study from the DARE trial, the assumption that combined aerobic and resistance exercise training or resistance exercise alone would show improvements in well-being and health status in the short-term was only partially supported (Reference Reid, Tulloch and Sigal16). Thus, analysis does not include consideration of any additional clinical benefits to be obtained from encouraging exercise within persons with type 2 diabetes nor does it consider whether there are any additional costs to participants—that is, costs of exercise clothing and lost time to pursue other activities. In the long-term, individuals will decide on whether to continue their exercise program based on an evaluation of the relative benefits versus costs.
Analysis assumes that exercise training during the first year will have a one-time effect on ameliorating risk factors for type 2 diabetes. Thus factors such as HbA1c will be assumed to increase after the first year based on the standard assumptions within the UKPDS model. This is likely to bias against the effectiveness of exercise programs if continued benefits in modifying risk factors are obtained.
The costs of gym membership were obtained from different centers in Ottawa, Calgary, and Toronto. It is possible that these estimates may not be generalizable to other communities. A sensitivity analysis was conducted doubling the costs of membership and exercise sessions. This had little effect on the estimate of the incremental cost per QALY gained.
The application of economic analysis is often limited due to lack of recognition of an acceptable threshold value for assessing cost-effectiveness. Analysis adopted a threshold of $50,000 based on previous reports that a range of $40,000 to $60,000 is used as an informal threshold within the province of Ontario in decision making regarding the funding of pharmaceuticals (Reference Sapsford18). Given this, the results of the analysis suggest that a combined aerobic and resistance exercise program is more cost-effective than a resistance exercise program, an aerobic exercise program, or no program. However, this requires the assumption that the informal threshold used for pharmaceuticals can be interpolated to other nonpharmacological interventions. Thus, our conclusion that the program is cost-effective is reliant on a decision maker's willingness to pay for a QALY being at least $37,782.
We could not find any similar studies which have formally evaluated cost-effectiveness of exercise programs for persons with type 2 diabetes. There have been several studies that have demonstrated that lifestyle modification (including exercise) are cost-effective interventions for patients with prediabetes or are at high risk of developing diabetes (e.g., 1;14). A study of twenty-five patients did demonstrate a significant reduction in costs of complications with exercise although the small scale nature of this study and the lack of a formal economic analysis precludes further conclusions to be drawn (Reference Brun, Bordenave, Mercier, Jaussent, Picot and Préfaut6).
The conclusions of the analysis were insensitive to changes in several parameters. Results were most sensitive to assumptions relating to the cost of gym membership and visits with exercise specialists. If only the first years costs of gym membership are included, the incremental costs per QALY gained was only $3,982.
The base analysis can be considered highly conservative as it assumes both no additional benefits on risk factor modification beyond the first year but included the continued costs of exercise programs for lifetime. Despite these assumptions, analysis suggests that it would be at least as cost-effective for a healthcare ministry to cover the costs of a combined aerobic and resistance exercise program for individuals with type 2 diabetes; including both gym memberships and sessions with an exercise specialist; as covering the costs of diabetic medications
CONCLUSION
A combined program providing training in both resistance and aerobic exercise was the most cost-effective of the alternatives compared based on previous funding decisions. Within a public healthcare system, the funding of exercise training for individuals with type 2 diabetes can be considered an efficient use of resources.
CONTACT INFORMATION
Doug Coyle, PhD, Professor, Department of Epidemiology and Community Medicine, University of Ottawa, Ottawa, Ontario, Canada
Kathryn Coyle, MSc, Senior Associate, Applied Health Economic Research Unit, Ottawa, Ontario, Canada
Glen P. Kenny, PhD, University of Ottawa Research Chair in Environmental Physiology, School of Human Kinetics, Faculty of HealthSciences, University of Ottawa, Ottawa, Ontario, Canada
Normand G. Boulé, PhD, Professor, School of Human Kinetics, Faculty of Health Sciences, University of Ottawa, Faculty of Physical Education and Recreation, University of Alberta, Edmonton, Canada
George A. Wells, PhD, Professor, Department of Epidemiology and Community Medicine, Faculty of Medicine, University of Ottawa; Director, Cardiovascular Research Methods Centre, University of Ottawa Heart Institute, Ottawa, Ontario, Canada
Michelle Fortier, PhD, Professor, School of Human Kinetics, Faculty of Health Sciences, University of Ottawa, Department of Psychology, Faculty of Medicine, University of Ottawa, Ottawa, Ontario, Canada
Robert D. Reid, PhD, Associate Professor, Medicine, University of Ottawa; Associate Director, Minto Prevention and Rehabilitation Centre, University of Ottawa Heart Institute, Ottawa, Ontario, Canada
Penny Phillips, MA, Research Coordinator, Clinical Epidemiology Program, Ottawa Health Research Institute, Ottawa, Ontario, Canada
Ronald J. Sigal, Professor, School of Human Kinetics, Faculty of Health Sciences, Department of Medicine, Faculty of Medicine, University of Ottawa, University of Ottawa, Ottawa, Ontario, Canada; Professor, Departments of Medicine, Cardiac Sciences and Community Health Sciences, Faculties of Medicine and Kinesiology, University of Calgary, Calgary, Alberta, Canada
CONFLICTS OF INTEREST
Glen Kenny, Penny Phillips and Ronald Sigal report having received a grant to their institution from Canadian Institutes of Health Research. The other authors have no potential conflicts of interest.


