


Introduction
The section Petota of the genus Solanum includes approximately 200 tuber-bearing species (Camadro et al., Reference Camadro, Erazzú, Maune and Bedogni2012). Most of them are diploid (2n= 2x= 24) and others have a somatic chromosome complement ranging from 2n= 3x= 36 to 2n= 6x= 72. The common potato, Solanum tuberosum, is a tetraploid (2n= 4x= 48). Due to a very large range of geographical and ecological adaptation, wild potato species have often developed strong resistance to stresses (Bradshaw, Reference Bradshaw, Vreugdenhil, Bradshaw, Gebhardt, Governs, Mackerron, Taylor and Ross2007). The evolutionary diversity of the wild species and the comparatively narrow genetic basis of the cultivated potato make Solanum species unique materials for breeding. However, these species have been underutilized so far, owing mainly to linkage drag (Gebhardt and Valkonen, Reference Gebhardt and Valkonen2001). Not only do wild species provide traits lacking in S. tuberosum, but also supply the allelic diversity necessary to guarantee high levels of heterosis for polygenic traits (reviewed in Carputo et al. (Reference Carputo, Camadro and Peloquin2006)). In the potato, to transfer traits of interest from a noteworthy (e.g. resistant) species, several strategies are available. The traditional one is based on unilateral sexual polyploidization (4x–2x crosses where the parent with lower ploidy produces 2n gametes). This option is particularly suitable for exploitation of diploid species compatible with S. tuberosum haploids. Alternatively, strategies based on either somatic hybridization or bridge crosses can be employed (Jansky, Reference Jansky2006). Genotypes carrying genes of agricultural interest to potato can also be used to clone relevant genes for a direct transfer to the cultivated potato through genetic engineering (Bradeen et al., Reference Bradeen, Carputo, Douches, Kole and Hall2008).
Since potato breeding requires a constant flow of new genetic material into the cultivated gene pool, it is necessary to continuously characterize the genetic diversity among species. A first, simple criterion to estimate genetic diversity is based on phenotypic analysis for traits of interest. Despite its limitations, this method has been used several times to identify genotypes possessing target traits and to design appropriate breeding schemes (Simko et al., 2007). To increase the efficiency of genetic diversity characterization, molecular markers are particularly attractive since they provide a direct estimation of diversity and help in the selection of parents that guarantee a superior genetic combination (Bisognin and Douches, Reference Bisognin and Douches2002). In addition, molecular fingerprints can be used to map traits of interest and to develop molecular linkage maps for wild potato species (Gebhardt, Reference Gebhardt, Vreugdenhil, Bradshaw, Gebhardt, Governs, Mackerron, Taylor and Ross2007). One particularly attractive application is the identification of molecular markers to conduct selection in breeding programmes. It enables breeders to precisely introgress small genome pieces from the species of interest while reducing the incorporation of genes with an undesirable effect. This aspect is particularly important given that linkage drag has limited the exploitation of potato biodiversity so far.
The objective of this study was to determine the resistance response of potato species following exposure to low temperatures and inoculation with two important potato pathogens, Ralstonia solanacearum and Potato virus Y (PVY). Resistance to all these stresses is an important target for potato breeding due to both the low number of resistant varieties and the necessity to have more and alternative sources of resistance. In addition, phenotypic diversity was compared with that derived from microsatellite marker analysis. Our results demonstrated substantial interspecific polymorphisms and documented the potential for the development of markers for marker-assisted selection (MAS).
Materials and methods
Plant materials
Twenty-one genotypes from random seedlings belonging to 19 accessions of 12 Solanum species were used in this study. Wild species included S. acaule (PI210029), S. bulbocastanum (PI275190, PI275188 and PI243510), S. canasense (PI365321), S. cardiophyllum (PI283062 and PI347759), S. chacoense (PI133124 and PI275141), S. commersonii (PI243503 and PI590886), S. etuberosum (PI558054), S. fendleri (PI275165 and PI458417), S. multidissectum (8MLT-M1), S. phureja (pI584995 and PI484993), S. stoloniferum (PI275248) and S. tarijense (PI414148). Code and pedigree of each genotype are given in Table 1. To provide an easier comparison with data previously published, we are using the classification proposed by Ochoa (Reference Ochoa1990). More recent information on the classification of tuber-bearing species is available on the Solanaceae Source website. Most of the species were provided by the IR-1 Potato Introduction Project, Sturgeon Bay, WI. Genotype PT29 belonging to S. bulbocastanum (PI243510) was provided by Dr J. Bradeen, University of Minnesota, and genotypes of S. phureja and S. multidissectum by the International Potato Center of Lima (Peru). To find species-specific alleles, 22 S. tuberosum varieties normally used as parents in our breeding programmes (‘Agata’, ‘Agria’, ‘Antea’, ‘Arinda’, ‘Arrow’, ‘Asterix’, ‘Badia’, ‘Bartina’, ‘Dayana’, ‘Elfe’, ‘Elvira’, ‘Frisia’, ‘Inova’, ‘Liseta’, ‘Marabel’, ‘Primura’, ‘Sieglinde’, ‘Spunta’, ‘Terragold’, ‘Veronie’, ‘Vivaldi’ and ‘Volumia’) were included in molecular studies. ‘Blondy’ was used as the susceptible control in all resistance tests. All genotypes were maintained as micropropagated plants on MS medium (Murashige and Skoog, Reference Murashige and Skoog1962) with 1% sucrose and 0.8% agar, and incubated at 4000 lux, 16 h light and 24°C. Four-week-old plants were transplanted into styrofoam trays filled with sterile soil and acclimated to ex vivo conditions in a growth chamber at 20°C. After 2 weeks, they were transferred into pots and grown in a greenhouse/growth chamber according to the resistance assay to be performed. An independent set of plants was grown in a greenhouse at 20–24°C to collect leaves for DNA extraction.
Table 1 Results (mean±standard error) from screening tests for resistance to Ralstonia solanacearum, PVYNTN, low temperatures in non-acclimated (NACC) and acclimated (ACC) conditions of the 21 genotypes belonging to the 12 Solanum speciesa
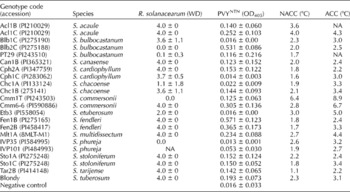
WD, wilting degree; OD405, optical density at 405 nm; NA, not available.
a S. tuberosum control Blondy is also included.
Screening for R. solanacearum resistance
R. solanacearum (SA 93) r3 bv2, isolated from potato, was used for resistance assay as described previously (Carputo et al., Reference Carputo, Aversano, Barone, Di Matteo, Iorizzo, Sigillo, Zoina and Frusciante2009). When a 6–8 leaflet stage was reached, 9–12 uniform plants for each genotype were inoculated by pouring 1 ml of suspension (5 × 10⁷cfu/ml) into 1 cm deep holes made in the soil. Three controls plants were treated with sterile distilled water. Plants were randomly distributed and grown in a climatic cell at 80% relative humidity, at 27°C, 14 h day and 21°C, 10 h night. The whole experiment was performed twice. The wilting symptoms of each plant were recorded as the percentage of wilted leaves, and resistance was quantified by a wilting degree (WD) in leaves ranging from 0 to 4 (Fock et al., Reference Fock, Collonnier, Luisetti, Purwito, Souvannavong, Vedel, Servaes, Ambroise, Kodja, Ducreux and Sihachakr2001): 0 = no wilted leaves; 1 = up to 25% wilted leaves; 2 = 26–50% wilted leaves; 3 = 51–75% wilted leaves; 4 = more than 75% wilted leaves. For each genotype, the average WD at 20 d after inoculation was calculated; when WD<1, a genotype was classified as resistant. To discriminate the presence or absence of the bacterium, 15 and 30 d after inoculation, one sample for each genotype was used for DNA extraction from roots and apical leaves following the protocol described by Llop et al. (Reference Llop, Caruso, Cubero, Morente and López1999). DNA (30 ng) was used in the polymerase chain reaction (PCR) following the European Directive (Council Directive 98/57/EC). In particular, the primers OLI-1 and Y-2 specific for a R. solanacearum genomic region of 288 bp coding for a ribosomal protein (Seal et al., Reference Seal, Jackson, Young and Daniels1993) were used. PCRs were performed in a 25 μl volume containing 1 × reaction buffer with 1.5 mM MgCl2, 0.2 mM of each dNTP, 25 pM of both primers and 1 unit of Taq polymerase. The PCR was carried out using the following cycling profiles: 2 min at 96°C; 35 cycles of 20 s at 94°C, 20 s at 68°C, and 30 s at 72°C, with a final extension step of 10 min at 72°C. Amplification products were directly analysed by electrophoresis on 1% agarose gel and stained with GelRed (Biotium, UK).
Screening for PVY resistance
Tests were performed against a PVY tuber necrotic strain (PVYNTN) isolated in Italy from the cultivar S. tuberosum ‘Adora’. It was maintained on Nicotiana glutinosa, under greenhouse conditions. Extracts were prepared by grinding N. glutinosa symptomatic leaves in 10 mM potassium phosphate buffer at pH 7.0 (1:5, w/v). They were mechanically inoculated on ten plantlets for each genotype at the 2–3 leaf stage, using carborundum (600 mesh). Two control plants for each genotype were inoculated with only phosphate buffer. Plants were grown under greenhouse conditions (20–24°C). Genotypes were evaluated for local and systemic symptoms and for PVYNTN presence on the new emergent leaves by enzyme-linked immunosorbent assay (DAS-ELISA) 15, 30 and 45 d after inoculation. The test was performed using a commercial polyclonal antiserum against PVY (Loewe-Phytodiagnostica Biochemical, Sauerlach, Germany). After adding the substrate, reactions were allowed to develop at room temperature and measured after 5 and 20 min at an optical density of 405 nm with a Bio-Rad microplate reader. The average absorbance of two wells for each sample was used to evaluate the presence of virus. A sample was considered positive when its mean A 405 nm value was at least two times higher than the mean value of the healthy control. The screening test was replicated twice. A genotype was classified as resistant when all the inoculated plantlets remained free from symptom expression and were negative to the ELISA test. Intermediate resistance was designated when the number of infected plants increased over time or when expression for systemic infection was delayed. Genotypes were considered susceptible when all the inoculated plants were infected. To confirm the absence of the virus in their tissues, 30 d after inoculation, resistant plants were also analysed by reverse transcriptase-PCR (RT-PCR) using the specific primers PVYc3/PVYf (Rigotti and Gugerli, Reference Rigotti and Gugerli2007). Total viral RNA was extracted from frozen leaf tissues by the RNeasy Mini Kit (Qiagen, Valencia, CA, USA) according to the manufacturer's protocols, and RT-PCR was performed with 1 μg RNA by Superscript™ One-Step RT-PCR with Platinum®Taq (Invitrogen, Carlsbad, CA, USA).
Screening for low-temperature resistance
Genotypes were evaluated both in a non-acclimated condition and following cold acclimation. The electrolyte leakage procedure described by Carputo et al. (Reference Carputo, Terra, Barone, Esposito, Fogliano, Monti and Frusciante2003) was adopted. Eight clonally propagated plants from each genotype were grown for 7 weeks in a growth chamber under cool white fluorescent lamps (350–400 μmol/m2/s) at 20–24°C (dark/light). Four of them were used to collect leaves for non-acclimated studies. To achieve acclimation, temperature was then lowered to 4/2°C (light/dark) at 100 μmol/m2/s for two more weeks before collecting leaves from the remaining plants. Mature expanded leaves were put in culture tubes and submerged in a glycol bath at 0°C. Three replicates per genotype were used in each temperature treatment. Temperature was lowered by 0.5°C every 30 min. The control treatment consisted of three replicates per genotype kept on ice at 0°C. After 30 min at the desired freezing temperature, the tubes were placed on ice to thaw overnight. Resistance in non-acclimated and acclimated conditions for each genotype was determined by calculating the temperature at 50% of freezing injury, according to the logistic model described by Janácek and Prásil (Reference Janácek and Prásil1991). Genotypes displaying a killing temperature < − 3 and − 4°C were considered resistant in non-acclimated and acclimated conditions, respectively.
Microsatellite analysis
DNA extraction was carried out using the Plant DNeasy Kit (Qiagen) according to the manufacturer's instructions. Analyses were carried out with 12 nuclear microsatellite (simple sequence repeat (SSR)) primer pairs. They were chosen from four sources: five primer pairs from Ghislain et al. (Reference Ghislain, Spooner, Rodríguez, Villamón, Núñez, Vásquez, Waugh and Bonierbale2004); two from Ghislain et al. (Reference Ghislain, Núñez, del Rosario Herrera, Pignataro, Guzman, Bonierbale and Spooner2009); two from Milbourne et al. (Reference Milbourne, Meyer, Collins, Ramsay, Gebhardt and Waugh1998); three from Feingold et al. (Reference Feingold, Lloyd, Norero, Bonierbale and Lorenzen2005). All SSRs were recommended at the CIP (www.cipotato.org), based on quality criteria, genome coverage and locus-specific information content. PCRs were performed in a 20 μl volume containing 1 × reaction buffer with 2.5 mM MgCl2, 0.2 mM of each dNTP, 25 pM FAM-labelled forward SSR primer, 15 pM reverse SSR primer, 1 unit of GoTaq DNA polymerase (Promega, Madison, WI, USA) and 40 ng of genomic DNA. The PCR was carried out using the following cycling profiles: 4 min at 94°C; 31 cycles of 45 s at 94°C, 1 min at annealing temperature (T a), and 1 min at 72°C, with a final extension step of 5 min at 72°C. PCR products were separated on an ABI PRISM® 3130 DNA Analyzer system (Applied Biosystems, Foster City, CA, USA). Size calibration was performed with the molecular weight ladder GeneScan® 500 ROX™ Size Standard. SSR alleles were detected and scored by GeneScan® Analysis software (Applied Biosystems) as present (1) or absent (0).
Data analysis
The information content of microsatellite loci was estimated both by polymorphic information content (PIC), according to the formula PIC = 1 − Σ(p i2), where p i is the frequency of the i th allele detected in all individuals of the population (Nei, Reference Nei1973), and by power of discrimination (PD), according to the formula given above, but with allele frequency replaced by genotype frequency (Kloosterman et al., Reference Kloosterman, Budowle and Daselaar1993). The SSR data were scored for the presence or absence of each allele in all genotypes, and a similarity matrix was calculated using the Dice coefficient (Sneath and Sokal, 1973) through a server running the program DendroUPGMA (http://genomes.urv.es/UPGMA/) (Garcia-Vallvé et al., Reference Garcia-Vallvé, Palau and Romeu1999). One hundred bootstrap replications were generated to examine the robustness of data trends. A dendrogram was constructed using the unweighted pair-group method with arithmetic averages (UPGMA) algorithm and visualized with iTOL (Letunic and Bork, Reference Letunic and Bork2011). Maximum parsimony analysis was carried out using the same binary matrix. Bootstrap analyses (100 pseudoreplicates each) were performed using the DOLLOP program from the PHYLIP package (Felsenstein, Reference Felsenstein2004). As for resistance data, the diversity among genotypes was calculated by the Gower dissimilarity index (Gower, Reference Gower1971). Distances between genotypes were built by the UPGMA method using the dissimilarity indices. All data analyses were carried out using the R statistical software (r-project.org).
Results
The results of screening Solanum species for resistance traits are reported in Table 1. As for R. solanacearum, differences in wilting were generally evident at 9–12 d following inoculation, although for a few genotypes (e.g. Acl1B, Chc1B, Mlt1A), the first disease symptoms were already revealed after 6 d (not shown). As expected, none of the water-inoculated plants expressed disease symptoms. The species studied showed a highly variable response, ranging from resistant to susceptible reactions. We observed resistance variability not only between but also within species. In S. bulbocastanum, we found one susceptible and two resistant genotypes, and in S. commersonii Cmm1T resistant and Cmm6-6 susceptible genotypes. Out of the 21 genotypes tested, four had a WD ≤ 1 and were classified as resistant: Blb2C (WD = 0.0); PT29 (WD = 0.1); IVP35 (WD = 0.0); Cmm1T (WD = 0.0). The other genotypes generally displayed a highly susceptible response. The PCR results using R. solanacearum-specific primers are reported in Fig. 1(a). The expected fragment of 288 bp was present in the root and leaf DNA of all susceptible genotypes, providing evidence that bacterial populations developed in these tissues following artificial inoculation. By contrast, in the resistant genotypes, the 288 bp fragment was detected only in DNA from roots and not from leaves. As for PVYNTN resistance, viral infection, expressed in terms of mean absorbance (A 405 nm), ranged from 0.571 (Fen1B) to 0.013 (IVP35) (Table 1). Out of the 21 genotypes tested, five were classified as resistant: Blb1C (0.016); Cph1C (0.014); Chc1A (0.022); Etb3 (0.016); IVP35 (0.013). PT29 (0.116) was moderately resistant, whereas all the other genotypes were susceptible. Also in this case, intraspecific variability was observed. The use of molecular tools proved to be very useful to support the serological data. Indeed, RT-PCR analysis with the PVYc3 and PVYf specific primers always confirmed ELISA results, with the 440 bp fragment being present in the susceptible genotypes and absent in the resistant genotypes (Fig. 1(b)). As for resistance to low temperatures, strong differences were observed in terms of both non-acclimated and acclimated conditions (Table 1). The killing temperature of the tested genotypes ranged from − 1.1°C (Tar2B) to − 6.4°C (Cmm1T) in non-acclimated conditions, and from − 2.2°C (Cph2A and Tar2B) to − 8.9°C (again Cmm1T) after cold acclimation. According to the correlation analysis between the resistance traits, only the killing temperatures in non-acclimated and acclimated conditions were significantly correlated (r s= 0.56, P< 0.05).
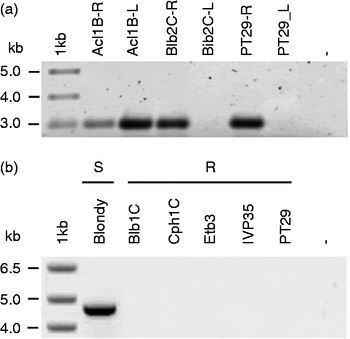
Fig. 1 Results of the molecular identification of (a) Ralstonia solanacearum and (b) PVYNTN contaminations in Solanum wild species. (a) Acl1B, Blb2C and PT29 genotypes were artificially inoculated with R. solanacearum (SA 93) r3 bv2, and total DNA from roots (R) and leaves (L) was amplified with the specific primer Y-2. (b) Total RNA from one susceptible (S, Blondy) and five resistant (R, Blb1C, Cph1C, Etb3, IVP35 and PT29) genotypes was extracted and amplified using the specific primers PVYc3/PVYf.
Twelve SSR markers were used to evaluate the genetic diversity of our potato genotypes. All SSRs were polymorphic and distributed on 11 (out of 12) potato chromosomes. In total, 12 loci and 46 alleles were identified across all genotypes, with an average value of 3.8 alleles per locus. The number of alleles per marker varied from two (primer pair STM1053) to eight (primer pairs STM5127 and STI0030) (Table 2). Major allele frequency varied from 0.20 (primer pair STI0030) to 0.84 (primer pair STM1053), with an average value of 0.49. Rare alleles (i.e. having a frequency < 0.1% as defined by Maccaferri et al. (Reference Maccaferri, Stefanelli, Rotondo, Tuberosa and Sanguineti2007)) were detected in Can1B at locus STM1052, in Etb3 at loci STM5127 and STM5114, in Cmm6-6 at locus STM5127, in Tar2B at locus STI0032 and in PT29 at locus STM1052. The average PIC for the 12 SSRs was 0.688, varying from 0.269 (primer pair STM1053) to 0.992 (primer pair STM1052). In terms of PD, values were very similar and varied between 0.946 and 0.949. SSR analysis with eight primers was also performed in the 22 S. tuberosum varieties. Eighty alleles were found, with an average PIC and expected heterozygosity (H e) values of 0.846 and 0.763, respectively (data not shown). The number of private alleles of each resistant genotype (i.e. alleles present in the resistant genotypes and lacking in the S. tuberosum varieties) varied considerably, ranging from 2 (IVP35 vs. ‘Bartina’, 15% SSR polymorph) to 12 (Acl1B vs. ‘Elvira’, 45% SSR polymorph) (Supplementary Table S1, available online only at http://journals.cambridge.org). Acl1B and Cph1C showed the highest average number of private alleles (9.1 and 9.2, respectively), and IVP35 the lowest (4.4). This latter result probably reflects the close phylogenetic relationship between S. tuberosum and S. phureja.
Table 2 Chromosome location, number of alleles, frequency of major alleles, polymorphic information content (PIC) value, observed heterozygosity (H o) and size range for 12 simple sequence repeat loci used in this study.

The UPGMA dendrogram derived from SSR analysis is reported in Fig. 2(a). The genetic distances varied from 0.25 (between IVP101 and Chc1A) to 0.97 (between the accessions of the same species: Acl1B and Acl1C; Blb2C and PT29; Sto1A and Sto1C), with an average value of 0.73 (data not shown). In several cases, accessions of the same species were grouped together, showing bootstrap values ranging from 54 (between Chc1A and Chc1B) to 90 (between Sto1A and Sto1C). In the same dendrogram, ‘Blondy’ showed an independent status. Besides the UPGMA analysis, maximum parsimony analysis was also carried out (Fig. 2(b)). While some groupings were confirmed, some others were shifted in the position. When phenotypic traits were used to create the dendrogram, a rather uninformative clustering pattern was observed (not shown).

Fig. 2 Dendrograms of the 22 Solanum genotypes calculated using (a) the UPGMA and (b) the maximum parsimony methods. Bootstrap values ≥ 50% from 100 replications are indicated above the nodes. For each Solanum genotype, the corresponding resistance traits are reported in parentheses. NACC, non-acclimated conditions; ACC, acclimated conditions; PVY, Potato virus Y; RS, Ralstonia solanacearum.
Discussion
Potato breeding is favoured by the abundance of related germplasm that can be exploited to transfer both genes of interest and allelic diversity. Knowledge of the genetic diversity available for breeding is important not only to choose the best parents but also to design proper crossing schemes, given that hybridization barriers may be present. In the light of this, in the current study, potato species have been studied to ascertain phenotypic and genotypic variability with regard to some important resistances and find useful parents for breeding. R. solanacearum and PVY are very important potato pathogens. The former is generally considered, after Phytophthora infestans, the most important at the global level. It is a vascular bacterium that invades the roots and causes wilting of the host plants. Out of five races, in potato, severe crop failures are caused by races 1 (in tropical and subtropical areas) and 3 (in cooler regions). The disease has been detected in Western Europe, where international plant quarantine regulations have been toughened to restrict its spread (Zimnoch-Guzowska et al., 2006). PVY, the type member of the genus Potyvirus, is transmitted by several potato colonizing and non-colonizing species of aphids in a non-persistent manner. The virus exists as a complex of variants and strains (Garcia-Arenal et al., Reference Garcia-Arenal, Fraile and Malpica2001). Some of them cause the potato tuber necrotic ringspot disease due to a tuber necrotic isolate (PVYNTN) of the tobacco veinal necrosis strain of PVYN (Singh et al., Reference Singh, Valkonen, Gray, Boonham, Jones, Kerlan and Schubert2008). Since chemical control is not effective, other preventive methods are difficult to apply and the level of resistance in cultivated varieties is low, the development of resistant genotypes is probably the best method to face these pathogens. Resistance to low temperatures is equally important given that temperatures below 0°C are often a major factor in reducing tuber yield, and that the cultivated potato is frost sensitive and unable to cold acclimate (Palta and Simon, Reference Palta, Simon, Li and Christersson1993). In this study, following artificial inoculations, four genotypes resistant to bacterial wilt (Blb2C, PT29, IVP35 and Cmm1T) and five to PVYNTN (Blb1C, Cph1C, Chc1A, Etb3 and IVP35) were identified. In terms of low-temperature stresses, resistance in non-acclimated conditions was detected in Cmm1T and, at a lower degree, in Acl1C. Following acclimation, Cmm1T, Cmm6-6, Etb3 and Mlt1A gave the best response. Although results should be confirmed under field conditions, some of them are in agreement with previous data reported on potato species (http://www.ars-grin.gov/npgs/index.html) and are supported by the molecular assays we employed. In addition, the screening methods used here have been previously used for potato germplasm evaluation and are very reproducible, allowing the detection of small differences among genotypes.
We observed resistance variability for each target trait not only between but also within species. This finding confirms that many potato species are heterogeneous gene pools and that a single accession may contain both susceptible and resistant genotypes. This is consistent with the high heterozygosity of outcrossing Solanum species as well as with the allelic and genetic diversity of single resistance loci (Mauricio et al., Reference Mauricio, Stahl, Korves, Tian, Kreitman and Bergelson2003) and R gene clusters (Caicedo and Schaal, Reference Caicedo and Schaal2004; Smith et al., Reference Smith, Pryor and Hulbert2004). Interestingly, some of the resistant genotypes also carry other noteworthy traits. Blb1C and Blb2C, for example, are resistant to late blight and moderately resistant to Globodera rostochiensis (Aversano et al., Reference Aversano, Ercolano, Frusciante, Monti, Bradeen, Cristinzio, Zoina, Greco, Vitale and Carputo2007), PT29 is resistant to late blight (Song et al., Reference Song, Bradeen, Naess, Raasch, Wielgus, Haberlach, Liu, Kuang, Austin-Phillips, Buell, Helgeson and Jiang2003) and Cmm1T is resistant to tuber soft rot (unpublished data). In our study, Cmm1T showed combined resistance to low temperatures and bacterial wilt, and IVP35 to PVYNTN and bacterial wilt. This is important, considering the significant impact of these stresses. The finding of useful sources of resistance is highly desirable in breeding programmes as relevant genes can be used as alternatives to already known sources of resistance and introgressed into commercial varieties in anticipation that pathogens may overcome the currently used resistance mechanisms. In this regard, the recently published genome sequence of S. phureja DM1-3 516 R44 genotype (Potato Genome Sequencing Consortium, 2011) offers an outstanding resource to access resistance genetic determinants in IVP35. Some diploid genotypes identified here (e.g. IVP35, Mlt1A) belong to the group of species cross-compatible with S. tuberosum haploids. Therefore, they can be employed in the so-called analytic breeding (Jansky, Reference Jansky2000). Other diploids (e.g. PT29, Cmm1T) are not directly crossable with S. tuberosum haploids. They should be used in breeding strategies based upon somatic hybridization or bridge crosses (Jansky, Reference Jansky2006). Of course, all resistant genotypes can be employed to clone resistant genes for transgenic approaches, as has already been done in S. bulbocastanum for late blight resistance and S. spegazzinii for nematode resistance (reviewed in Bradeen et al. (Reference Bradeen, Carputo, Douches, Kole and Hall2008)). Interestingly, we found two S. commersonii genotypes (Cmm1T and Cmm6-6) contrasting for resistance traits (e.g. low temperatures, bacterial wilt). They are ideal candidates for developing segregating populations useful to identify the genes involved in target traits and, consequently, to dissect the physiological mechanisms involved.
In the present study, 12 SSR markers were used to characterize the genetic diversity of 21 genotypes belonging to various potato species. Due to their hypervariable nature and extensive genome coverage, these markers offer several advantages to assess genetic variation at the molecular level (Kalia et al., Reference Kalia, Rai, Kalia, Singh and Dhawan2011). In addition, the 12 SSR markers assayed in this study belong to the robust and highly informative microsatellite-based genetic identity kit set up by Ghislain et al. (Reference Ghislain, Núñez, del Rosario Herrera, Pignataro, Guzman, Bonierbale and Spooner2009), and proposed as a reference for standardizing the potato germplasm analysis across laboratories. SSRs were also used to identify useful genomic tools for breeding programmes. The unique alleles found within each resistant genotype could be useful for negative assisted selection, i.e. choosing interspecific hybrids combining resistances with a low wild genome content. This is an important prerequisite for designing strategies of MAS aimed to enhance the efficiency of plant breeding by selecting against unfavourable alleles, and potentially shortening the development time of resistant varieties. In this perspective, the most interesting sources of genetic diversity are Acl1B, Acl1C, Cph1C and Cmm6-6 since they showed the highest number of private alleles. In terms of plant breeding, equally interesting are the rare alleles found in some genotypes. They may be used as diagnostic markers to identify small distinct genomic regions within breeding materials with low polymorphism (Maccaferri et al., Reference Maccaferri, Stefanelli, Rotondo, Tuberosa and Sanguineti2007). UPGMA and maximum parsimony-based analyses provided evidence that in each tree, resistant genotypes did not group together, highlighting the fact that genetically different resistant plant materials were identified. It can be hypothesized that the genetic bases of resistances in these genotypes are different, and therefore breeders may have the option to use different sources of genetic variability. This is important since some potato species may be more desirable than others in breeding programmes (Jansky, Reference Jansky2011). The clustering obtained by phenotypic data was not consistent with SSR clustering, suggesting that it probably measured a different aspect of genetic diversity. Similar results have been reported in wheat by Maccaferri et al. (Reference Maccaferri, Stefanelli, Rotondo, Tuberosa and Sanguineti2007), even with a much higher number of traits. The authors studied more than 40 phenotypic characteristics in durum wheat accessions and tried to correlate them with SSR and amplified fragment length polymorphism (AFLP) profiles. They found correspondence between morphological and molecular data only with highly related accessions, and concluded that phenotypic traits are not as informative as molecular markers in studying genetic relationships. A lack of an association between morpho-physiological and molecular data has also been reported in grapevine (Martinez et al., Reference Martinez, Cavagnaro, Masuelli and Rodríguez2003), pea (Tar'an et al., Reference Tar'an, Zhang, Warkentin, Tullu and Vandenberg2005), sorghum (Shehzad et al., Reference Shehzad, Okuizumi, Kawase and Okuno2009) and wheat (Dodig et al., Reference Dodig, Zorić, Kobiljski, Šurlan-Momirović and Quarrie2010).
In this study, sources of resistance to R. solanacearum, PVYNTN and low temperatures that can be employed as parents in breeding have been identified. Molecular analysis revealed that resistant genotypes were distributed among all SSR-based cluster groups, suggesting a different genetic basis for the resistances. Even though we have not found associations between SSRs and resistances, the identification of private and diagnostic markers will be useful as genomic tools to assist selection during breeding efforts. Research is currently underway to produce S. tuberosum-species hybrids through either sexual or somatic hybridization.
Acknowledgements
Contribution no. 280 from the Department of Soil, Plant, Environmental, and Animal Production Sciences. The authors thank A. Zoina and O. Sigillo for their help in R. solanacearum resistance screening, and Y. Wu for cladistic analysis. Part of this research was carried out within the project ‘Approcci – omici integrati per lo studio e l'utilizzazione della biodiversità di patata’ funded by the Italian Ministry of Agriculture.


