


1. Introduction
Understanding and predicting the structure and trajectories of tropical cyclones (TC) are, obviously, tasks of utmost practical importance. Due to complexity of the related phenomena, simplified models are traditionally used to gain an understanding of the fundamental dynamical properties of TC. The vertical structure of TC is the first to be simplified in such models. Let us mention in this context the pioneering papers by Ooyama (Reference Ooyama1964, Reference Ooyama1969) and Charney & Eliassen (Reference Charney and Eliassen1964) where two-layer models of the tropical atmosphere were introduced in order to describe TC. Such models continue to be used, e.g. Jones, Willoughby & Montgomery (Reference Jones, Willoughby and Montgomery2009). An even more drastic simplification of the vertical structure leads to purely two-dimensional (2-D), or quasi-2-D shallow-water-type models, which helped to understand the instabilities and changes of the horizontal structure of TC during their lifecycle. For example, 2-D Euler equations were used in Schubert et al. (Reference Schubert, Montgomery, Taft, Guinn, Fulton, Kossin and Edwards1999), Kossin & Schubert (Reference Kossin and Schubert2001) and Menelaou, Yau & Martinez (Reference Menelaou, Yau and Martinez2012) to explain the formation of so-called meso-vortices in the vicinity of the TC cores. Switching to shallow-water models (Hendricks et al. Reference Hendricks, Schubert, Chen, Kuo and Peng2014; Lahaye & Zeitlin Reference Lahaye and Zeitlin2016; Schubert, Slocum & Taft Reference Schubert, Slocum and Taft2016) allows us to include inertia–gravity waves and related radiative instabilities in the picture. Let us emphasize that instabilities of TC could be captured already in the adiabatic, ‘dry’ models (Schubert et al. Reference Schubert, Montgomery, Taft, Guinn, Fulton, Kossin and Edwards1999). However, as is well known, moist convection is an essential ingredient of the TC dynamics, see the review of Montgomery & Smith (Reference Montgomery and Smith2017). It can be included in shallow-water models in the simplest way as a sink in the mass equation, e.g. Schubert et al. (Reference Schubert, Slocum and Taft2016), following the seminal ideas of Matsuno (Reference Matsuno1966) and Gill (Reference Gill1982b). A more systematic, although following the same philosophy, method to include moisture, condensation, and related latent heat release was applied in the moist-convective rotating shallow-water (mcRSW) model, respectively, in one- and two-layer versions in Bouchut et al. (Reference Bouchut, Lambaerts, Lapeyre and Zeitlin2009) and Lambaerts et al. (Reference Lambaerts, Lapeyre, Zeitlin and Bouchut2011). The mcRSW models were recently applied to the analysis of instabilities of TC-like vortices in Lahaye & Zeitlin (Reference Lahaye and Zeitlin2016) and Rostami & Zeitlin (Reference Rostami and Zeitlin2018). It should be emphasized that instabilities of TC are usually studied in the  $f$-plane approximation, for the simple reason that, in order to conduct a standard stability analysis, one should start from a stationary state, which is not the case of monopolar vortices on the
  $\beta$-plane.
In the following, we continue the long tradition of shallow-water modelling of TC by using the mcRSW, which allows us to incorporate, in a minimalistic way, the dynamical effects of the moist convection, in particular the related enhancement of cyclonic vorticity. We also rely on the fact that including the topography in shallow-water models is easy and computationally friendly. We thus study the evolution and trajectories of the TC-like vortices over the ocean and their landfall in the  $\beta$-plane approximation with an idealized topography, centring the
  $\beta$-plane at a low latitude, and using crude parameterizations of condensation and evaporation, which are simplified as much as possible. We show that, surprisingly, already such a rudimentary version of the model captures well many of the observed, or simulated in ‘big’ models, characteristics of the behaviour of real-life TC. It also allows us to understand some of their basic dynamical properties, and to make rough predictions of trajectories. Needless to say that, by construction, the model obtained by vertical averaging is able to reproduce, in a coarse way, only the large-scale barotropic features of TC.
In addition to their tentative utility in the applications mentioned above, the results presented below reveal some previously unknown, or not sufficiently investigated, facts in the domain of vortex dynamics proper, such as instabilities and trajectories of localized vortices of high intensity on the  $\beta$-plane, or interactions of such vortices with the topography.
The paper is organized as follows. In § 2 we present the model, with short explanations, and discuss its hurricane-like vortex solutions, which are considered as proxies of TC throughout this study. In § 3 we present the results of the linear stability analysis of such vortices on the  $f$-plane, analyse how these instabilities are modified on the
  $\beta$-plane and study their influence, along with the moist convection, upon trajectories of the vortices. Section 4 is devoted to a study of interactions of TC-like vortices with idealized topography and coasts (landfall), both in adiabatic and moist-convective environments, and the influence of these interactions on their trajectories and intensities. Section 5 contains a summary of the results and conclusions.
2. The mcRSW model and hurricane-like vortices
2.1. The mcRSW model, a reminder
A systematic derivation from first principles of, respectively, one- and two-layer versions of the mcRSW model was given in Bouchut et al. (Reference Bouchut, Lambaerts, Lapeyre and Zeitlin2009) and Lambaerts et al. (Reference Lambaerts, Lapeyre, Zeitlin and Bouchut2011). Let us recall that the standard shallow-water model of the atmosphere can be obtained by vertical averaging of the hydrostatic primitive equations in the pseudo-height pressure coordinates, e.g. Zeitlin (Reference Zeitlin2018). Moist convection can be included in the model by adding a vertically integrated specific humidity with a condensation sink, which is then linked to convective fluxes of mass and momentum using Lagrangian conservation of the (linearized) equivalent potential temperature. For our purposes below the simplest one-layer version of the mcRSW model with the addition of a source of moisture representing evaporation, as described in Lahaye & Zeitlin (Reference Lahaye and Zeitlin2016) and Rostami & Zeitlin (Reference Rostami and Zeitlin2017), and an incorporated topography will be sufficient. No explicit dissipation of any kind is included in the model at this stage, see the explanations below. The equations of this version of the model are
 \begin{equation} \left.\begin{array}{c@{}} \partial_t {\boldsymbol{v}}+{\boldsymbol{v}}\boldsymbol{\cdot}\boldsymbol{\nabla}{\boldsymbol{v}}+ f(y) \hat{{\boldsymbol{z}}}\wedge {\boldsymbol{v}}=-g{{\boldsymbol{\nabla}}} h, \\ \partial_t h+\boldsymbol{\nabla} \, {\boldsymbol{\cdot}} \, \left[{\boldsymbol{v}} (h - b) \right]=-\gamma C, \\ \partial_t Q+\boldsymbol{\nabla} \, {\boldsymbol{\cdot}} \, (Q {\boldsymbol{v} })=-C + E. \end{array}\right\} \end{equation}
Here  $x$ and
  $y$ are the zonal and meridional coordinates on the tangent plane,
  ${\boldsymbol {\nabla }} = (\partial _x, \partial _y)$,
  $\boldsymbol {v} = (u, v)$,
  $u$ and
  $v$ are the zonal and meridional components of velocity, respectively,
  $h$ is geopotential height (thickness),
  $b(x,y)$ is the topography,
  $f(y)$ is the Coriolis parameter, which is constant
  $f = f_{0}$ in the
  $f$-plane approximation, and is equal to
  $f = f_{0} + \beta y$ in the
  $\beta$-plane approximation, and
  $\hat {{\boldsymbol {z}}}$ is the unit vertical vector;
  $Q {\geq 0}$ is specific humidity integrated over the air column,
  $\gamma$ is a parameter depending on the underlying stratification,
  $C$ is the condensation sink and
  $E$ is the surface evaporation source of moisture. They are parametrized as follows:
 \begin{equation} C = \frac{Q-Q^s}{\tau}\mathcal{H}(Q -Q^s), \quad E= \alpha { \frac{\vert \boldsymbol{v} \vert }{\vert \boldsymbol{v}_{max}\vert }} (Q^s - Q) \mathcal{H}(Q^s - Q). \end{equation}
Here,  $Q^s$ is a saturation threshold, which can be taken to be constant, as was the case in the early papers on mcRSW. Its dependence on pressure anomaly can be readily included, cf. Bouchut et al. (Reference Bouchut, Lambaerts, Lapeyre and Zeitlin2009), which we will do below. In principle, the evaporation threshold could be chosen to be different from
  $Q^s$, as the evaporation, physically, does not take place through the whole air column. We take it to be the same in the crudest variant of the model, in order to avoid the proliferation of free parameters. The formula for the condensation in (2.2a,b) is a column-averaged version of the standard Betts–Miller parameterization, which is used in general circulation models;
  $\tau$ is the relaxation time, which is of the order of several hours in the tropical atmosphere. The parameterization of evaporation in (2.2a,b) uses the standard bulk formula, cf. e.g. Katsaros (Reference Katsaros and Steele2001), which is of use in hurricane modelling (Cronin & Chavas Reference Cronin and Chavas2019), where we renormalized the transmission coefficient by
  $\vert \boldsymbol {v}_{max}\vert$, the maximum value of velocity over the domain, i.e. the maximum wind in the hurricane-like vortices we consider, to get the non-dimensional parameter
  $\alpha$ regulating the intensity of evaporation. This is a free parameter, the only one representing processes in the unresolved boundary layer in the present formulation of the model, its value in the simulations will be given below;
  $\mathcal {H}(\cdots )$ denotes the Heaviside (step-) function, which accounts for the switch character of condensation and evaporation. As is natural in the context of TC modelling, we consider the vortex motion mostly over the ocean, where
  $b \equiv 0$, and the bulk formula for evaporation (2.2a,b) is well adapted. In the regions where
  $b \neq 0$, which correspond to continental surfaces, the properties of evaporation change, and this parametrization should be changed. We just switch off the evaporation in such zones, as a first approach.
By setting  $\gamma =0,\ \alpha = 0$ and
  $\tau \rightarrow \infty$ which, physically speaking, means that the time scale of the dynamical processes in question is much less than
  $\tau$, we get the standard adiabatic (‘dry’) rotating shallow-water equations, with the addition of a passive scalar – the moisture field which decouples from other variables and is simply advected by the flow. Notice that in the simplest version of the model (2.1) the condensed water vapour just drops off the system. In this sense condensation and precipitation are synonymous. Precipitable water, precipitation and vaporization can be introduced into the model, following the same approach as for the inclusion of water vapour and condensation in (2.1), giving an ‘improved’ mcRSW (Rostami & Zeitlin Reference Rostami and Zeitlin2018), which we will not be using below, again, for simplicity.
A general analysis, with necessary benchmarks, of the fundamental properties of the system (2.1), and of the parent two-layer model, including the conservation laws and energy budget, can be found in the above-cited papers. We should only stress here that in the absence of evaporation the moist enthalpy  $m =h - b - \gamma Q$ is locally conserved, as can be easily seen by combining the second and the third equations in (2.1). The conservation of this quantity replaces the mass conservation in the ‘dry’ RSW model and, like
  $h$ in the latter case,
  $m$ should remain positive, otherwise the phase velocity of the ‘moist’ waves becomes imaginary, cf. Bouchut et al. (Reference Bouchut, Lambaerts, Lapeyre and Zeitlin2009). This imposes a constraint to be respected in numerical simulations. Another important for analysis and diagnostics quantity is potential vorticity (PV), which is a Lagrangian invariant of the ‘dry’ system in the absence of dissipation
 \begin{equation} (\partial_t +{\boldsymbol{v}}\boldsymbol{\cdot}\boldsymbol{\nabla}) q = 0,\quad q = \frac{\zeta + f(y)}{h-b}, \end{equation}
where  $\zeta = \partial _x v - \partial _y u$ is relative vorticity. In the presence of condensation, but without evaporation, it is the ‘moist’ PV
 \begin{equation} q_m = {\frac{\zeta + f(y)}{h - b - \gamma Q}}, \end{equation}
which is a Lagrangian invariant of the ‘moist’ system. In the presence of evaporation the moist PV is not conserved, as can be straightforwardly deduced from (2.1):
 \begin{equation} (\partial_t +{\boldsymbol{v}}\boldsymbol{\cdot}\boldsymbol{\nabla}) q_m = \gamma \frac{q_m}{h - b - \gamma Q} E. \end{equation}
The term on the right-hand side can be a source or a sink of PV, depending on the sign of  $q_m$. A dissipation, which is absent in (2.1), but which appears implicitly in numerical simulations due to various discretization procedures, also introduces a local source, or a local sink of the moist PV, depending on the properties of the underlying vorticity field. Numerical simulations with the set of (2.1) that we present below were performed using a second-order high-resolution well-balanced finite-volume scheme (Bouchut Reference Bouchut and Zeitlin2007) in a rectangular domain with sponges at the boundaries, which allows us to mostly evacuate fast inertia–gravity waves generated by various dynamical processes. No explicit dissipation has been added. As was shown in previous works with well-balanced finite-volume numerical schemes for shallow-water models, the numerical dissipation, globally, mimics the Newtonian one, being concentrated in the zones of high spatial gradients. The dependence of the saturation threshold on the pressure anomaly, which is proportional to
  $\eta = h - H_{0}$, where
  $H_{0}$ is the mean value, was taken in the form
  $Q^{s} = Q^{s}_{0}\, \textrm {e}^{- 0.3 \eta } \approx Q^{s}_{0} (1 - 0.3 \eta )$, cf. Bouchut et al. (Reference Bouchut, Lambaerts, Lapeyre and Zeitlin2009). The resolution and the domain size varied depending on the dynamical processes under investigation, see below. The values of parameters
  $\alpha$,
  $\gamma$, and
  $Q_{0}^{s}$ are ad hoc at this level, while the value of
  $\tau$ is taken to be several time steps of the code, to be consistent with its physical value, with the scaling we use below. However,
  $\gamma$ can be absorbed into
  $Q$, with simultaneous renormalization of
  $\tau$ and, hence, can be set to be one without loss of generality;
  $\alpha$ can be also absorbed in
  $Q$. With the fixed value of
  $\gamma$ we take it to be equal to
  $0.15$, to be consistent with previous simulations and benchmarks. We should say that this choice is consistent with the empirical value
  ${\sim }10^{-3}$ of the dimensional transmission coefficient in the bulk evaporation formula (Katsaros Reference Katsaros and Steele2001), which is also used in hurricane modelling (Cronin & Chavas Reference Cronin and Chavas2019), taking into account that vertical integration and renormalization by
  $\vert \boldsymbol {v}_{max}\vert$. In all simulations below the initial
  $Q$ was uniform, and close to the saturation value.
Let us comment on the property of the system of losing mass whenever the condensation is switched on, and the related loss of the ‘dry’ energy  $E_{d} = \int \textrm {d} x\,\textrm {d} y \left ( (h -b) ({\boldsymbol {v}^2}/{2}) + g ({h^2}/{2})\right )$ (Bouchut et al. Reference Bouchut, Lambaerts, Lapeyre and Zeitlin2009). This means that the system should be considered as a limit of an infinitely thick upper layer of a two- (or more) layer system, with standard mass and energy budgets (Lambaerts et al. Reference Lambaerts, Lapeyre, Zeitlin and Bouchut2011). As was already mentioned in Bouchut et al. (Reference Bouchut, Lambaerts, Lapeyre and Zeitlin2009), an obvious way to restore the mass conservation is radiative relaxation, which can be straightforwardly introduced in the present model, if necessary, as was done e.g. in Rostami, Zeitlin & Montabone (Reference Rostami, Zeitlin and Montabone2018). We, however, will refrain from doing this for two reasons, again to avoid a multiplication of adjustable parameters. The first reason is that de facto in the simulations presented below is the overall mass loss is less than a tenth of a per cent of the initial mass. Notice that the above-mentioned dependence of
  $Q^{s}$ on pressure anomaly prevents an excessive mass loss. The second is that the reasonable radiative relaxation time, taking into account that the model, by construction, applies to large-scale horizontal motions, would be a global climate relaxation scale of the order of couple months, e.g. Cronin & Emanuel (Reference Cronin and Emanuel2013) and references therein. Even if we consider the relaxation scale of an individual hurricane, which is estimated as 40–50 days, cf. e.g. Chavas & Emanuel (Reference Chavas and Emanuel2014), the typical time scales of dynamical processes we consider and the duration of the simulations presented below are of the order of days, so the influence of such relaxation on the results is quite limited, which we checked in sample simulations. As should be clear already from (2.2a,b), we purposely do not use any detailed parameterization of the boundary layer, although such parameterizations exist in shallow-water models (Schecter & Dunkerton Reference Schecter and Dunkerton2009). Along the same lines as evaporation, a bulk formula for the surface drag can be also straightforwardly incorporated in (2.1). We do not introduce it either for the reasons explained below. Finally, we should say that there is a way to improve the model by allowing for horizontal variations of the mean potential temperature, which gives the possibility of representing not only the convective mass flux but also the heating due to the latent heat release, as was proposed in Bouchut et al. (Reference Bouchut, Lambaerts, Lapeyre and Zeitlin2009) and recently realized in Liu, Kurganov & Zeitlin (Reference Liu, Kurganov and Zeitlin2020). We leave the use of such an ameliorated model for a future work.
2.2. Hurricane-like vortices in mcRSW
We first construct exact stationary-vortex solutions of the mcRSW equations in the  $f$-plane approximation. They will be later used as initial conditions for simulations on the
  $\beta$-plane. To this end, we rewrite the equations of the one-layer mcRSW on the
  $f$-plane in polar coordinates
  $(r, \theta )$:
 \begin{equation} \left.\begin{array}{c@{}} \displaystyle \dfrac{\textrm{d} \boldsymbol{v}}{\textrm{d} t}+ \left(f_0+\dfrac{v}{r}\right) \hat{{\boldsymbol{z}}} \wedge {\boldsymbol{v}} +g{\boldsymbol{\nabla} h} =0,\\ \displaystyle \partial_t h + \dfrac{1}{r} \left( \partial_r (r h u) + \partial_{\theta} (hv) \right) = - \gamma C, \\ \displaystyle \partial_t Q + \dfrac{1}{r} \left( \partial_r (r Q u) + \partial_{\theta} (Qv) \right) = - C + E, \end{array}\right\} \end{equation}
where  $\boldsymbol {v}=(u \boldsymbol {\hat {r}}, v \boldsymbol {\hat {\theta }})$ is the velocity in polar coordinates, and the Lagrangian derivative is
  ${\textrm {d}}/{\textrm {d} t} = {\partial }/{\partial t}+ u \partial _r + ({v}/{r}) \partial _{\theta }$.
The main observation is that, in the absence of evaporation, the axisymmetric azimuthal velocity  $v(r)$ and thickness
  $h(r)$ in cyclo-geostrophic equilibrium
 \begin{equation} \frac{v^2}{r} + f_{0} v = g \partial_r h, \end{equation}
at zero radial velocity  $u = 0$, and arbitrary constant or azimuthally symmetric
  $Q(r) \leq Q^s$ give an exact solution of (2.6). In a sense, such a solution is an RSW analogue of ‘dry’ tropical cyclones discussed in the literature, cf. Cronin & Chavas (Reference Cronin and Chavas2019) and references therein. In the presence of evaporation, in order to provide an exact solution,
  $Q$ should stay at the evaporation threshold, i.e.
  $Q = Q^s$, with the choice of the threshold made above. Staying at the evaporation threshold corresponds to the immediate relaxation limit, where the condensation
  $C = -Q^{s}\boldsymbol {\nabla } \, {\boldsymbol {\cdot }} \, {\boldsymbol {v}}$ (Bouchut et al. Reference Bouchut, Lambaerts, Lapeyre and Zeitlin2009). With
  $E = C$, and constant
  $Q^{s}$ the axisymmetric divergenceless configurations in this limit are, thus, exact solutions of (2.6).
Coming back to the discussion of extra terms in the mcRSW equations in § 2.1, we see that adding to the right-hand side of the thickness equation the global radiative relaxation term of the form  $-({(h - H_{0})}/{\tau _r})$ with a large, as explained above, relaxation time
  $\tau _{r}$, where
  $H_{0}$ is the non-perturbed thickness, would lead to a slow dissipation of the vortex, and of all of its perturbations, while a relaxation to an equilibrium profile verifying (2.7) does not affect the solution itself but will slowly damp the perturbations. Adding a bulk surface drug of a standard form
  $- K(\vert \boldsymbol {v} \vert ) \boldsymbol {v}$ to the right-hand side of the momentum equation would lead to a spindown of the vortex solution. In what follows we are interested in the long-time influence of the beta-effect and topography on the intense hurricane-like vortices, so to maintain their intensity, and mimic the real-life TC, we will not include these terms in the simulations below. Needless to say that the full thermodynamics of real-life TC cannot be captured in mcRSW, so the vortices we consider are dynamical proxies of these latter.
Realistic radial profiles of azimuthal velocity and pressure of TC-like vortices can be obtained by piecewise-constant, or smoothed piecewise-constant distributions of relative vorticity (Schubert et al. Reference Schubert, Montgomery, Taft, Guinn, Fulton, Kossin and Edwards1999; Nolan & Montgomery Reference Nolan and Montgomery2002; Hendricks et al. Reference Hendricks, Schubert, Chen, Kuo and Peng2014; Lahaye & Zeitlin Reference Lahaye and Zeitlin2016). For many purposes it is, however, convenient to have an analytic formula for the azimuthal velocity in terms of smooth functions. We use the following expression for the non-dimensional azimuthal velocity  $V(r)$ of the vortex as a function of non-dimensional radius
  $r$ from the centre, which we will call the ‘
 $abc$’ profile:
 \begin{equation} \bar{V}(r) = (r - r_0)^{a} \,\textrm{e}^{-c (r - r_0)^{b}},\quad r>r_0,\enspace a,b,c>0, \end{equation}
where  $a$,
$a$,  $b$,
$b$,  $c$ and
  $r_0$ are parameters for which we will use the two sets of values given in table 1. The profile (2.8) has been already used in our studies of planetary jets and vortices (Rostami, Zeitlin & Spiga Reference Rostami, Zeitlin and Spiga2017; Rostami et al. Reference Rostami, Zeitlin and Montabone2018). Corresponding non-dimensional radial profiles of azimuthal velocity and relative vorticity
  $\zeta (r)$ are given in figure 1, together with those of non-dimensional thickness anomalies recovered from (2.7). The profile in panels (a) and (b) of the figure has a wide region of small negative vorticity beyond the radius of maximum wind (RMW) while the profile in the lower panels has a steeper ascending branch before the RMW and a slower descending trend out of it, which is close to velocity profiles in the observations of TC (Mallen, Montgomery & Wang Reference Mallen, Montgomery and Wang2005), but leads to non-zero circulation far from the vortex. The results of numerical simulations initialized with these two profiles turn out to be similar. In order to have direct control of the amplitude of the velocity, we introduce its non-dimensional amplitude
  $\epsilon$ and renormalize
  $\bar {V}(r)$ as follows:
 \begin{equation} \bar{V}(r) \rightarrow{V}(r) = \epsilon \frac{\bar{V}(r)}{max \vert \bar{V}(r) \vert}. \end{equation}
As is clear from (2.8) the ‘ $abc$’ profile is placed at a distance
  $r_0$ from the origin. It is matched in the vicinity of
  $r_0$ with a linear velocity profile in the interval
  $[0, r_0]$, in a way to reproduce the observed approximately constant vorticity cores of TC, and to have overall continuous velocity and vorticity.

Figure 1. Profiles of thickness with indicated Chebyshev points which are used for discretization (a,c), and velocity and relative vorticity (b,d) of TC-like vortices in RSW. The most unstable mode of the velocity profile in the upper row ( $ID: D3$) has azimuthal wavenumber 2, and that of the lower row (
 $ID: Dbis3$) has azimuthal wavenumber 3.
Table 1. Parameters of the numerical experiments presented below.  $ID$, identification of the experiment;
  $MC$, moist-convective environment;
  $D$, adiabatic environment. Initial water vapour distribution is
  $Q^{s}-0.01$, where
  $Q^{s}=0.7$ is the saturated value. In all experiments
  $r_{0}=0.1$,
  $c = 14$,
  $\alpha =0.15$.

The velocity scale  $U = 200\ \textrm {m}\ \textrm {s}^{-1}$ and the horizontal scale
  $L = 400\ \textrm {km}$, which is typical for TC, are used for non-dimensionalization. The time scale is the vortex turnover time
  $T = L/U \approx 0.5\ \textrm {h}$. As already said, we are working in the tangent plane approximation. Being motivated by TC, we place our tangent plane at a low latitude,
  $15^{\circ } N$, which corresponds to
  $f_{0} = 3.7643\times 10^{-5}\ \textrm {s}^{-1}$. The non-dimensional
  $\bar {f}_{0} = {L f_0}/{U} \approx 7.5 \times 10^{-2}$, which is, in fact, the inverse global Rossby number (Ro) constructed from the scales given above. We, however, will be using another definition of the Rossby number:
  $Ro = {V_{max}}/{f_0 L_{max}}$, where
  $V_{max}$ is the maximum of azimuthal velocity (maximum wind), and
  $L_{max}$ is the radius of maximum wind (RMW) which is traditional in the TC literature, e.g. Lahaye & Zeitlin (Reference Lahaye and Zeitlin2016). All of the vortices in the experiments presented in table 1 have large Rossby numbers. We, however, will call below those with
  $Ro = (10.37, 14.5, 19.3)$ ‘strong’, and the other ones ‘weak’, bearing in mind the TC nomenclature. In the (quasi-) barotropic mcRSW model, we choose
  $H_{0} = 8.5\ \textrm {km}$ as the vertical scale.
With the above-described scaling the non-dimensional equation for the radial velocity in the  $f$-plane approximation, which follows after non-dimensionalization from (2.6), becomes
 \begin{equation} {-}\frac{\textrm{d} {u}}{\textrm{d} t} + \frac{v^2}{r} + \bar{f}_{0} v = \frac{\lambda}{Fr^2}\partial_r \eta. \end{equation}
We introduced here a non-dimensional amplitude  $\lambda$ of the thickness anomaly
  $h = H_0 (1 + \lambda \eta )$, where
  $H_0$ is the mean thickness, and the Froude number
  $Fr = {U}/{\sqrt {g H_0}}$. As in Lahaye & Zeitlin (Reference Lahaye and Zeitlin2016) we will be assuming in what follows that
  ${\lambda }/{Fr^2} \sim 1$. The cyclo-geostrophic equilibrium (2.7) between
  $V(r)$ and the corresponding thickness profile
  $H(r)$ in non-dimensional terms becomes
 \begin{equation} \frac{V^2}{r} + \bar{f}_{0} V = H'(r), \end{equation}
where the prime here and below denotes an ordinary derivative with respect to  $r$. The thickness profile for a given
  $V(r)$ is thus straightforwardly recovered from (2.11) by taking the primitive of the left-hand side. For the ‘
 $abc$’ profile, with
  $r_0=0$ we obtain
 \begin{align} H(r) &= 1-\bar{f}_{0}\frac{\epsilon}{b v_{max}}c^{-({(a+1)}/{b})} \varGamma\left(\frac{a+1}{b}\right)G\left(cr^{b},\frac{a+1}{b}\right) \nonumber\\ &\quad -\frac{\epsilon^{2}}{b v_{max}^{2}}(2c)^{-({2a}/{b})}\varGamma \left(\frac{2a}{b}\right)G\left(2cr^{b},\frac{2a}{b}\right), \end{align}
where  $v_{max}=max \vert \bar {V}(r) \vert$,
  $G(x,a)=[1/\varGamma (a)]\int _{x}^{\infty }t^{a-1}\,\textrm {e}^{-t}\,\textrm {d} t$ and
  $\varGamma$ denotes the gamma function.
3. Instabilities of hurricane-like vortices and their evolution along the trajectories on the  $\beta$-plane

We start our investigation of hurricane-like vortices by a linear stability analysis in the adiabatic environment of the vortex solutions on the  $f$-plane, which were described in § 2.2. We then study how these instabilities are modified on the
  $\beta$-plane and in the presence of moist convection, and how these effects influence the vortex trajectories.
3.1. Instabilities of ‘dry’ TC-like vortices in the $f$-plane approximation

Analysis of instabilities of the TC-like vortices below follows the lines of Lahaye & Zeitlin (Reference Lahaye and Zeitlin2016) and Rostami & Zeitlin (Reference Rostami and Zeitlin2017). By taking the ‘dry’ equations (2.6), i.e. switching off the condensation  $C$, linearizing them around the vortex solution (2.8), (2.11) and looking for solutions in the form of azimuthal normal modes
 \begin{equation} (u,v,\eta) = [\textrm{i}u_0(r), v_0(r), \eta_0(r)]\,{\rm e}^{i (l \theta - \omega t)} + \text{c.c.}, \end{equation}
we get the following eigenproblem for eigenvalues  $\omega$ and eigenvectors
  $[u_0(r), v_0(r), \eta _0(r)]$:
 \begin{equation} \omega\begin{pmatrix} u_0 \\ v_0 \\ h_0\end{pmatrix}=\begin{pmatrix} l{V}/r \quad (\bar{f}_0+2 {V}/r) \quad -D_n\\ V' + {V}/r+ \bar{f}_0 \quad l {V/r} \quad l/r\\ \dfrac{Fr^{-2}+(r {H})'}{r}+(Fr^{-2}+ {H}) D_n \quad \dfrac{Fr^{-2}+ {H}}{r}l \quad l {V}/r \end{pmatrix}\boldsymbol{\cdot}\begin{pmatrix} u_0 \\ v_0 \\ \eta_0 \end{pmatrix}, \end{equation}
where  $D_n$ is the operator of differentiation in
  $r$, which becomes a differentiation matrix after discretization using the Chebyshev collocation points (Wright Reference Wright1964), cf. figure 1. Its numerical solution is obtained with the help of the pseudo-spectral collocation method. As the gradient of the vorticity changes sign, cf. figure 1, we expect a barotropic instability, according to the standard criteria, i.e. complex eigenvalues
  $\omega = \omega _0 + \textrm {i}\sigma$, where
  $\sigma$ is the growth rate. By obvious reasons, we are mostly interested in the fastest-growing most unstable modes. The results of the numerical stability analysis are presented in figure 2, where the growth rates of the two most unstable azimuthal modes, as well as that of the mode
  $l=1$, which is important in the following, are plotted as functions of the parameter
  $\epsilon$ which controls
  $V_{max}$, cf. (2.9), for the two configurations of figure 1. We should emphasize that, as it was already stressed in Lahaye & Zeitlin (Reference Lahaye and Zeitlin2016), the instability is sensitive to the fine details of the vorticity profile. Thus, by increasing the slope of the ascending branch of velocity and vorticity in the vicinity of the core (figure 1c,d) the most unstable mode switches from
  $l=2$ to
  $l=3$. The structure of the unstable modes with
  $l=2$ and
  $l=3$ is presented in figure 3.

Figure 2. Growth rates of the azimuthal modes  $l = 1,2, 3$ as functions of the vortex intensity. Panels (a) and (b) correspond to the upper- and lower-row configurations presented in figure 1, respectively.

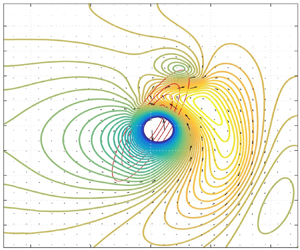
Figure 3. Spatial distribution of thickness (colours) and velocity (arrows) (a,c) and radial dependence of  $u,v,\eta$ (b,d), with the critical radii indicated by the vertical lines, of the most unstable mode
  $l=2$ of the vortex corresponding to
  $ID: D3$, and of the most unstable mode
  $l=3$ corresponding to
  $ID: Dbis3$.
More details on the stability analysis of TC-like configurations in the framework of mcRSW model, including the dependence of the most unstable mode on the RMW can be found in Rostami & Zeitlin (Reference Rostami and Zeitlin2018). Let us, however, emphasize, that the results above are obtained in the vertically averaged model with the crudest parametrization of condensation and evaporation. Studies of instabilities of hurricanes in the framework of full three-dimensional primitive equations and in cloud-resolving models, with detailed representation of three-dimensional hurricane structure and thermodynamics of the moist air can be found in Schecter & Montgomery (Reference Schecter and Montgomery2007) and Schecter (Reference Schecter2018), respectively.
It is known that the nonlinear evolution of the instability in the  $f$-plane approximation leads to homogenization of the vorticity in the centre of TC-like vortices, and the vorticity's intensification, (Schubert et al. Reference Schubert, Montgomery, Taft, Guinn, Fulton, Kossin and Edwards1999; Kossin & Schubert Reference Kossin and Schubert2001; Rozoff et al. Reference Rozoff, Kossin, Schubert and Mulero2009; Hendricks et al. Reference Hendricks, Schubert, Chen, Kuo and Peng2014; Lahaye & Zeitlin Reference Lahaye and Zeitlin2016). This process corresponds to the evolution and different states of TC cores which were found in observations (Mallen et al. Reference Mallen, Montgomery and Wang2005). We do not investigate here such evolution on the
  $f$-plane, as in the above-mentioned studies, and pass directly to the
  $\beta$-plane configuration.
3.2. Instabilities of TC-like vortices on the $\beta$-plane, and the influence of beta-gyres

The evolution of intrinsic instabilities of hurricane-like vortices on the  $\beta$-plane cannot be dissociated from a well and long-time known phenomenon due to the
  $\beta$-effect: development of the so-called beta-gyres (Reznik & Dewar Reference Reznik and Dewar1994; Sutyrin & Flierl Reference Sutyrin and Flierl1994) resulting from the Rossby-wave emission by the vortex. Corrections to the process of formation and the characteristics of the beta-gyres, initially described in quasi-geostrophic models, were studied in much detail in the full RSW model in Reznik & Grimshaw (Reference Reznik and Grimshaw2001), although in the small Rossby number regime. Due to this phenomenon, the cyclonic vortices start moving in the north-west direction in the Northern hemisphere (the so-called beta-drift). The influence of the beta-effect upon the trajectories and internal structure of TC-like vortices was studied in the barotropic non-divergent model (i.e. 2-D Navier–Stokes equation on the
  $\beta$-plane) by Chan & Williams (Reference Chan and Williams1987) and Fiorino & Elsberry (Reference Fiorino and Elsberry1989), and in the shallow-water model by Willoughby (Reference Willoughby1994).
Compared to the previous studies, we have at our disposal a much more reliable and higher-resolution simulation tool, and the possibility of including the important effects of moist convection. We performed a number of numerical experiments on the propagation of TC-like vortices on the  $\beta$-plane in the Northern hemisphere, and development of instabilities, in the ‘dry’ and moist-convective configurations displayed in table 1. A summary of the results, some of which we present below, is that the intense vortices are propelled north-westward by the beta-gyres, the structure of which is sensitive to the strength of vortices, and to the presence, or absence, of moist convection. The meridional displacement increases with vortex intensity, and north westward drifting strong vortices veer eventually eastward, while at equal intensity the influence of the effects of moisture upon the drift is relatively weak. At the same time, the asymmetry enhanced by the beta-gyres triggers instabilities which develop in the core, leading to formation of secondary ‘eyewall meso-vortices’, which are well documented in the observations of TC, e.g. Kossin, McNoldy & Schubert (Reference Kossin, McNoldy and Schubert2002). The formation and properties of the meso-vortices are mostly sensitive to the details of the vorticity profile and the strength of the parent vortex, and are less sensitive to the effects of moisture. During nonlinear evolution, the ring of high PV in the vortices with higher
  $Ro$ breaks down faster than in those with lower
  $Ro$. The eyewall meso-vortices generated by this process can then wander inside the eye, and eventually merge.
We present in figure 4 a comparison of evolution scenarios of weak and strong hurricane-like vortices in the moist-convective environment on the  $\beta$-plane with
  $ID$
$ID$ $MC1, MC3$, respectively. The vortex profile in both cases corresponds to figure 1(a,b) with the most unstable mode
  $l=2$, although for the weaker vortex the growth rates of modes
  $l = 2$ and
  $l = 3$ are close, cf. figure 2. In contrast with the studies of the evolution of vortex instabilities on the
  $f$-plane (Lahaye & Zeitlin Reference Lahaye and Zeitlin2016; Rostami & Zeitlin Reference Rostami and Zeitlin2017), the simulations were not initialized with a perturbation corresponding to the most unstable mode, the instability having been triggered by the asymmetry introduced by the beta-gyres. As follows from the figure, the beta-drift is stronger for the stronger vortex (see also below), the instability of the core is stronger as well, and the secondary eyewall meso-vortices are more pronounced. Their structure at initial stages clearly reflects the dominant
  $l=2$ instability of the stronger vortex, and a mixture of
  $l=2$ and
  $l = 3$ instabilities of the weaker vortex, in agreement with the linear stability analysis of § 3.1. However, the
  $l=1$ mode, whose growth rate was negligible on the
  $f$-plane, cf. figure 2, exhibits a considerable growth due to the influence of the beta-gyres, as follows from figure 5. The mechanism of intensification in the core region is clear from figure 4: it is due to the merger of meso-vortices.The evolution of weak and strong vortices in the adiabatic (‘dry’) environment is qualitatively similar to that of figure 4 (not shown).

Figure 4. Comparison of the evolution of weak ( $ID: MC1$, a,c,e,g), and strong (
 $ID: MC3$, b,d,f,h) hurricane-like vortices on the
  $\beta$-plane in moist-convective environment, as seen in the potential vorticity field. Snapshots at
  $t=40, 55, 80, 100[L/U]$, from top to bottom.

Figure 5. Logarithm of the normalized amplitude of the  $l=1$ component of the azimuthal velocity field calculated in the domain
  $r< 0.5$ as a function of time during the evolution of the weak (a,
  $ID: D1, MC1$) and strong (b,
  $ID: D3, MC3$) hurricane-type vortices in ‘dry’ (solid) and moist-convective (dashed) environment. Vorticity profiles correspond to figure 1(a,b).
An important question is about the role of moisture in the evolution of the intensity of the hurricane-type vortices, cf. Lahaye & Zeitlin (Reference Lahaye and Zeitlin2016). A comparison of the evolution of the peak PV in adiabatic and moist-convective environments is presented in figure 6. For the weak vortex, the peak ‘dry’ PV is quasi-monotonously decreasing, after a transient growth due to redistribution of PV produced by discretization errors, and related readjustment process. However, this decrease is attenuated by the effects of moisture. For the strong vortex the PV evolution exhibits a period of strong growth associated with the appearance of pronounced meso-vortices (figure 4d), and a second period of growth associated with their merger (figure 4f), the latter one being significantly enhanced by the moist convection. The non-conservation of the peak PV is due to numerical dissipation, and to the moist convection, if present, but it is rather limited, as the overall change of the peak PV is  $\approx$7 % for the weak, and
  $\approx$10 % for the strong vortex. We thus confirm the result previously obtained in the
  $f$-plane approximation (Lahaye & Zeitlin Reference Lahaye and Zeitlin2016): the evolution of the vortex core instability leads to intensification, and that moist convection substantially enhances this process. The modification of the instability pattern on the
  $\beta$-plane due to the growing
  $l=1$ mode apparently does not change the overall scenario of intensification.

Figure 6. Comparison of the evolution of the maximum of potential vorticity of weak ( $ID: MC1$a), and strong (
 $ID: MC3$b) hurricane-like vortices on the
  $\beta$-plane in the moist-convective (dashed) versus ‘dry’ (solid) environments.
The structure of the beta-gyres differs for strong and weak (in the sense explained in § 2.2 above) vortices, as follows from figure 7, where their evolution is presented in the moist-convective case, the pattern in the ‘dry’ case being very close. At the initial stages the beta-gyres arise and slowly intensify. The anticyclonic gyre is formed to the north-east and the cyclonic one to the south-west with respect to the vortex core. The centres of the gyres then start to slowly rotate clockwise. Although the individual structure of the beta-gyres is sensitive to initial velocity and vorticity profiles, our results on the initial formation and evolution of the gyres are in global agreement with previous shallow-water modelling of TCs, e.g. Li & Wang (Reference Li and Wang1994), and also with observational data analyses e.g. Kim, Kwon & Elsberry (Reference Kim, Kwon and Elsberry2009). As time goes on, a Rossby-wave tail develops in the south-eastern sector with respect to the core of the vortex. Initially, the flow between the main vortex and the major gyre is north-westward, but as the gyres rotate this flow turns northward.

Figure 7. Formation of (nonlinear) beta-gyres during the evolution of the weak (a,  $ID: MC1$), and strong (b,
  $ID: MC3$) hurricane-type vortices in moist-convective environment, as seen in the thickness field beyond the radius of maximum wind.
Condensation is inherent to the evolution of vortices in the moist-convective environment (Lahaye & Zeitlin Reference Lahaye and Zeitlin2015; Rostami & Zeitlin Reference Rostami and Zeitlin2017). While it is mostly axisymmetric for TC-like vortices in the  $f$-plane approximation (Lahaye & Zeitlin Reference Lahaye and Zeitlin2015), this is not the case on the
  $\beta$-plane. We found that the time-averaged condensation pattern is clearly asymmetric with respect to the vortex centre, as follows from figure 8. At the same time, the water vapour distribution roughly follows the beta-gyre structure. As is clear from the figure, the rear-right sector, following the vortex motion, is a zone of the highest condensation, while the front-left sector is the zone of the lowest condensation. This result strongly resembles observations of convection in TCs over the western Pacific during the period from 2005 to 2012 (Yang et al. Reference Yang, Fei, Huang, Cheng, Yang, Ding and Shi2016).

Figure 8. Asymmetric distribution of time-averaged condensation for two hurricane-like vortices with different Rossby numbers.  $ID: MCbis1$ (a) and
  $ID: MCbis3$ (b).
3.3. Trajectories of hurricane-like vortices on the $\beta$-plane and inertia gravity wave emission

The above-mentioned north-western drift of cyclonic vortices due to the beta-gyres is robust, and can be established already for the point vortices on the  $\beta$-plane (Reznik Reference Reznik1992). In shallow water the drift velocity of low Rossby number vortices experiences periodic modulations (Reznik & Grimshaw Reference Reznik and Grimshaw2001). As shown above, we do observe a pronounced beta-drift of the hurricane-type vortices. Trajectories of vortices of different intensity in adiabatic and moist-convective environments are displayed in figure 9. The drift velocity in our simulations is not uniform, as can be inferred from figure 9, where the points are plotted at equal time intervals – for example, vortices slow down while turning north – but the drift velocity's variations are not periodic, as in Reznik & Grimshaw (Reference Reznik and Grimshaw2001), which is, apparently, due to the largely different Rossby numbers.

Figure 9. Trajectories of hurricane-like vortices with different Rossby numbers in dry (D) and moist-convective (MC) environments, as defined in table 1. Time span is from  $0$ to
  $315$, in the interval
  $15$
$15$ $[L/U]$.
What is important is that we see a clear-cut difference between the behaviour of vortices of moderate and strong intensities. While the former follow the trajectories predicted in the literature in the no background flow case, e.g. Adem (Reference Adem1956), McWilliams & Flierl (Reference McWilliams and Flierl1979), Chan & Williams (Reference Chan and Williams1987) and Reznik (Reference Reznik1992), with the moist convection not substantially affecting the trajectory, and ‘moist’ meridional velocity being lower than the ‘dry’ one, the latter behave differently. Their trajectories are almost straight for a long time, with meridional velocities much higher than for moderate-intensity vortices, and ‘moist’ meridional velocities higher than the ‘dry’ ones. Remarkably, the trajectories of intense vortices turn north, and then north-east at late stages, a behaviour which is usually attributed in the observations of TC to the influence of the mean wind, although there is none in the present simulations. In order to understand the dynamical processes at the origin of these north-east turns we present in figure 10 the outer structure of an intense vortex at the stage when it starts turning northward. As follows from the figure, the main anticyclonic lobe of the associated beta-gyre exhibits intensification and significant clockwise displacement. As a result, the axis of the dipole which it forms with the main vortex turns north-eastwards, which explains the change in the direction of propagation. The rate of this rotation of the lobe is higher in the ‘dry’ case, which is consistent with the behaviour of respective trajectories in figure 9. The evolution of the pressure field in the moist-convective environment is significantly affected by condensation accompanied by emission of the inertia–gravity waves (IGW), which explains this difference. Both condensation and IGW emission are displayed in figure 10(c,d). As follows from figure 11, where we diagnosed the associated wave activity, the outward-propagating IGW originating in the vortex core are amplified with increasing  $Ro$ in the moist-convective environment. The above-described formation, wandering and merger of meso-vortices during the nonlinear evolution of intense TC-like vortices are at the origin of the peaks of the wave activity.

Figure 10. Snapshots of the isobars beyond the radius of maximum wind for the strongest vortex ( $Ro=19.3$) of figure 9 in the ‘dry’ (a,
  $ID: Dbis4$) and moist-convective cases (b,
  $ID: MCbis4$). (c) Spatial distribution of condensation corresponding to the (b). (d) Corresponding to the (b) convection-coupled inertial gravity waves, as seen in the divergence field. Colour bar is saturated in the core region.
  $T= 255, 270, 285, 300\,L/U$.

Figure 11. Wave activity measured as the modulus of divergence integrated over the region beyond the radius of maximum wind during the evolution of TC-like vortices with different Rossby numbers in dry and moist-convective environments.  $Ro= 14.5$ (a,
  $ID: Dbis3, MCbis3$),
  $Ro= 19.3$ (b,
  $ID: Dbis4, MCbis4$), respectively.
3.4. Summary and preliminary conclusions
Before including the orographic effects in the next section, let us briefly summarize the above-described results of the simulations of the lifecycle of hurricane-like vortices on the  $\beta$-plane. The vortex instabilities, which are identified in the
  $f$-plane approximation, are triggered by the inhomogeneity due to the beta-effect. Their development leads to formation of the meso-vortices, which subsequently merge and lead to intensification of the vortex at its core. The larger the Rossby number of the vortex, the more pronounced are the meso-vortices, and related processes. At the same time, according to the known mechanism, beta-gyres are developed in the vicinity of the vortex. They lead to the north-western beta-drift, which is substantially different for vortices of moderate and strong intensity. In the latter case, nonlinear evolution and the related change of orientation of the beta-gyres lead to a change of orientation of the trajectory, which eventually veers north-eastward. The characteristic vortex-dynamics events described above (formation and merger of meso-vortices, change of orientation of the beta-gyres) are accompanied by related bursts of inertia–gravity wave emissions by the vortex.
4. Interactions of hurricane-like vortices with idealized ridges and islands
4.1. Preliminaries
Changes in structure and intensity of TC travelling over the ocean and encountering coasts (landfall) are of obvious high importance, and there exists an extensive literature on this subject. On the other hand, interactions of vortices with topography is a recurrent subject in the oceanographic literature as well. Most of the theoretical advances in our understanding of vortex evolution in the presence of topography were achieved using the barotropic non-divergent model (called the long-wave approximation in oceanography (Gill Reference Gill1982a)), which in the context of shallow-water modelling, neglects the deformation of the free surface. A common approach is based on the asymptotic analysis of the equation of conservation of PV in this model at small times, for initially axisymmetric vortex configurations. It was initiated by Adem (Reference Adem1956), and then extended and developed by many others, e.g. Smith & Ulrich (Reference Smith and Ulrich1990), Grimshaw et al. (Reference Grimshaw, Broutman, He and Sun1994) and Richardson (Reference Richardson2000). There also exist numerical simulations using the same model with simple topography profiles on the  $f$-plane, e.g. Grimshaw et al. (Reference Grimshaw, Broutman, He and Sun1994), Richardson (Reference Richardson2000) and Hinds, Johnson & McDonald (Reference Hinds, Johnson and McDonald2016), and on the
  $\beta$-plane (van Geffen & Davies Reference van Geffen and Davies1999), as well as laboratory experiments in rotating tanks (Carnevale, Kloosterziel & van Heijst Reference Carnevale, Kloosterziel and van Heijst1991; Flor & Eames Reference Flor and Eames2002). As can be inferred from these studies, e.g. Grimshaw et al. (Reference Grimshaw, Broutman, He and Sun1994) and Richardson (Reference Richardson2000), a monopolar cyclonic vortex in the
  $f$-plane approximation tends to go first across, and then along the topography isolines. At the same time, the vortex perturbation generates topographic waves starting to propagate along the topography isolines (Grimshaw et al. Reference Grimshaw, Broutman, He and Sun1994). The details of the vortex behaviour depend on the parameters of the topography (slope and height), and on the intensity of the vortex. On the
  $\beta$-plane the situation is more complex because of the simultaneous influence of the beta- and topographic gyres developing around the vortex, and analysis of PV conservation becomes more involved. Yet it helps to interpret the results of numerical simulations, e.g. Zehnder (Reference Zehnder1993) where numerical experiments with a shallow-water model on the equatorial
  $\beta$-plane were performed, together with a qualitative theoretical analysis.
Compared to the existing literature on this subject, we have the advantage of being able to use a state-of-the-art high-resolution well-balanced numerical scheme, allowing us to represent with high fidelity both the effects of vortex stretching due to deformations of the free surface, and the inertia–gravity and topographic waves, and also to incorporate the effects of moisture, and to study their influence.
4.2. Interactions of hurricane-like vortices with idealized mountain ridges
We start our study of the effects of topography by analysing the interaction of, first, weak and, second, strong vortices, in the sense of § 2.2 with a straight infinite meridional and zonal bumps (idealized mountain ridges). Low ( $b_{max}=0.1$) and high (
 $b_{max}=0.2$), in units of
  $H_{0}$, bumps of Gaussian shape were implemented.
4.2.1. Weak TC-like vortex
In figure 12 we present a comparison of the trajectories of a weak TC-like vortex encountering a low zonal bump in adiabatic and moist-convective environments, and the corresponding evolution of its peak relative vorticity. The recurving of the trajectories observed in the figure is correlated with formation of the topographic gyres discussed in the above-cited literature. They are clearly seen in figure 13(a,b), where we present the evolution of relative vorticity, and can be anticipated from the conservation of PV. The recurving and rightward shift start earlier in the moist-convective environment. This is due to the fact that it is the moist enthalpy  $h - b - \gamma Q$ which replaces the thickness
  $h - b$ in the expression of the conserved (in the absence of dissipation and evaporation) potential vorticity, cf. (2.4), which means that the effective topography is higher in the moist-convective case. The evolution of the peak vorticity is similar in the two cases, although the peak vorticity in the moist-convective environment is higher, starting from the encounter of the vortex with the ridge, and this difference is increasing in time, cf. figure 12(b). This is due to the condensation in the vortex core during the crossing, which is clearly seen in figure 13(c), as condensation enhances the cyclonic vorticity. The minimum of the peak vorticity at later times, observed in both curves in figure 12(b) corresponds to the passage by the TC of the topography maximum, and can be easily explained in terms of PV conservation: diminishing the denominator in the PV (2.3a,b) should be compensated by diminishing the numerator, i.e. diminishing the relative vorticity, and vice versa. A similar form of trajectory, and of the peak vorticity evolution, was reported in van Geffen & Davies (Reference van Geffen and Davies1999), where numerical simulations of monopolar vortex interacting with ridges of various orientations were performed in the framework of the ‘dry’ non-divergent model. Notice that the overall initial depletion of the relative vorticity is due to the meridional propagation which increases the planetary vorticity
  $f_0 + \beta y$ in the Northern hemisphere which, again, as follows from the PV conservation, should be compensated by a decrease in relative vorticity, at constant thickness. The lag of this minimum in the moist-convective case is explained by the faster propagation speed in the dry case, which can be inferred from figure 12(a). Increasing the height of the ridge leads to a slowdown of the weak vortex over the ridge, and to a backward motion in the case of meridional ridge, as follows from figure 14. We will come back to this phenomenon in the next subsection, and concentrate first on the topographic gyre formation, and its interaction with the primary vortex and its beta-gyre, which is illustrated by figure 15. The figure displays a rich vortex dynamics pattern with several distinguished features. A cyclonic topographic gyre arises by the process of enhancement of the second (cyclonic) lobe of the beta gyre when the TC approaches the ridge. It then intensifies. The topographic gyre forms an asymmetric dipole with the rear part of the first anticyclonic lobe of the beta-gyre, with a tendency of moving backward from the ridge along its axis and hence, by conservation of momentum, pushing the main vortex in the opposite direction, which can explain the initial acceleration of the vortex over the ridge observed in figure 14(a) (larger distance between the consecutive dots). Recurving of the trajectory is due to the deformation and stretching of the anticyclonic vorticity surrounding the core, together with that of the near field of the beta-gyre, which leads to reorientation of the axis of the vortex dipole which it forms with the main vortex, and hence a change in the direction of propagation. Stalling of the vortex at the lee side of the ridge, which is seen at later stages in the same figure is due to formation of a tripolar structure, involving the remnants of the main anticyclonic lobe of the beta-gyre, the main vortex, and a secondary anticyclonic topographic gyre, which arises downslope and westward of the main vortex. Notice the vorticity pattern appearing to the right of the main vortex structure. It is related to the topographic wave, which is coupled to the cyclonic topographic gyre, and leads to the alignment of the latter along the ridge at the later stages – see also below.

Figure 12. Comparison of the tracks of a weak (ID: D1, MC1) TC-like vortex (a) over a Gaussian ridge with  $b_{max}=0.1$, and related evolution of the peak relative vorticity (b) in ‘dry’ (white dots, solid) and moist-convective (black dots, dashed) environments. Time span from
  $0$ to
  $495$, the interval between consecutive dots is
  $15$
$15$ $[L/U]$.

Figure 13. (a) Spatio-temporal evolution of the relative vorticity during the passage of a weak TC-like vortex ( $ID: MC1$) over a zonal Gaussian ridge with
  $b_{max}=0.1$ at
  $y=3$. (b) Corresponding evolution of
  $h$. (c) Corresponding evolution of condensation. Horizontal dotted lines indicate the ridge.
  $T=350$ corresponds to the minimum of the relative vorticity in figure 12.

Figure 14. Trajectories of a weak TC-like vortex ( $ID: D1$) (white dots indicating peak vorticity) passing over a zonal (a) and a meridional (b) ridges with
  $b_{max} = 0.2$ in ‘dry’ environment. Time span is
  $[0, 270]$ and time interval between consecutive dots is
  $15\,L/U$.

Figure 15. Interaction of a weak TC-like vortex ( $ID: D1$) in the ‘dry’ environment with a zonal Gaussian ridge with
  $b_{max} =0.2$, as seen in the relative vorticity field (colours). Isolines of relative vorticity are zoomed out of the vortex core. Solid red lines: isolines of
  $b$.
$b$.
4.2.2. Strong TC-like vortex
Figure 16 represents a counterpart of figure 12 for a strong TC-like vortex passing over the ridge with  $b_{max}=0.2$. The trajectories in both ‘dry’ and moist-convective environments are looping downslope, leading to trapping of the vortex by topography. As follows from figure 17, where we present the corresponding evolution of relative vorticity in the ‘dry’ case, a cyclonic topographic gyre also arises, and forms a dipole with the tail of the anticyclonic beta-gyre lobe, as in the case of the weak TC-like vortex above, with a similar acceleration effect, cf. figure 16. The recurving of trajectory at the lee side of topography, and subsequent looping are similar to the weak vortex case, and are due to a secondary anticyclonic topographic gyre, arising and merging with the remnants of the primary beta-gyre and forming a vortex pair with the main vortex and its anticyclonic vorticity ring, with a clockwise-rotating axis. Contrary to the weak vortex case, no clear tripolar structure is observed, and the cyclonic topographic gyre is not aligned with the vorticity field of the topographic wave (see below).

Figure 16. Comparison of the tracks of a strong TC-like vortex ( $ID: D3, MC3$), (a), and evolutions of the related peak relative vorticity (b) over the Gaussian ridge with
  $b_{max}=0.2$ in ‘dry’ (white dots, solid line) and moist-convective (black dots, dashed lines) environments. Time span is from
  $0$ to
  $465$, and the interval between the dots is
  $15$
$15$ $[L/U]$.

Figure 17. Evolution of relative vorticity of a strong TC-like vortex ( $ID: D3$) passing over a zonal Gaussian ridge with
  $b_{max} =0.2$ (white dots in figure 16). Isolines of relative vorticity are zoomed over out of the core areas.
We should emphasize that in simulations of van Geffen & Davies (Reference van Geffen and Davies1999) the vortex was always crossing the ridge, even a twice higher one, with respect to the non-perturbed depth, compared to our set-up, and continued to move in the north-west direction, although its trajectory was recurving over the bump. Although a direct comparison is not straightforward, as the simulations in van Geffen & Davies (Reference van Geffen and Davies1999) were done with the non-divergent model on the equatorial  $\beta$-plane with
  $f_0 \equiv 0$, and the vorticity profile and intensity of the vortex were different, this discrepancy emphasizes the role of divergence effects and related vortex stretching, which are absent in the non-divergent model.
The evolution of moisture and condensation during the passage of a strong TC over a zonal ridge is presented in figure 18. The condensation pattern is similar to that of figure 13, but its intensity at the locations of primary and secondary vortices is much higher. As follows from the figure, the first condensation pattern develops upwind and downslope, but then a second pattern moving along the ridge appears. It is related to a topographic wave.The influence of the moisture upon the trajectory can be inferred from figure 16. As follows from the Figure, the trajectories in the ‘dry’ and moist-convective simulations are qualitatively similar. As in the previous case of weak TC-like vortex, and by the same reason, the trajectory in the moist-convective environment starts the rightward shift earlier. The looping is explained similarly, although there is a difference of curvatures of ‘dry’ and ‘moist-convective’ trajectories. In view of the ‘dry’ evolution, with its stronger curvature, the variations of  $Q$, and related condensation (cf. figure 18) apparently contribute to the flattening of the trajectory when the vortex exits the ridge. It should be not forgotten that effective topography is higher in the moist-convective environment, as already explained. The curves of the evolution of peak relative vorticity presented in figure 16(b) show a quasi-identical behaviour, apart from the fact that the peak vorticity in the ‘moist-convective’ case is higher during the periods when zones of condensation are present, as it should be, as condensation enhances the cyclonic vorticity. The consecutive minima of the peak vorticity starting at
  $T = 235$ correspond to the repetitive passages by the TC of the topography maximum, and, again, can be straightforwardly explained in terms of PV conservation. The fact that high topography can trap intense cyclones arriving at incidence angles close to
  $90^\circ$ is quite remarkable. We will come back to this phenomenon in the next section.

Figure 18. (a) Evolution of initially uniform moisture during a passage of a strong TC-like vortex ( $ID: MC3$) over a zonal ridge with maximum
  $b_{max} =0.2$ at
  $y=3$. (b) Corresponding evolution of the condensation. Horizontal dotted lines indicate the position of the ridge.
  $T=235$ corresponds to the first minimum of the relative vorticity in figure 16.
As follows already from figure 18(a), the passage of TC-like vortices over the ridge produces pronounced convergence zones, as it is only convergence or divergence of the velocity field which can redistribute the initially uniform moisture. The corresponding evolution of the divergence field is presented in figure 19(a), together with its counterpart for the meridional bump (figure 19b). As follows from the figure, a large-scale topographic wave is generated during the encounter of the vortex with the ridge, and starts propagating along the ridge. The divergence anomaly due to this wave is at the origin of zonally propagating along the ridge patterns of humidity anomaly and condensation. As is clear from the previous discussion, the topographic wave also influences the dynamics of the vortex system over the ridge in the case of the weak TC-like vortex.

Figure 19. Isolines of divergence (colors) produced by a strong vortex ( $ID: MC3$) passing over a zonal (a) and a meridional (b) ridges with
  $b_{max} = 0.2$ in moist-convective environment. Small-amplitude signal corresponding to weak inertia–gravity waves produced during the encounter, and propagating radially out of the ridge, are filtered out.
4.3. Interaction of TC-like vortices with an idealized Taiwan-like island
The Taiwanese island, of a roughly elliptic form, with high mountains, is often stricken by Western Pacific typhoons having a horizontal scale comparable to the scale of the island. This is why observational and theoretical studies of interactions of TC with such islands are recurrent in the literature, e.g. Chang, Yeh & Chen (Reference Chang, Yeh and Chen1993), Yeh & Elsberry (Reference Yeh and Elsberry1993a,Reference Yeh and Elsberryb), Kuo et al. (Reference Kuo, Williams, Chen and Chen2001), Tang & Chan (Reference Tang and Chan2015), Wu, Li & Huang (Reference Wu, Li and Huang2015), Tang & Chan (Reference Tang and Chan2016), Huang et al. (Reference Huang, Chen, Chen and Nolan2016) and Lin, Chen & Liu (Reference Lin, Chen and Liu2016). The observed TC tracks exhibit a variety of patterns with both northward and southward deflections. They may be continuous or discontinuous, and can be accompanied by formation of secondary lows (Chang et al. Reference Chang, Yeh and Chen1993; Yeh & Elsberry Reference Yeh and Elsberry1993b; Kuo et al. Reference Kuo, Williams, Chen and Chen2001). The process of deflection includes many environmental factors and is very complicated, as stressed by Kuo et al. (Reference Kuo, Williams, Chen and Chen2001). Many of the modelling studies (Yeh & Elsberry Reference Yeh and Elsberry1993a; Wu et al. Reference Wu, Li and Huang2015; Huang et al. Reference Huang, Chen, Chen and Nolan2016; Lin et al. Reference Lin, Chen and Liu2016) use the simplistic  $f$-plane approximation, with a meridionally oriented island and an imposed easterly mean zonal wind which pushes the cyclone towards the island. An accent was made on fully developed parameterizations of convection and micro-physics, while the hydrodynamical set-up remained over-simplified in recent works. The simulations of the TC trajectories near Taiwan on the
  $\beta$-plane with WRF model were performed in Tang & Chan (Reference Tang and Chan2015, Reference Tang and Chan2016). As is clear from this short review, most of the modelling in this context was performed with simplified models and the seminal study by Kuo et al. (Reference Kuo, Williams, Chen and Chen2001) used the ‘dry’ shallow-water model.
In order to understand the role of hydrodynamic processes modified by crudely parameterized convection, we undertook a similar study in the mcRSW on the  $\beta$-plane. We recall that Kuo et al. (Reference Kuo, Williams, Chen and Chen2001) demonstrated a possibility of full or partial trapping of the cyclone by the island. We can hereby extend such study by including together the beta-effect, the topography and the moist convection.
To represent an idealized Taiwan-like island we implemented a topography in the form of a bump of elliptic shape with a Gaussian cross-section, with the main axis oriented from south-west to north-east. The elevation of the bump was chosen to be smooth, in order to prevent formation of hydraulic jumps and wave breaking, with the maximal non-dimensional height  $b_{max} = 0.2$. As is known from the above-cited literature, deflection during the approach and (partial) trapping by topography are the main features of the TC trajectories near the island. In order to check these effects in the mcRSW we initialized the TC-like vortices in the vicinity of the island, in a way that their trajectories, which were determined in the experiments of § 3.3, cross the location of the island. The initial moisture field was uniform, and close to saturation, as before. The numerical experiments were performed both with weak and strong TC, at different incidence angles with respect to the major axis of the island, and different incidence locations. Variations of the incidence angle were achieved by varying the orientation of the major axis of the elliptic bump, as we were using pre-calculated trajectories for initialization. The results on the track deflection of weak and strong TC-like vortices with RMW of the order of the transverse size of the island, and trajectories initially approximately perpendicular to this axis are presented in figure 20. As follows from the figure, both weak and strong TC-like vortices are partially trapped, and start moving along the clockwise path around the island, which is in agreement with some of the observed typhoon tracks across Taiwan, with the simulations of Kuo et al. (Reference Kuo, Williams, Chen and Chen2001), and also with the results of the § 4.2.2 above. The mechanism of recurving of trajectories due to the interactions of primary vortex, its beta-gyre, and topographic gyres was described in the previous section, and remains qualitatively the same. Its main ingredient is the primary cyclonic topographic gyre, which is clearly identified in figure 21, where we present the evolution of thickness during the landfall of strong and weak TC-like vortices. As is known from the observations, a secondary vortex can be formed at the lee side when a TC approaches the island, e.g. Yeh & Elsberry (Reference Yeh and Elsberry1993a,Reference Yeh and Elsberryb). As follows from figure 21 the secondary low is indeed generated at the northern side of the island during the passage of TC. After full intensification it detaches but its subsequent evolution depends on the incidence location and angle, see below. Such post-landfall phenomenon was documented, for example, in the observational study of the typhoon Mindulle (Lee, Liu & Chien Reference Lee, Liu and Chien2008).One of the practically important characteristics of the TC landfall on the island is an amount of precipitation and its evolution in time. Accumulated amount, and spatio-temporal evolution of condensation produced by the landfall of TC-like vortices in the middle of the island, at incidence angle
  ${\approx }90^{\circ }$ are presented in figure 22. It should be not forgotten that condensation and precipitation are synonymous in the simplest version of the model we are using.

Figure 20. (a) Comparison of trajectories of a weak TC-like vortex with  $Ro =3.57, ID: MC1$ in the moist-convective environment in the presence (black circles), and in the absence (white circles) of the ‘Taiwan’ island with
  $b_{max}=0.2$ (red isolines). Time interval between subsequent circles is
  $15$
$15$ $[L/U]$. (b) Same as in (a), but for a strong TC-like vortex
  $(Ro=10.37, ID: MC3)$.

Figure 21. (a,b) Selected isobars of a weak TC-like vortex ( $ID: MC1$) at
  $T=210$ in the presence (absence) of the Taiwan-like island. (c,d) Same as in (a,b), but for the strong TC-like vortex (
 $ID: MC3$).

Figure 22. Spatial distribution of the accumulated condensation during the passage of strong TC-like vortex ( $ID: MC3$, time span from
  $20$ to
  $270 [L/U]$, (a)), and weak TC-like vortex (
 $ID: MC1$, time span from
  $20$ to
  $500[L/U]$, (b)) over idealized Taiwan island. (c) Spatially integrated condensation corresponding to the aforementioned cases: (
 $ID: MC1$, solid, and
  $ID: MC3$, dashed).
A panorama of the evolution of all essential fields during an encounter of a TC-like vortex with the northern part of the idealized Taiwan island at a smaller incidence angle is presented in figure 23. Typical convergence and related condensation patterns are seen at the south-western and north-eastern parts of the island. Deformation of the beta-gyres because of the topographic influence is clearly seen, as well as formation of a secondary low at the northern tip of the island.The later stages of this landfall are presented in figure 24, which continues figure 23, and exhibits a rather complicated vortex system comprising the primary vortex, the main anticyclonic beta-gyre, which intensifies and becomes a rather intense localized anticyclonic vortex, and the topographic gyre, which gives rise to a secondary cyclone. Overall, the vortex system evolution scenario is similar to the one observed for the straight infinite ridge, cf. figure 15, although the terminating topography introduces important new features. Thus, the topographic gyre detaches from the island, and together with the primary vortex and its anticyclonic beta-gyre forms a three-vortex system moving out of the island. At the same time, a secondary cyclonic topographic gyre develops and intensifies at the lee side of the island, as follows from figure 24. We should stress that the peak vorticity of the main vortex is smaller than that of the detaching topographic gyre during some period of time. A documented in the literature process of a secondary low developing and replacing the original centre for TC (Yeh & Elsberry Reference Yeh and Elsberry1993b; Lin et al. Reference Lin, Han, Hamilton and Huang1999; Wu Reference Wu2001), as well as disruption of trajectories of the observed TC during the landfall, e.g. Kuo et al. (Reference Kuo, Williams, Chen and Chen2001), could be explained by a process of this kind, as already in our simple model we see a swap of the maximum vorticity between the primary and the secondary cyclones. The corresponding trajectory of the primary vortex, the related evolution of its peak vorticity, together with the peak anticyclonic vorticity, and comparison of the peak vorticities of the primary and secondary cyclones are displayed in figure 25. As follows from the comparison of figure 25(a), and figure 20, trajectories of TC-like vortices are very sensitive to the landfall location and incidence angle. The evolution of the anticyclonic vorticity in figure 25(b) clearly shows the emergence of the secondary anticyclone, and subsequent re-intensification of the primary cyclone, while figure 25(c) displays a swap of the maximum of vorticity between the primary and the secondary cyclones. It is worth noticing that our results in the case described in figures 23–25 are similar to those obtained with the far more exhaustive WRF model, and also with observational studies (Yeh et al. Reference Yeh, Hsiao, Chen and Huang2012; Tang & Chan Reference Tang and Chan2016).

Figure 23. Spatio-temporal evolution of divergence, condensation, relative vorticity, and selected isobars of a weak TC-like vortex ( $ID: MC1$) passing over the northern part of idealized Taiwan-like island (red contours), respectively, from (a–d).

Figure 24. Late stages of the evolution of relative vorticity (a) and PV (b) of the landfall of weak TC-like vortex ( $ID: MC1$) continuing figure 23.

Figure 25. (a) Trajectory of a TC-like vortex hitting the northern part of the Taiwan island with  $b_{max}=0.2$ (red contours) in the moist-convective environment (black circles) compared to that without topography. Time interval between the circles is
  $15$
$15$ $[L/U]$. (b) Corresponding evolution of the anticyclonic (dashed) and cyclonic (solid) peak relative vorticities. (c) Swap of the maximum of vorticity between the primary vortex (solid), and the secondary (dashed) terrain-induced cyclone.
4.4. Summary of the results on TC-like vortices interacting with topography
The main feature of trajectories of TC-like vortices over the meridional and zonal ridges is their recurving, which can lead to looping and trapping. This behaviour is due to a rather complex vortex dynamics involving the primary vortex, its beta-gyre, which is deformed and stretched during the passage over the ridge, and of the primary cyclonic and secondary anticyclonic topographic gyres, with an influence of the topographic wave generated during this process. The condensation induced by the passage of TC-like vortices over the ridges enhances the cyclonic vorticity and displays a specific pattern, which is correlated with topographic waves generated during the interaction of the vortex with topography, and propagating along the ridge.
The above-described features also manifest themselves when topography represents an elongated island. Although the recurving and partial trapping are also observed, the terminating topography leads to appearance of ‘free’ secondary vortices, arising from the beta-gyres interacting with topography. These vortices can have higher peak vorticity that the original vortex, which can explain seemingly paradoxical disruptions of TC tracks over Taiwan reported in the literature. The scenarios of the landfall strongly depend on the angle of incidence and its location at the island. We should add that many of the detected in this part of the study features are also observed in ‘dry’ simulations with the same topography, which we do not present. Yet, the moist convection boosts secondary cyclones, and makes their influence more pronounced.
5. Summary and discussion
We have, thus, shown that the mcRSW model produces evolution and trajectories of TC-like vortices, which are qualitatively and quantitatively close, within the limits of the model, to the observations of TC and the results of studies with much more sophisticated models. The main advantage of the model is simple and computationally friendly incorporation of crudely parametrized moist convection, and of arbitrary topography. The simplicity of the model, and the robustness of modern finite-volume numerical schemes, allows for long-time high-resolution simulations, and hence for efficient tracking of the intense cyclonic vortices in different environments. We thus, have shown that TC-like vortices in the Northern hemisphere experience the north-western beta-drift, which is significantly influenced by moist-convective phenomena in the case of strong vortices. Our main discovery in this direction is that, in the absence of the mean wind, the strong cyclones are travelling much farther North than their weak counterparts, and experience, after some time, a north-eastern turn, with a northward displacement being more pronounced in the presence of the moist convection. Such turns are reported in the observations of TC, but are usually attributed to the influence of the mean wind. We have also shown that the intrinsic instabilities of the intense hurricane-type vortices, which were previously identified in the  $f$-plane approximation, are triggered by the beta-effect, and evolve on the
  $\beta$-plane as well, although with asymmetric distortions due to the presence of the beta-gyres. They lead to formation of secondary eyewall meso-vortices which, in turn, evolve, merge, and lead to intensification of the vorticity in the vortex core. Meso-vortices are recurrently reported in the observations of TC. The moist convection enhances the effect of intensification, while the instability mode with azimuthal wavenumber one, which appears due to the beta-effect, does not qualitatively change the evolution of the main instability and the dynamics of meso-vortices. We have demonstrated that the evolution of TC-like vortices leads to enhanced inertia gravity wave activity in the moist-convective environment, the peaks in the wave activity being correlated with different stages of the evolution of the meso-vortices. Concerning the condensation, we found a distinct asymmetry in the aggregate condensation between north-western and south-eastern sectors with respect to the vortex centre, again, in accordance with observations of TC.
Using the advantage of easy and numerically friendly incorporation of topography in the shallow-water model, we analysed the passage of TC-like vortices over a ridge-like and mountain island like topographies and demonstrated trapping of the cyclones by topography, accompanied by generation of topographic waves, which influence the condensation/precipitation patterns. The character of the trapping (full or partial) depends both on the intensity of the cyclones and on the characteristics of topography. Our simulations reveal rich patterns of vortex dynamics, involving the primary vortex, the main anticyclonic lobe of its beta-gyre and the topographic cyclonic gyres, which determine the trajectory and the evolution of the intense vortices. In the context of deflection of the TC tracks over the mountain Taiwan-like island, we observed several scenarios, from deflection to trapping, depending on the strength of the cyclone, incidence angle and landfall location. We found, again, complex scenarios of vortex dynamics of the primary cyclone, a secondary cyclone arising from the topographic gyre, and an anticyclone produced by the beta-gyre, with swaps of the maximum of vorticity between the primary and the secondary cyclones. Such scenarios can shed light on the observed disruptions of the TC trajectories.
On the basis of the present study we can conclude that the mcRSW model is able to capture some of essential dynamical features of TC and allows for semi-quantitative predictions of trajectories and intensities of TC at low computational cost. In particular, our investigation of interactions of TC-like vortices with topography reveals complex dynamical patterns and high sensitivity of the observed scenarios to various parameters, although the number of these latter is massively reduced as compared to ‘big’ models. This shows, on the one hand, an intrinsic difficulty and complexity of the landfall forecasts but, on the other hand, a utility of simple models, because while a thorough analysis of landfall scenarios with mcRSW is affordable, this is hardly the case of ‘big’ models.
It is important to emphasize that the model can be further improved by including precipitable water in a liquid phase, together with vaporization, and its baroclinic two-layer version is also available (Rostami & Zeitlin Reference Rostami and Zeitlin2018). Radiative cooling and surface drag can be straightforwardly incorporated, as well, ensuring more realism. However, already the present results, obtained in the most simple version, clearly demonstrate the potential of the model.
Let us finally stress that, independently of tentative utility for TC-related applications of the results in the moist-convective environment, their ‘dry’ counterparts presented above contribute to better understanding of the dynamics of intense vortices, by providing new, and sometimes unexpected, information on their behaviour on the  $\beta$-plane and their interactions with topography, like, for example north-eastern deflection of trajectories, and swaps of vorticity maxima between primary and secondary vortices over the island.
Acknowledgements
This work was supported by the French National Program LEFE-MANU, and the German Research Foundation within the framework of the CRC 806 (project ID 57444011).
Declaration of interests
The authors report no conflict of interest.


