Exposure to early life stress (ELS), including its most severe forms, is alarmingly prevalent. In the United States alone, over 7 million children were reported to child welfare agencies for suspected maltreatment in 2015 (Child Welfare Information Gateway, 2017). Data from the 2011 National Survey of Children's Exposure to Violence (Finkelhor, Turner, Shattuck, & Hamby, Reference Finkelhor, Turner, Shattuck and Hamby2013) indicate that two in five children age 1 month to 17 years were physically assaulted in the previous year. Further, ELS has been linked to many of the leading causes of death (Felitti et al., Reference Felitti, Anda, Nordenberg, Williamson, Spitz, Edwards and Marks1998) and may be involved in over 40% of all childhood-onset psychiatric disorders (Green et al., Reference Green, Mclaughlin, Berglund, Gruber, Sampson, Zaslavsky and Kessler2010). To elucidate the mechanisms that link ELS to these problematic health outcomes, investigators have begun to identify neurobiological markers of ELS in childhood and adolescence, including alterations in regions of the brain involved in responding to stress. Specifically, both the hippocampus and the amygdala contain high densities of glucocorticoid receptors, have protracted periods of development, and have been identified in translational animal studies as being vulnerable to early adversity (for a review, see Lupien, McEwen, Gunnar, & Heim, Reference Lupien, McEwen, Gunnar and Heim2009; Teicher & Samson, Reference Teicher and Samson2016). Consequently, these limbic structures have been the focus of studies examining the impact of ELS on neurodevelopment. Despite emerging evidence of the adverse effects of ELS on the morphology of these “stress-sensitive” brain regions in children and adolescents, our understanding of the impact of ELS is incomplete. Specifically, we know little about how specific constellations of ELS experiences may lead to distinct neurobiological alterations in childhood and adolescence (Zeanah & Sonuga-Barke, Reference Zeanah and Sonuga-Barke2016), a lack of clarity that we posit is due in large part to difficulties with the conceptualization and measurement of ELS.
Most research examining the neurobiological impact of ELS has taken one of two approaches to the assessment of childhood stressors. In one approach, researchers have used an extreme-groups design, in which they examine children categorized by the presence or absence of a single, usually severe, form of ELS. For example, investigators using this approach have identified reduced left hippocampal volume in previously institutionalized adolescents compared to their never institutionalized peers (Hodel et al., Reference Hodel, Hunt, Cowell, van den Heuvel, Gunnar and Thomas2015), and greater bilateral amygdala volume in children who were exposed to maternal depressive symptomatology since birth compared to children who were not (Lupien et al., Reference Lupien, Parent, Evans, Tremblay, Zelazo, Corbo and Seguin2011). Another common approach to assess ELS draws on the concept of cumulative risk, in which a score representing the total number of stressors or the sum of severity ratings for stressors is a linear predictor of outcomes. For example, researchers using the cumulative risk approach have identified smaller bilateral hippocampal and left amygdala volumes in children who were exposed to greater cumulative ELS (Hanson et al., Reference Hanson, Nacewicz, Sutterer, Cayo, Schaefer, Rudolph and Davidson2015). While studies using the extreme-groups and cumulative risk approaches have provided valuable information concerning the vulnerability of children exposed to the most extreme stressors or to repeated stress (Evans, Li, & Whipple, Reference Evans, Li and Whipple2013), there are limitations of both models. Theorists have recently highlighted the need to conduct research that moves beyond these models to examine specificity of the impact of different types of ELS (McLaughlin & Sheridan, Reference McLaughlin and Sheridan2016; Zeanah & Sonuga-Barke, Reference Zeanah and Sonuga-Barke2016).
The limitations of prevailing models of ELS have recently been documented by investigators urging researchers to assess ELS in a manner that delineates specifically how an experience deviates from an expectable environment (Humphreys & Zeanah, Reference Humphreys and Zeanah2015; Sheridan & McLaughlin, Reference Sheridan and McLaughlin2014). These theorists posit that different forms of ELS have unique effects on neurodevelopment. An extreme-groups approach cannot determine whether outcomes are unique to the measured stressor or are associated with severe stress of any type; similarly, the cumulative risk approach precludes investigation of the effects of particular forms of ELS. In addition, despite the advantages of measuring different dimensions of ELS separately (e.g., neglect vs. abuse), these models are limited by the fact that children's environments cannot be experimentally controlled. Because different forms of ELS co-occur (Dong, Anda, & Felitti, Reference Dong, Anda and Felitti2004; Vachon, Krueger, Rogosch, & Cicchetti, Reference Vachon, Krueger, Rogosch and Cicchetti2015), models that account for the interrelations among multiple forms of ELS may more accurately characterize variations in children's real-life experiences.
A person-centered approach to assessing ELS does not have the limitations of the extreme-group and cumulative risk approaches. Both of those “variable-centered” approaches assume a homogeneous population in which the associations among variables hold across all individuals. In contrast, person-centered models assume a heterogeneous population that can be disaggregated into unique subgroups of individuals (von Eye, Reference von Eye2010). In the context of ELS, person-centered models account for heterogeneity in children's experiences by distinguishing among groups of children exposed to particular forms of ELS while allowing for their known interrelations (von Eye, Reference von Eye2010).
One specific type of person-centered approach, latent class analysis (LCA), is gaining recognition among child and adolescent psychologists (Lanza & Cooper, Reference Lanza and Cooper2016). As Collins and Lanza (Reference Collins and Lanza2010) note, LCA provides “an organizing principle for a complex array of empirical categorical data” (p. 8), and is thus well suited to measure a range of possible life experiences. LCA identifies and describes latent classes (i.e., subgroups), which are measured indirectly by observed categorical indicator variables (e.g., types of ELS), yielding two sets of parameters: class membership probabilities (i.e., the proportion of children in each class) and conditional response probabilities (i.e., the probabilities of exposure to each type of ELS given membership in each class; Lanza & Cooper, Reference Lanza and Cooper2016). These parameters are used to characterize constellations of ELS experiences. Previous studies using LCA have examined associations of ELS class membership with mental and behavioral health problems (Ballard et al., Reference Ballard, Van Eck, Musci, Hart, Storr, Breslau and Wilcox2015; Hagan, Sulik, & Lieberman, Reference Hagan, Sulik and Lieberman2016; McChesney, Adamson, & Shevlin, Reference McChesney, Adamson and Shevlin2015). Although these researchers generally found that classes differ in level of cumulative risk, particular forms of co-occurring ELS also distinguish these subgroups and have effects independent of cumulative risk. For example, in a sample of young, high-risk children, Hagan et al. (Reference Hagan, Sulik and Lieberman2016) found that membership in a group distinguished by exposure to the combination of direct victimization and family violence was associated with the highest internalizing and posttraumatic stress symptoms, and that this association was not explained by cumulative risk.
We had two goals in conducting the present study. First, we used LCA to develop a person-centered model of ELS in a community sample of early adolescents. We identified unique constellations of exposure across a broad range of experiences of ELS, including traumas (e.g., physical abuse) and less extreme, more prevalent stressors that may co-occur with traumas (e.g., parental divorce). We also improved on prior studies by using a multi-informant procedure for measuring exposure to ELS. Infantile amnesia affects individuals’ ability to report accurately on events occurring in very early life; similarly, parents may be unaware of, or unwilling to, report on their child's experiences. Therefore, integrating multiple reports provides a more complete characterization of children's experiences.
The second goal of the present study was to test the utility of a person-centered approach for identifying alterations in stress-sensitive brain regions associated with constellations of ELS. Specifically, we examined the relations between LCA-defined classes of ELS and hippocampal and amygdala volume. Because this goal depended on the results of the LCA conducted to develop a person-centered model of ELS, we did not generate hypotheses regarding the specific effects of class membership. Nonetheless, based on previous research and theory concerning the impact of ELS on neurodevelopment (Sheridan & McLaughlin, Reference Sheridan and McLaughlin2014; Teicher & Samson, Reference Teicher and Samson2016), we expected that exposure to highly threatening experiences, such as abuse, would be associated with reduced hippocampal volume; because findings concerning the effects of specific forms of ELS on amygdala volume are mixed (Hanson et al., Reference Hanson, Nacewicz, Sutterer, Cayo, Schaefer, Rudolph and Davidson2015; Hodel et al., Reference Hodel, Hunt, Cowell, van den Heuvel, Gunnar and Thomas2015; Tottenham et al., Reference Tottenham, Hare, Quinn, McCarry, Nurse, Gilhooly and Casey2010), we made no prediction.
Method
Participants
We recruited 218 early adolescents and their parents from the community to participate in a longitudinal study of the psychobiological effects of ELS across the transition through puberty (Humphreys, Kircanski, Colich, & Gotlib, Reference Humphreys, Kircanski, Colich and Gotlib2016; King et al., Reference King, Colich, LeMoult, Humphreys, Ordaz, Price and Gotlib2017). Data reported in this manuscript are those collected at the baseline (Time 1) assessment of this study. Following recruitment, 4 participants were excluded from the final sample (2 withdrew, 1 had a medical illness, and 1 did not respond after initial contact). In addition, for the current analyses, both adolescents and their parents were required to complete assessments of child ELS exposure at the initial study visit. Three adolescents were not included in the analyses because their parents did not complete assessments. Thus, 211 adolescents (58% female; 9–13 years, M = 11.36, SD = 1.04) comprised the final sample for the current study. For each adolescent, one parent who accompanied the participant to the laboratory completed the assessment of child ELS exposure. Of the participating parents, 200 (95%) were the adolescents’ mothers, 10 were their fathers (5%), and 1 was their grandmother (<1%).
We recruited participants using media and online advertisements posted in local communities around Stanford University. Criteria for exclusion from the study included factors that would preclude a magnetic resonance imaging (MRI) scan (e.g., metal implants or braces), as well as a history of major neurological or medical illness, severe learning disabilities, and, for females, the onset of menses. Inclusion criteria were that adolescents were ages 9–13 years and were proficient in spoken English. This age range was selected in order to recruit children in earlier puberty at the baseline assessment of the longitudinal study. In recruiting participants, we matched males and females on pubertal stage as measured by the self-report Tanner Staging questionnaire (Morris & Udry, Reference Morris and Udry1980).
Detailed descriptive statistics for the study sample are presented in Table 1. Adolescents were in Tanner stages 1–4. Household yearly income ranged from <$5,000 to ≥$150,000. Based on having an income-to-needs ratio <1, 31% of children in the sample were low income. Parent education level ranged from no GED/high school diploma to professional/doctorate degree, with 69% of parents having at least a 4-year college degree. Adolescents were racially and ethnically diverse, with 38% self-reporting as White/Caucasian.
Table 1. Descriptive statistics across classes of early life stress

Notes: N = 211 children; M(SD for unadjusted means/SE for adjusted means) or %; sex coded female = 1, male = 0; ICV, intracranial volume; unadjusted hippocampus/amygdala, raw bilateral volume (mean of left and right hemispheres); adjusted hippocampus/amygdala, bilateral volume adjusted for ICV, age, and hemisphere. aIncome-to-needs ratio, parent-reported household income / Santa Clara county low income limit for the number of people in household. Values <1 indicate low income status. bχ2 with minority status (White/Caucasian or minority).
Procedure
The Stanford University Institutional Review Board approved the protocol for this study. In an initial telephone call, research staff provided information about the protocol to families and screened participants for inclusion/exclusion criteria. We then invited eligible families to attend a laboratory session during which staff obtained consent from parents and assent from adolescents. In this session, both parents and children completed interview and questionnaire measures about the adolescent and family. Adolescents completed the MRI scan at a follow-up session that occurred approximately 2 weeks (M = 2.25, SD = 1.15) following the initial laboratory visit.
Measures
Pubertal stage
Pubertal stage was assessed using the self-report Tanner Staging questionnaire (Morris & Udry, Reference Morris and Udry1980) in which children identify their level of maturation on a scale of 1 to 5 using line drawings of secondary sex characteristics. Consistent with prior research (Dorn & Biro, Reference Dorn and Biro2011), we averaged Tanner scores for each participant to yield an index of average stage of pubertal development.
ELS assessment
Because child self-report and parent-report assessments of ELS may provide complementary information, we used a multi-informant approach to assess child exposure to ELS. First, we interviewed adolescents about their lifetime exposure to 30+ types of stressors using a modified version (see King et al., Reference King, Colich, LeMoult, Humphreys, Ordaz, Price and Gotlib2017) of the Traumatic Events Screening Inventory for Children (Ribbe, Reference Ribbe and Stamm1996). Second, parents completed a modified version of the Traumatic Events Screening Inventory—Parent Report Revised (Ghosh-Ippen et al., Reference Ghosh-Ippen, Ford, Racusin, Acker, Bosquet, Rogers and Edwards2002). All questions from the original versions of the Traumatic Events Screening Inventory were retained; modifications for both the child- and parent-report versions involved adding questions about experiences that may not rise to the level of trauma but that are nevertheless significant stressors (e.g., financial/resource problems, family mental illness/substance abuse, or family members moving in and out). In addition to the structured questions, both children and parents responded to a final open-ended question asking about exposure to any other stressors not covered by the structured questions.
Data preparation involved quality-control steps and integration of parent and child reports of ELS. We reviewed all parent and child responses to ensure that they were coded in the appropriate category for type of stressful experience. In addition, we reviewed responses to the final open-ended question to capture stressors not covered by the prior items, recoding any response that clearly aligned with one of the defined categories. Responses to this question that could not be categorized were excluded from the main analyses (N = 11 child responses; N = 19 parent responses). Next, given substantive overlap, responses to two different questions about separation from close others (separation specifically from parents vs. separation from a loved one/someone the child depends on for security) were combined into a single category of separation from family. Similarly, responses to different questions about community conflicts (witnessing nonfamily verbally fighting vs. witnessing nonfamily physically fighting), reports of being mugged/robbed, and responses to the open-ended question that described community violence (e.g., bomb/active shooter threats at school; witnessing police raids; or hearing gunshots) were combined into a single category of community violence. For each type of ELS (presented in Table 2), we identified children as exposed (coded 1) if either they or their parent endorsed the experience as having happened to the child, and as unexposed (coded 0) if neither they nor their parent endorsed it. We then entered these binary variables as indicator variables in the LCA. In addition, we calculated a cumulative ELS score for each child by counting the number of types of ELS to which the child was exposed.
Table 2. Rates of exposure to early life stress

Note: N = 211 children; frequency, n adolescents exposed; percentage, % adolescents exposed. Adolescent and parent reports of adolescent exposure to early life stress were integrated such that an adolescent was exposed if either the child or the parent reported the stressor. *Not included in latent class analysis due to low endorsement.
Socioeconomic status (SES)
Parents reported their household yearly income, the number of people in their household, and their highest level of education. Both income and education data were collected in bins. We calculated the income-to-needs ratio for each child's family by dividing parent-reported yearly income (median of the bin) by the low-income limit for Santa Clara county based on the number of people in the household (https://www.huduser.gov/portal/datasets/il/il2017/2017summary.odn). We recoded the education data into an ordinal variable as follows: 1 = no GED/high school diploma; 2 = GED/high school diploma; 3 = some college; 4 = 2-year college degree; 5 = 4-year college degree; 6 = master's degree; and 7 = professional degree (MD, JD, DDS)/doctorate. These methods are consistent with those of recent studies examining the effects of SES on brain structure in children and adolescents (Noble et al., Reference Noble, Houston, Brito, Bartsch, Kan, Kuperman and Sowell2015; Yu et al., Reference Yu, Daugherty, Anderson, Nishimura, Brush, Hardwick and Ofen2017).
MRI scanning acquisition and preprocessing
Adolescents underwent MRI scans at the Center for Cognitive and Neurobiological Imaging (CNI) at Stanford University using a 3T Discovery MR750 (GE Medical Systems, Milwaukee, WI) equipped with a 32-channel head coil (Nova Medical). For all participants, we acquired T1-weighted images using an SPGR sequence (repetition time/echo time/inversion time = 6.24/2.34/450 ms; flip angle = 12°; sagittal slices; 0.9 mm isotropic voxels). We performed volumetric segmentation using the FreeSurfer image analysis suite version 5.3.0 (http://surfer.nmr.mgh.harvard.edu/). Previous research indicates that FreeSurfer segmentation procedures yield data that are comparable to hand tracing of volumes (Fischl et al., Reference Fischl, Salat, Busa, Albert, Dieterich, Haselgrove and Dale2002), including in children (Ghosh et al., Reference Ghosh, Kakunoori, Augustinack, Nieto-Castanon, Kovelman, Gaab and Fischl2010). Although we extracted volume for a number of subcortical regions, analyses in this paper focused on the hippocampus and amygdala as a priori regions of interest. We implemented the following quality control steps to ensure the accuracy of volumetric segmentations: (a) prior to segmentation, we visually inspected each T1-weighted image to determine usability; (b) following automated segmentation, we visually inspected each automated segmentation against the T1-weighted volume for accuracy; (c) we extracted volumes for each hemisphere and converted them to z scores; volumes with z scores greater than 2.5 or less than –2.5 were visually examined again for accuracy; and (d) segmentations that failed either level of quality control were removed. Example segmentations are presented in Figure 1.
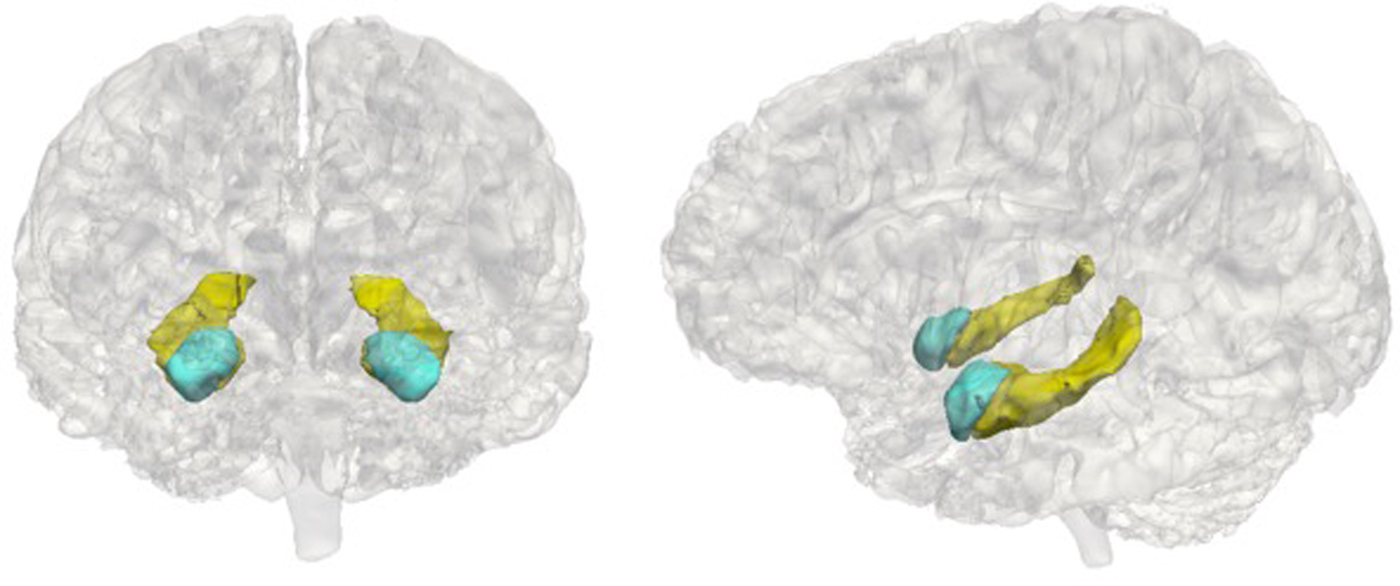
Figure 1. Example hippocampus and amygdala segmentations. The hippocampus is in yellow and the amygdala is in blue.
Of the 211 adolescents, 28 were excluded from analyses of subcortical volume (25 did not complete the scan protocol and 3 were not extractable due to artifact), yielding a final subsample of 183. For both hippocampal and amygdala volume, the distribution of adolescents with missing data did not differ across LCA-defined classes of ELS, χ2 (2) = 3.61, p = .164, nor were there significant differences between those with missing data in terms of sex, χ2 (1) = 0.48, p = .488, age, t (36.26) = –0.85, p = .400, pubertal stage, t (37.25) = –0.53, p = .599, cumulative ELS scores, t (38.71) = –0.79, p = .784, income-to-needs ratio, t (31.37) = –1.71, p = .110, parent education level, t (32.99) = –1.55, p = .130, or minority status, χ2 (1) = 0.01, p = .911.
Data analysis
LCA
We used Mplus 7 (Muthén & Muthén, Reference Muthén and Muthén2012) to conduct the LCA. We progressively fit latent class models with two to four latent classes; next, we compared fit and interpretability to determine the optimal model. To avoid LCA solutions based on local maxima, we used at least 200 random sets of starting values initially and 40 final-stage optimizations. To determine the optimal number of latent classes, we evaluated interpretability of the models, assessed the Bayesian information criterion (BIC), and implemented the bootstrap likelihood ratio test (BLRT; with 500 bootstrap draws) that computes a p value for improved fit of the current model relative to a model with one fewer class. Monte Carlo simulation studies indicate that these fit indices are the most robust across different models (Nylund, Asparouhov, & Muthén, Reference Nylund, Asparouhov and Muthén2007), and 80% power is achieved for the BLRT (α = 0.05) when N is slightly over 100 (Dziak, Lanza, & Tan, Reference Dziak, Lanza and Tan2014). After determining the number of latent classes, we identified the most likely class membership for each child from the posterior probabilities from the best solution, which is an appropriate method when classification uncertainty is low (Asparouhov & Muthén, Reference Asparouhov and Muthén2013).
Compared with other research using LCA to assess ELS (Ballard et al., Reference Ballard, Van Eck, Musci, Hart, Storr, Breslau and Wilcox2015; Dunn et al., Reference Dunn, Abbott, Croudace, Wilkinson, Jones, Herbert and Goodyer2011; McChesney et al., Reference McChesney, Adamson and Shevlin2015), we included a larger number of types of ELS and our sample size was smaller. Although there is no minimum sample size required to conduct LCA, it is not clear from the literature how smaller sample sizes interact with larger numbers of indicator variables to influence accurate detection of latent classes (Lanza & Rhoades, Reference Lanza and Rhoades2013; Nylund et al., Reference Nylund, Asparouhov and Muthén2007). Further, a weakness of person-centered approaches is their limitations for generalizability to new samples in which ELS is measured differently. Therefore, we replicated the analytic methods of a recently published study (Hagan et al., Reference Hagan, Sulik and Lieberman2016); this study used LCA to assess ELS in a similar sample size with a similar number of indicator variables also measured with a version of the Traumatic Events Screening Inventory. Consistent with Hagan et al. (Reference Hagan, Sulik and Lieberman2016), we first estimated an exploratory LCA based on the 23 types of ELS that were endorsed by more than 5% of the children/parents. Next, we estimated a refined LCA based only on the types of ELS that best distinguished classes as defined by having a >.40 difference in conditional response probability of exposure between two or more of the classes. Final class membership for each child was based on the solution for the refined LCA. This data-driven approach allowed us to identify the critical set of ELS experiences necessary to distinguish unique subgroups of adolescents who may have specific neurobiological alterations. In addition, by confirming the interpretation of the exploratory solution, this approach ensured that our person-centered assessment of ELS was not based on an idiosyncratic combination of the sample size and the number of indicator variables.
Associations between covariates and class membership
Using R (R Core Team, 2015) we conducted χ2 tests (sex and minority status) and analyses of variance (age, pubertal stage, income-to-needs ratio, and parent education level) to examine the distribution of potential covariates across the identified classes.
Effects of class membership on hippocampal and amygdala volume
Given the multilevel nature of the data (right and left hippocampal/amygdala volume nested within participants), we implemented linear mixed effects modeling in R using the “lmer” function in the package “lme4” (Bates, Machler, Bolker, & Walker, Reference Bates, Machler, Bolker and Walker2015). We fit separate models explaining hippocampal and amygdala volume by ELS class membership and the covariates. Bartlett's tests for homogeneity of variance of left and right hippocampal and amygdala volume across classes indicated no violations of this assumption (ps > .70). To identify covariates, we followed a formal model-fitting procedure and used χ2 tests to compare nested models. Starting with intercept-only models that included a random intercept to account for individual differences in mean hippocampal and amygdala volume, we successively added covariates and compared models with one more covariate. Because variation in cranial size may be associated with the volume of subcortical structures, we included estimated intracranial volume (ICV) as a covariate in the models (Mills et al., Reference Mills, Goddings, Herting, Meuwese, Blakemore, Crone and Tamnes2016).
For model comparisons, we fit models using maximum likelihood estimation. We centered continuous variables, and effect-coded categorical covariates. To assess performance of the person-centered approach to ELS in explaining hippocampal and amygdala volume, we additionally used χ2 tests to evaluate the improvement in model fit when the ELS class variable (dummy-coded) was added to the covariate-only model and calculated the Akaike information criterion (AIC) for the final selected model. The final selected model was fit with restricted maximum likelihood. Finally, in the presence of a main effect of ELS class, we examined pairwise contrasts to determine differences between classes in regional brain volume. For the main effects and pairwise contrasts, significance tests used Satterthwaite approximations of degrees of freedom (Kuznetsova, Brockhoff, & Christensen, Reference Kuznetsova, Brockhoff and Christensen2016)
Comparison to the cumulative risk approach
To compare the performance of the person-centered approach to ELS in explaining hippocampal and amygdala volume to that of the cumulative risk approach, we conducted separate linear mixed-effects analyses in which we replaced the ELS class variable with the cumulative ELS variable. Specifically, we used χ2 tests to evaluate the improvement in the fit of the models explaining hippocampal and amygdala volume when the cumulative ELS variable was added to the covariate-only models instead of the ELS class variable. In addition, for direct comparison to the person-centered model, we calculated the AIC for the cumulative risk model fit using restricted maximum likelihood.
Results
Descriptive statistics
Detailed descriptive statistics of the study sample are presented in Table 1. Rates of child exposure to each type of ELS, determined by integrating child self and parent report, are presented in Table 2. The most common type of exposure was witnessing an illness/injury (69%). Other prevalent experiences included moving/family members moving in and out (63%), seeing acts of war/terrorism on television (62%), and parental verbal fights/arguments (59%).
LCA
The fit statistics used to determine the number of latent classes are presented in Table 3. The BLRT indicated that the three-class model was a significantly better fit for the data than was the two-class model, whereas the BIC was higher for the three-class model than for the two-class model. The BLRT was nonsignificant for the four-class model, and the BIC was higher, indicating that the three-class model was a better fit for the data. In addition to these fit statistics, we evaluated the models based on the interpretability of the meaning of the latent classes (Collins & Lanza, Reference Collins and Lanza2010), and ultimately selected the three-class model. Entropy for the three-class model was high (.86), as was classification accuracy (.97, .88, .96), indicating low classification uncertainty.
Table 3. Fit statistics for the latent class analyses

Notes: BIC, Bayesian information criterion; BLRT, bootstrap likelihood ratio test for improvement in model fit compared to the model with one fewer class.
We display the conditional response probabilities for the 23 types of ELS across the three classes in Figure 2. Experiences of family instability and victimization distinguished the classes. One class, which we labeled typical/low (64% of the sample), had a lower likelihood of exposure across most types of ELS than did the other classes. Although the probability of witnessing the illness/injury of someone close, the death of someone close, and witnessing war/terrorism on television was >50% for adolescents in the typical/low class, this class was marked by a substantially lower likelihood of exposure to types of ELS defining family instability (family legal problems/imprisonment, family financial problems, parental divorce, separation from family, family members moving in and out, and parental verbal fights) compared to both other classes. A second class, which we labeled family instability (25% of the sample), had a higher likelihood of exposure to experiences of instability within the family but a low likelihood of direct experiences of victimization (neglect, emotional abuse, physical assault/abuse, and threats of domestic violence). A third class, which we labeled direct victimization (11% of the sample), also had a high likelihood of exposure to experiences of family instability and, uniquely, to experiences of victimization. Despite the interpretability of these classes, there were many types of ELS for which the conditional response probabilities were similar among classes, indicating they did not contribute to distinguishing the classes.

Figure 2. Conditional response probabilities for the exploratory three-class model across 23 types of early life stress. The conditional response probability for each type of early life stress indicates the probability of child exposure given membership in the class.
We included the following 11 types of ELS in the refined LCA based on the finding that they distinguished classes in the three-class exploratory model: parental divorce, separation from family, moving/family members moving in and out, family fights-verbal, domestic violence-physical, domestic violence-threats, family legal problems/imprisonment, family financial problems, physical abuse/assault, emotional abuse, and neglect. The BLRT for the three-class refined model was significant, and the BIC was higher for the three-class model than for the two-class model. The BIC was also higher for the four-class model than for the three-class model. Although the BLRT was significant for the four-class model, we again selected the three-class model because of parsimony and interpretability. Entropy (.83) and classification accuracy (.96, .86, .97) for the refined three-class model were similar to the exploratory model.
Results of the refined model confirmed our interpretation of the exploratory solution, while identifying the critical set of ELS experiences necessary to distinguish unique subgroups of children. We display conditional response probabilities for the 11 types of ELS across the three classes in Figure 3. Experiences of family instability and victimization distinguished the classes in a similar manner to the exploratory solution, confirming our interpretation. Class proportions based on most likely class membership determined by the refined model were as follows: typical/low (60%); family instability (28%); and direct victimization (12%).

Figure 3. Conditional response probabilities for the refined three-class model across 11 types of early life stress.
Associations between covariates and ELS class membership
We present results of analyses examining associations between potential covariates and class membership in Table 1. The three classes did not differ significantly in the distribution of child age, sex, pubertal stage, racial/ethnic minority status, or ICV. The classes differed significantly in income-to-needs ratio (p < .001), and parent education level (p = .001). Follow-up contrasts indicated that income-to-needs ratio significantly differed across all three classes. Adolescents in the direct victimization class had significantly lower income-to-needs ratios than did adolescents in both the typical/low, B = –0.64, SE = 0.12, t (191) = –5.41, p < .001, 95% bootstrap confidence interval (CI) [–0.88, –0.40], and family instability, B = –0.28, SE = 0.13, t (191) = –2.21, p = .028, 95% bootstrap CI [–0.54, –0.03] classes. In addition, adolescents in the family instability class had significantly lower income-to-needs ratios than did adolescents in the typical/low class, B = –0.36, SE = 0.08, t (191) = –4.28, p < .001, 95% bootstrap CI [–0.52, –0.19]. Whereas parents of adolescents in both the direct victimization, B = –0.82, SE = 0.27, t (200) = –3.06, p = .002, 95% bootstrap CI [–1.36, –0.29], and family instability classes, B = –0.57, SE = 0.19, t (200) = –2.98, p = .003, 95% bootstrap CI [–0.95, –0.19], had significantly lower levels of education than did parents of adolescents in the typical/low class, there was no significant difference in parent education level between the direct victimization and family instability classes.
Finally, the classes differed significantly in cumulative ELS scores (p < .001). Follow-up contrasts indicated that adolescents in the direct victimization class had significantly higher cumulative ELS scores than did adolescents in both the typical/low, B = 7.48, SE = 0.52, t (208) = 14.38, p < .001, 95% bootstrap CI [6.45, 8.50], and family instability, B = 3.52, SE = 0.57, t (208) = 6.20, p < .001, 95% bootstrap CI [2.40, 4.64], classes. Further, adolescents in the family instability class had significantly higher scores than adolescents in the typical/low class, B = 3.96, SE = 0.37, t (208) = 10.57, p < .001, 95% bootstrap CI [3.22, 4.71].
ELS class membership and hippocampal volume
For the model explaining hippocampal volume, successively adding ICV, χ2 (1) = 46.37, p < .001, age, χ2 (1) = 5.51, p = .019, and hemisphere, χ2 (1) = 4.35, p = .037, to the intercept-only model significantly improved model fit, whereas adding neither pubertal stage nor sex improved model fit (ps > .14). Model fit significantly improved when we added the main effect for ELS class to the model, χ2 (2) = 7.23, p = .027. Because adding the interaction between class and hemisphere did not improve model fit (p = .755), we focused on the more parsimonious model.
In the final selected model (AIC = 4,923.22) there was a significant main effect of ELS class on hippocampal volume, F (2, 177.24) = 3.58, p = .031. Follow-up contrasts indicated that adolescents in the direct victimization class had significantly smaller hippocampal volume than did adolescents in the typical/low class, B = –211.10, SE = 82.18, t (177.2) = –2.57, p = .011, 95% bootstrap CI [–380.17, –43.26]. Although adolescents in the family instability class had smaller hippocampal volume than adolescents in the typical/low class, this difference was not statistically significant. In Figure 4, we present the adjusted means and 95% CIs of bilateral hippocampal volume across the three classes calculated using the “lsmeansLT” function in R (Kuznetsova et al., Reference Kuznetsova, Brockhoff and Christensen2016).

Figure 4. Adjusted mean bilateral hippocampal volume across classes of early life stress. Error bars are 95% confidence intervals; points are adjusted means of bilateral hippocampal volume for each class. Across hemispheres, adolescents in the direct victimization class had significantly smaller hippocampal volume than adolescents in the typical/low class. There were no other statistically significant differences.
ELS class membership and amygdala volume
For the model explaining amygdala volume, adding ICV, χ2 (1) = 51.16, p < .001, age, χ2 (1) = 8.47, p = .004, and hemisphere, χ2 (1) = 43.07, p < .001, to the intercept-only model significantly improved model fit, whereas neither adding pubertal stage nor adding sex improved model fit (ps >.15). Further, the addition of neither the main effect of ELS class nor the interaction between class and hemisphere significantly improved model fit (ps > .28). There were no significant main, F (2, 178.40) = 1.21, p = .299, or interactive effects of ELS class, F (2, 174.80) = 0.92, p = .403, on amygdala volume; therefore, we did not conduct follow-up contrasts.
Comparison to the cumulative risk approach
Adding the cumulative ELS score to the covariate-only model explaining hippocampal volume marginally improved model fit, χ2 (1) = 3.24, p = .072. The AIC was higher for the cumulative ELS model (4,939.99) than for the ELS class model. There was a nonsignificant trend for higher cumulative ELS scores to be associated with smaller hippocampal volume, B = –13.03, SE = 7.28, t (179.0) = –1.79, p = .075. For the model explaining amygdala volume, adding the cumulative ELS score to the covariate-only model did not significantly improve model fit (p = .125), and there was no significant association between cumulative ELS and amygdala volume, B = –5.43, SE = 3.56, t (179.7) = –1.52, p = .129.
Additional analyses: The role of SES
Finally, given the association between the SES variables and ELS class, we conducted additional analyses in which we replaced the ELS class variable with the income-to-needs ratio and parent education level, respectively, in the models explaining hippocampal and amygdala volume. Instead of treating the SES variables as covariates, we conducted these separate models of SES in order to evaluate the impact of SES on brain volumes in a manner similar to most previous research examining the neurodevelopmental effects of SES in which exposure to specific stressful experiences was not measured or covaried (Hanson, Chandra, Wolfe, & Pollak, Reference Hanson, Chandra, Wolfe and Pollak2011; Noble et al., Reference Noble, Houston, Brito, Bartsch, Kan, Kuperman and Sowell2015; Yu et al., Reference Yu, Daugherty, Anderson, Nishimura, Brush, Hardwick and Ofen2017). By conducting these separate models, we also avoided concerns for nonindependence of the grouping variable with covariates, which can influence the estimation and interpretation of the effect of group membership in problematic ways (Miller & Chapman, Reference Miller and Chapman2001). We found that neither the income-to-needs ratio nor parent education level significantly improved model fit when added to the covariate-only model explaining hippocampal volume (ps > .22). Further, neither income-to-needs ratio, B = 56.70, SE = 50.83, t (165.70) = 1.12, p = .266, nor parental education, B = 27.98, SE = 23.33, t (163.30) = 1.21, p = .232, was significantly associated with hippocampal volume. Results were similar for the model explaining amygdala volume: neither income-to-needs ratio nor parental education significantly improved model fit (ps >.14), nor was income-to-needs ratio, B = 35.56, SE = 24.56, t (164.02) = 1.45, p = .151, or parental education, B = 11.41, SE = 11.33, t (162.30) = 1.01, p = .315, significantly associated with amygdala volume.
Discussion
In a community sample of early adolescents exposed to a broad range of adverse experiences, we used LCA to develop a person-centered model of ELS. In an exploratory analysis, we identified three latent classes defined by constellations of exposure to ELS; we then confirmed this solution in a refined analysis of the critical set of ELS experiences that distinguished unique subgroups of children. These subgroups of children were distinguished by experiences of family instability and victimization. The largest class, typical/low, was characterized by a low probability of exposure to both experiences of family instability (e.g., parental divorce or separation from family) and experiences of victimization (e.g., maltreatment). A second class, family instability, was associated with high probability of exposure to family instability, and the final, smallest class, direct victimization, was defined uniquely by experiences of victimization.
Although this was a community sample of early adolescents, findings of the LCA were similar to those reported by Hagan et al. (Reference Hagan, Sulik and Lieberman2016), who identified a three-class model in a high-risk sample of young children. These authors found that the direct experience of victimization distinguished the smallest class from a class of children who witnessed family violence but were not directly victimized. The current study was similar to that of Hagan et al. (Reference Hagan, Sulik and Lieberman2016) in sample size and types of ELS, and we replicated their analytic methods. Other studies using LCA to examine adversity in childhood have identified other classes based on measures of caregiving behavior (Dunn et al., Reference Dunn, Abbott, Croudace, Wilkinson, Jones, Herbert and Goodyer2011; St. Clair et al., Reference St. Clair, Croudace, Dunn, Jones, Herbert and Goodyer2015), but have also found that forms of victimization distinguish classes, including sexual assault (Ballard et al., Reference Ballard, Van Eck, Musci, Hart, Storr, Breslau and Wilcox2015; McChesney et al., Reference McChesney, Adamson and Shevlin2015) and child abuse (Dunn et al., Reference Dunn, Abbott, Croudace, Wilkinson, Jones, Herbert and Goodyer2011). In the current study, we used a multi-informant approach to assess experiences of ELS, assessed multiple indicators of family instability and victimization, and identified the critical set of ELS experiences that distinguished subgroups of children. These methods allowed us to characterize children's experiences more comprehensively, to address limitations of existing models of ELS, and to provide insight into specific neurobiological correlates of ELS.
Findings concerning associations of class membership with hippocampal volume indicated that the person-centered model of ELS increases the specificity of our understanding of neurobiological markers of ELS. Adolescents in the direct victimization class had significantly smaller bilateral hippocampal volume than did adolescents in the typical/low class. Although we cannot draw causal conclusions, these findings suggest that experiences of victimization, including emotional and physical abuse, are particularly consequential for the development of this stress-sensitive brain region. This formulation is consistent with the theory that severely threatening experiences, specifically, result in alterations to neural circuits involved in emotion learning, including the structure of the hippocampus (Sheridan & McLaughlin, Reference Sheridan and McLaughlin2014). Although researchers have consistently found reduced hippocampal volume in adults exposed to childhood adversity (Calem, Bromis, McGuire, Morgan, & Kempton, Reference Calem, Bromis, McGuire, Morgan and Kempton2017), findings concerning the effects of ELS on hippocampal volume in children and adolescents have been mixed, leading some researchers to hypothesize that alterations in hippocampal volume following ELS may not be observable until adulthood (Sheridan & McLaughlin, Reference Sheridan and McLaughlin2014; Teicher & Samson, Reference Teicher and Samson2016). Whereas some researchers have found smaller hippocampal volume in adolescents exposed to greater cumulative ELS (Edminston et al., Reference Edminston, Wang, Mazure, Guiney, Sinha, Mayes and Blumberg2011; Hanson et al., Reference Hanson, Nacewicz, Sutterer, Cayo, Schaefer, Rudolph and Davidson2015; Rao et al., Reference Rao, Chen, Bidesi, Shad, Thomas and Hammen2010) and in previously institutionalized adolescents (Hodel et al., Reference Hodel, Hunt, Cowell, van den Heuvel, Gunnar and Thomas2015), others have found no differences in hippocampal volume between children who experienced severe neglect in early life and comparison children (Sheridan, Fox, Zeanah, McLaughlin, & Nelson, Reference Sheridan, Fox, Zeanah, McLaughlin and Nelson2012; Tottenham et al., Reference Tottenham, Hare, Quinn, McCarry, Nurse, Gilhooly and Casey2010), or between children who were exposed to maternal depressive symptomatology since birth and children who were not (Lupien et al., Reference Lupien, Parent, Evans, Tremblay, Zelazo, Corbo and Seguin2011).
There are several possible explanations for these equivocal findings concerning the impact of ELS on hippocampal volume, including the age range of the study samples and the assessments of ELS. Given that growth in hippocampal subregions is nonlinear across development (Gogtay et al., Reference Gogtay, Nugent, Herman, Ordonez, Greenstein, Hayashi and Rapoport2006), the narrower age range of adolescents in the current study may have increased our ability to detect effects of ELS. Furthermore, by using a person-centered model of ELS, we may have identified effects missed in research using other types of models. An advantage of person-centered models is that they increase the proportion of explained variance by not assuming that relations among variables hold across all individuals (von Eye, Reference von Eye2010). Results of the current study indicated that the person-centered approach to the assessment of ELS was superior in explaining variation in hippocampal volume to the cumulative risk approach. Specifically, whereas the addition of the ELS class variable to a covariate-only model explaining hippocampal volume significantly improved model fit, the addition of the cumulative risk variable did not. Further, absolute model fit was better for the person-centered model than for the cumulative risk model, and cumulative risk was only marginally associated with hippocampal volume.
As is the case with the hippocampus, animal studies have consistently identified the amygdala as being vulnerable to alterations as a consequence of early stress (for a review, see McEwen, Eiland, Hunter, & Miller, Reference McEwen, Eiland, Hunter and Miller2012). These studies, however, have documented a different pattern than has been found for the effect of stress on the hippocampus (Vyas, Mitra, Shankaranarayana Rao, & Chattarji, Reference Vyas, Mitra, Shankaranarayana Rao and Chattarji2002), such that stress is associated with increased dendritic arborization, formation of new spines on pyramidal cells, and consequently, enlarged amygdala volume (Eiland, Ramroop, Hill, Manley, & McEwen, Reference Eiland, Ramroop, Hill, Manley and McEwen2012; Vyas, Jadhav, & Chattarji, Reference Vyas, Jadhav and Chattarji2006). A small number of studies in humans have similarly reported a positive relation between exposure to ELS and amygdala volume, including enlarged volumes in previously institutionalized children adopted later in childhood (Tottenham et al., Reference Tottenham, Hare, Quinn, McCarry, Nurse, Gilhooly and Casey2010) and in children exposed to maternal depressive symptomatology (Lupien et al., Reference Lupien, Parent, Evans, Tremblay, Zelazo, Corbo and Seguin2011). Overall, however, the majority of studies examining the impact of maltreatment on amygdala volume have identified significantly or nonsignificantly smaller volumes among victimized individuals, suggesting that exposure to multiple threatening experiences, rather than neglect alone, may lead to hypotrophy of the amygdala in humans (for a review, see Teicher & Samson, Reference Teicher and Samson2016).
Although in the current study neither ELS class membership nor cumulative risk was statistically significantly associated with amygdala volume, consistent with previous literature, amygdala volume was smallest among adolescents in the class characterized by direct victimization. Given that distinct brain regions mature along different time scales (Somerville, Reference Somerville2016), the effects of stress on the hippocampus and amygdala may depend on developmental stage and become detectable in MRI measurements at different ages (Lupien et al., Reference Lupien, McEwen, Gunnar and Heim2009). Thus, it is possible that the effects of threatening experiences on amygdala volume become statistically significant only in later adolescence with the experience of additional stress (Lupien et al., Reference Lupien, McEwen, Gunnar and Heim2009). Nonetheless, other researchers have proposed that stress-related differences in amygdala volume emerge prior to differences in hippocampal volume (Tottenham & Sheridan, Reference Tottenham and Sheridan2010), and there is evidence that both the amygdala and the hippocampus reach peak volume during early adolescence (Uematsu et al., Reference Uematsu, Matsui, Tanaka, Takahashi, Noguchi, Suzuki and Nishijo2012). Clearly, longitudinal research spanning childhood and adolescence is needed to clarify the effects of ELS on the structural development of stress-sensitive brain regions.
Although not a primary goal of this study, given that SES was significantly associated with ELS class membership, we conducted separate models in which we examined the effects of income-to-needs ratio and parent education level on hippocampal and amygdala volumes in order to clarify the role of SES in explaining variation in these volumes. Neither income-to-needs ratio nor parent education level was significantly associated with hippocampal or amygdala volume, nor was model fit improved when we added the SES variables to the covariate-only models explaining hippocampal and amygdala volume. These findings suggest that reduced hippocampal volume in the current sample is not explained by lower SES. In addition, these findings provide further support for the formulation that threatening experiences, rather than deprivation alone, are associated with reduced hippocampal volume (Sheridan & McLaughlin, Reference Sheridan and McLaughlin2014). There is considerable interest in the potential impact of poverty on the brain, and several studies that did not assess ELS have documented positive associations of SES with hippocampal volume in children and adolescents (Hanson et al., Reference Hanson, Chandra, Wolfe and Pollak2011; Noble, Houston, Kan, & Sowell, Reference Noble, Houston, Kan and Sowell2012; Yu et al., Reference Yu, Daugherty, Anderson, Nishimura, Brush, Hardwick and Ofen2017). Nonetheless, a primary model for the effects of SES on the brain involves the physiological consequences of exposure to correlated stressors (Ellwood-Lowe, Sacchet, & Gotlib, Reference Ellwood-Lowe, Sacchet and Gotlib2016; Farah, Reference Farah2017), and there is evidence that stressful events in early life mediate the association between SES and hippocampal volume (Luby et al., Reference Luby, Belden, Botteron, Marrus, Harms, Babb and Barch2013). Thus, it is possible that ELS, rather than SES, explains the associations between SES and hippocampal volume documented in previous studies that did not assess ELS.
Limitations
In interpreting the results of this study, it is important to consider several limitations. Critically, this was a cross-sectional study; therefore, we cannot draw causal conclusions about the impact of ELS class membership on brain volumes. As a related point, our assessment of ELS was retrospective; recent research suggests that retrospective reports underestimate the impact of ELS on biomarkers and overestimate the impact on self-report outcomes (Reuben et al., Reference Reuben, Moffitt, Caspi, Belsky, Harrington, Schroeder and Danese2016). Further, we focused in this study on the effects of specific co-occurring types of ELS; we did not incorporate other characteristics of ELS, including developmental timing and duration, which may moderate effects. For example, given that structural maturation of the brain is most rapid during infancy and the preschool years, this developmental phase may be a sensitive period in which environmental input has the most powerful effects on hippocampal volume (Luby, Belden, Harms, Tillman, & Barch, Reference Luby, Belden, Harms, Tillman and Barch2016).
Participants in this study were recruited from relatively low-risk communities; thus, our findings may not generalize to either population-representative or higher risk samples. This point is especially important in interpreting the null effects of SES on brain volumes given evidence that the impact of variation in SES on brain structure is most pronounced at the low end of SES (Noble et al., Reference Noble, Houston, Brito, Bartsch, Kan, Kuperman and Sowell2015). The LCA solution is also limited by the sample size and types of ELS assessed, and it is possible that more classes would have been identified in a larger sample and that other types of stressors would have differentiated classes if they were explicitly assessed. It is also possible that by excluding postmenarcheal girls from this study, we excluded some high-risk girls who are vulnerable to experiencing menarche at an earlier age due to exposure to ELS (Chisholm, Quinlivan, Petersen, & Coall, Reference Chisholm, Quinlivan, Petersen and Coall2005). Finally, additional unmeasured factors associated with ELS may explain our findings. For example, gene–environment correlations may account for covariation between ELS class membership and hippocampal volume (Plomin, DeFries, & Loehlin, Reference Plomin, DeFries and Loehlin1977). Specifically, twin studies suggest moderate heritability of hippocampal volume (Peper, Brouwer, Boomsma, Kahn, & Hulshoff Pol, Reference Peper, Brouwer, Boomsma, Kahn and Hulshoff Pol2007); thus, it is possible that differences in parents’ or children's behavior associated with smaller hippocampal volume contribute to increased vulnerability to experiencing ELS. Outside of conducting formal experiments, we cannot rule out the possibility that genetics contributed to observed group differences in the current study (Rutter, Reference Rutter2007).
Conclusions
The person-centered model of ELS may overcome issues of prevailing models of ELS by distinguishing type of ELS while allowing for known interrelations among different forms of ELS. Underscoring the utility of this approach, in this study we identified a subgroup of adolescents who were victimized in childhood as specifically vulnerable to smaller hippocampal volume. Further, the person-centered model of ELS was superior to a cumulative risk model in explaining hippocampal volume, and findings were not explained by variation in SES. By specifying the profile of ELS experiences that is distinctly associated with smaller hippocampal volume in early adolescence, our findings complement previous work identifying broad associations between cumulative ELS and reduced hippocampal volume, and suggest that future longitudinal research should focus specifically on victimized children as vulnerable to hippocampal hypotrophy. Given the growing interest in linking specific forms of ELS to specific neurobiological alterations, findings of this study have the potential to inform measurement of ELS in future research and, ultimately, to shape precision screening, prevention, and intervention procedures.