Introduction
Despite progress in IVF techniques, the percentage of embryos successfully implanted in the uterus during IVF is still low and only a minority of the generated embryos can provide accurate implantation (Wang et al., Reference Wang, Ang, Tan and Latt2015; Louis et al., Reference Louis, Erwin, Handayani, Polim, Boediono and Sini2021). To increase the probability of a successful pregnancy, most embryologists transfer two or more embryos per cycle. Increasing the probability of multiple pregnancies is the result of this practice. To decrease the probability of multiple pregnancies and to increase the probability of a successful pregnancy, selecting a single embryo with a high implantation probability would be the best strategy (Puissant et al., Reference Puissant, Van Rysselberge, Barlow, Deweze and Leroy1987; Ziebe et al., Reference Ziebe, Petersen, Lindenberg, Andersen, Gabrielsen and Andersen1997; Scott et al., Reference Scott, Alvero, Leondires and Miller2000; Zhao et al., Reference Zhao, Li, Li, Li, Luo, Li, Lee, Wang and Chan2021). Identifying key points in embryo development is helpful when choosing the embryo with a high implantation probability, and distinguishing between regular and irregular zygotes could help to evaluate zygote performance (VerMilyea et al., Reference VerMilyea, Hall, Diakiw, Johnston, Nguyen, Perugini, Miller, Picou, Murphy and Perugini2020; Zhao et al., Reference Zhao, Li, Li, Li, Luo, Li, Lee, Wang and Chan2021).
Image-processing techniques can help to extract useful information from images. To be more precise, these techniques can extract interesting regions more accurately than when assessed by individuals (Gonzalez et al., Reference Gonzalez, Woods and Eddins2004). In this way, the automatic evaluation of morphological measurements in zygotes has led to an improvement in the identification of embryos, increasing the accuracy of implantation predictions, and reducing the number of transferring embryos. This approach also helps to save time and speed up the process (El-Shenawy, Reference El-Shenawy2013).
Some studies analyzed microscope images of cells in general, and directed more focused work to the detection and grading of human embryos. A recent study reviewed how image processing and machine learning could be useful when characterizing morphological measurements and automatically recognizing cell images. The dataset used in this study included blood cells; the group worked specifically on red blood cells with the focus on malignant lymphoid cells and blast cells. They analyzed segmentation, quantitative features and classification methods, and reported the overall segmentation efficiency of 98.9% for the 12 cell groups of normal lymphocytes, reactive lymphocytes, blast cells, and nine types of abnormal lymphocytes. This study found neural networks, decision trees, and support vector machines (SVM) to be the most used classification methods for peripheral blood cells. This study concluded that those technologies could be helpful for cytologists to analyze blood cells faster and more efficiently (Rodellar et al., Reference Rodellar, Alférez, Acevedo, Molina and Merino2018).
A previous method used region-based segmentation to separate the central oocyte from the background. The dataset for this method included two different groups, each from a different clinic. The groups consisted of 112 and 98 patients, respectively. In this work, the oolemma boundary was detected using a Gaussian blur and a Sobel edge filter. This method fitted an ellipse to the pixels of the boundary. In the following period, the proposed approach detected the perivitelline space with the help of some points that were selected by the user. In the next step, the number of NPBs was detected manually. To detect the 2PN stage, the method rotated the image to the light direction and applied a histogram equalization (Awcock and Thomas, Reference Awcock and Thomas1995). Afterwards, the approach detected the 2PN stage with a Gaussian blurring kernel and a Sobel operator for edge finding. Then the edge image was correlated with a family of PN edge templates. The template modelled the PN border, and its radius was varied within a range that included 13 and 14 mm. The centre of the 2PN was the maximum correlation peaks found within a distance of 13 mm around the corresponding sets of NPBs, which were previously manually marked by the user. The polar bodies were also selected manually. Next, a 27-dimensional feature vector was associated with each zygote. The first three components of this vector were input by the user. They related to the zygote treatment (fertilization method and preservation state) and the presence and absence of polar bodies. Then, 24 components were computed from the morphological characterization (Beuchat et al., Reference Beuchat, Thévenaz, Unser, Ebner, Senn, Urner, Germond and Sorzano2008).
Another detection method was based on the Hough transformation. Here, 20 embryo images were used as the test set for 6 days (Mölder et al., Reference Mölder, Czanner, Costen and Hartshorne2014). Their approach detected the perivitelline space using a circular Hough transformation. First, for pronuclei detection, their proposed method used rotational filtering to minimize the false positives; secondly, it used the Hough transformation. In this way, the method detected pronuclei automatically. After selection of the region of interest (ROI) using the Hough transformation, the image variance was used to detect pronuclear breakdown. The overall accuracy of this method for detecting the position of the embryo outline was 95%, and for detecting the timing of the PNB was 83%.
In another method, a graph-based algorithm was used to segment the regions of the human zygote. This approach used 59 human zygote images and divided the segmentation process into two steps. First, the approximate location of the zygote centre was found. This step was divided into four substeps. First, a binary mask was obtained after thresholding the module of the gradient. Then, the largest connected component with holes was filled. Following this, using distance transform, the minimum distance to the region boundary was calculated. Finally, the maximum distance transform was considered as the approximate centre of the cell. In the second step, the image was transformed to a polar coordination, and contour localization was carried out by calculating the minimum-cost path (Giusti et al., Reference Giusti, Corani, Gambardella, Magli and Gianaroli2009).
One previous work was performed to provide an automatic application for zona pellucida (ZP) recognition. This method was applied to 45 Hoffman modulation contrast (HMC) and bright field microscopy images. The proposed method is limited to images of day-3 embryos, so it is not suitable for detecting the number of NPBs. The method first smoothed the original image to reduce unwanted noises and applied a Sobel edge detector to the smoothed image to obtain the edge of the image. All the edges were connected to each other using image closing, so a circle representing the approximate area of the blastomeres was obtained. Therefore, the centre of the embryo was estimated with the help of that circle. Next, Canny edge detection was applied to the polar-coordinate image to assess the external ZP border (Wang et al., Reference Wang, Ang, Tan and Latt2015). The proposed approach selected the proper biopsy location by performing a few steps: first, the image was transformed into a polar coordination and was sampled unequally. Next, the unequal sampled image was stretched to amplify the ZP boundary and a blastomere space. Then the stretched image was transformed into a binary image and edges were detected using the Canny detection algorithm (Canny, Reference Canny1986).
Another method proposed an automatic algorithm to segment differential interference contrast (DIC) images. This method removed the DIC image gradient and detected cell centres to mark each significant cell. This procedure was performed in three steps. First, a deconvolution method was used to transform the image into intensity; second, the cell centres were determined with the help of the voting method. Third, the cells were detected using a partial differential equation (PDE)-based level set (Kuijper and Heise, Reference Kuijper and Heise2008).
A semi-automatic grading system worked on the fourth and fifth day of embryos, aiming to segment and classify human blastocyst images using 93 images of different blastocysts. In this study, an ellipse was fitted to detect the interior border of ZP. The phase congruency method was used to achieve the binary image for the segmentation of trophectoderm epithelium (TE) and inner cell mass (ICM). The method used the SVM classifier to grade the blastocysts automatically (Bączkowski et al., Reference Bączkowski, Kurzawa and Głąbowski2004; Santos Filho et al., Reference Santos Filho, Noble, Poli, Griffiths, Emerson and Wells2012).
An oocyte scoring system was proposed to develop a diagnostic tool to analyze light microscopic images of human oocytes and derive a description of the oocyte cytoplasm that was useful for quality assessment in assisted reproductive techniques. This approach was tested on 60 microscope images of human oocytes, and had three main steps. The first step was segmentation. In this step, the oocyte cytoplasm was detected by applying dilation, erosion operators, and Hough transformation. The second step was feature extraction. In this step, the results from the first step were processed by Haar wavelet transformation to describe the texture of the cytoplasm. The last step clustered the oocytes to the levels of the cytoplasm granularity; this was done by fuzzy clustering (Basile et al., Reference Basile, Caponetti, Castellano and Sforza2010).
In another method, researchers worked on automatically detecting the day-2 post-fertilization of 76 embryos to analyze embryo quality at the early stage. First, this method fitted an ellipse to each blastomere to model its contours. Then, the mean eccentricity of all ellipses was calculated. Finally, by evaluating the mean eccentricity of all ellipses and the number of blastomeres, the algorithm formed the criteria to assess the quality and viability of the embryos (Strouthopoulos and Anifandis, Reference Strouthopoulos and Anifandis2018).
Another group used a method for cell image segmentation that was tested on hypothyroid images. Their method consisted of three main phases. First, they calculated the gradient image and then used the resulting image to detect cell boundaries. Finally, the proposed approach fixed cell boundary parameters to match the outline of the cell with the help of a genetic algorithm (Yang and Jiang, Reference Yang and Jiang2001).
Another method showed that the thickness of ZP was directly related to the implantation rate. This method was based on an active contour model. The approach applied pre-processing steps such as a Gaussian filter and the Canny edge detector and used the active contour model to detect the specified region (Kass et al., Reference Kass, Witkin and Terzopoulos1988; Morales et al., Reference Morales, Bengoetxea and Larranaga2008).
The method proposed here for ZME demonstrates the most important features of a zygote cell such as the shape of the oolemma, the shape and size of the perivitelline space, the ZP boundary, the number of nucleolar precursor bodies (NPBs) in the pronuclei and their distribution, which determines zygote quality. These features are shown in Figure 1. The ZME algorithm can successfully identify a zygote with high implantation potential with the help of these morphological characteristics. The key contribution of the proposed approach is that it provides an acceptable accuracy based on low-level and noisy images. Another advantage of the proposed method is that the extraction of the most important features of the zygote was performed fully automatically based on image-processing techniques. Another interesting novel aspect of this study is the building of a unique dataset of 703 human zygote images that is publicly available for academic purposes.

Figure 1. Morphological measures in the zygote.
This paper has been arranged into five parts. The following section discusses the materials and methods for our proposed process for zygote morphology detection. Then we first review the characteristics of our prepared dataset and the experimental results and comparisons are represented. Finally we discuss and conclude the contributions to this field of research.
Materials and Methods
The proposed approach (ZME) is an automatic method to extract significant features from zygote images. These important features can be used to help the embryologist select the best embryos. The diagram for ZME is shown in Figure 2.

Figure 2. Diagram of the zygote morphology examination (ZME).
Pre-processing is the first step of the proposed method. Accordingly, the main step of the pre-processing phase is noise reduction. After this step, some undesirable small regions can remain on the images. In our proposed method, these undesirable regions will be removed. In fact, there are two main steps in the algorithm: the first step is the oolemma region and NPB detection, and the second phase is the perivitelline space and ZP region detection. In the following subsections and Figure 3, each step will be described in more detail.

Figure 3. Details of each step in the proposed method.
Pre-processing
The pre-processing step of the ZME has two stages: image noise reduction and removing small regions. One of the most significant pre-processing steps for medical images is noise reduction. This step aimed to reduce the noise level. The main point of this step was to retain important information and remove unwanted information. So, the essential point of this step is to retain the edges and remove noise simultaneously; the first step is the conversion of red–green–blue (RGB) colour space to YCbCr (Ghasemian et al., Reference Ghasemian, Mirroshandel, Monji-Azad, Azarnia and Zahiri2015), in which Y shows the luminance in the YCbCr colour space, Cb is the blue, and Cr is the red difference values. The proposed method uses just the Y dimension in the following steps. In the second step, the noise is sharpened and, finally, by applying the Gaussian filter, the shape of the noise is changed (Shapiro and Stockman, Reference Shapiro and Stockman2001). Therefore, the resulting image is appropriate for wavelet transformation. In this way, the Coiflet-2 family of a two-dimensional wavelet transform is used by the proposed method, and decomposition is applied at level 4. Consequently, the noise of the input image will be reduced to an acceptable rate and can be used for the subsequent analysis. The second step of the pre-processing stage is removing the unwanted region. To achieve this, the proposed method labels each region and calculates the size of areas. So, the areas with sizes less than the threshold value will be removed.
Zygote region analysis
As discussed before, four regions of the zygote are analyzed using the ZME algorithm; these are the oolemma, perivitelline space, ZP, and NPBs. In the first step, the proposed method detects the oolemma region and, after detecting the oolemma, this region is removed from the image. Next, the proposed approach uses the rest of the denoized image to identify the perivitelline space and ZP regions.
Oolemma detection
After applying the pre-processing step, the resulting image contains the oolemma region. As discussed in the pre-processing step, some small regions are present in the input image that are not removed by noise reduction. So, a separate stage is needed to remove them. In this way, the proposed method sets a threshold value to remove small regions. The threshold value was defined based on the difference between the size of the oolemma region and the size of the other undesirable regions. To do this, all regions are labelled and if the size of any region is smaller than that of the threshold value, it will be removed.
The perivitelline space and the ZP regions are very transparent. So, they are removed by applying the pre-processing step. By removing the small regions, the perivitelline space, and the ZP regions, the biggest region (i.e. the oolemma region) will be retained. At this time, the object of interest is obtained, but there are still some holes inside the image. So, the next step is filling the holes to produce a binary mask of the ROI. To analyze the oolemma region, values for the size of the area and the diameter of the oolemma are needed. So, these two features are extracted in this step. By having a binary mask, the size of the area of the oolemma region is obtained. As the oolemma region is a circular shape, the size of the diameter is easily found if the oolemma area is known. These extracted features can be used to detect abnormalities in the size and shape of the oolemma.
Perivitelline space and ZP detection
In the first step of the proposed method, the denoized image is obtained. Then, in the second step, the oolemma region is detected. So, these two images are used to detect the perivitelline space and the ZP. In this way, the proposed method calculates their differences. Therefore, the remaining image contains the perivitelline space region, the ZP region, and the outer area of the zygote.
To cluster the perivitelline space and the ZP regions, first these two regions need to be extracted from the rest of the image. However, as there is slight contrast between the image pixels, common segmentation techniques cannot be applied to solve this problem. Therefore, the proposed method uses a region-growing algorithm. First, a threshold value is defined according to the size of the dataset images and with the help of a trial and error method. The proposed algorithm then extends the region to the desired threshold by selecting the candidate region. After selecting the candidate region, with the help of the region-growing algorithm, the proposed method uses the fuzzy C-means algorithm (FCM) to detect the perivitelline space and the ZP regions. FCM is a soft clustering method; in this method, instead of putting each pixel into a separate cluster, the probability that the pixel is in the clusters is determined. The FCM method is more effective than other clustering methods if, as mentioned before, the contrast difference between image pixels is low, and choosing FCM can be very helpful. In the following paragraphs, this method is explained.
FCM is a clustering algorithm that allows each data point to belong to two or more clusters. FCM is based on minimizing the objective function, shown in Equation (1) (Bezdek, Reference Bezdek2013). This algorithm aims to partition a limited connection of n elements X = {x 1 , x 2 , …, x n } into a collection of FCM clusters:
 $${J_m} = \mathop \sum \limits_{i = 1}^N \mathop \sum \limits_{j = 1}^C u_{ij}^m{x_i} - {c_j}^2,\,\,1 \le m \lt \infty $$
In Equation (1), m can be any real number greater than one (i.e. the fuzzifier), u
ij
is the membership degree of x
i
in the cluster j, x
i
is the i
th element of d-dimensional measured data, and c
j
is the d-dimension centre of the cluster j. The objective function, which is shown in Equation (1), is performed through iterative optimization. In each iteration, the
 $u_{ij}^m$
and c
j
are updated and defined in Equations (2) and (3), respectively (Bezdek, Reference Bezdek2013):
$u_{ij}^m$
and c
j
are updated and defined in Equations (2) and (3), respectively (Bezdek, Reference Bezdek2013):
 $${u_{ij}} = {1 \over {\mathop \sum \nolimits_{k = 1}^c {{\left( {{{{x_i} - {c_j}} \over {{x_i} - {c_k}}}} \right)}^{{2 \over {m - 1}}}}}}$$
 $${c_j} = {{\mathop \sum \nolimits_{i = 1}^N u_{ij}^{} \cdot {x_i}} \over {\mathop \sum \nolimits_{i = 1}^N u_{ij}^m}}$$
In Equations (2) and (3), when
 $ma{x_{ij}}\left\{ {\left| {u_{ij}^{\left( {k + 1} \right)} - u_{ij}^{\left( k \right)}} \right|} \right\} \lt \delta $
, the iteration will stop (0 <
$ma{x_{ij}}\left\{ {\left| {u_{ij}^{\left( {k + 1} \right)} - u_{ij}^{\left( k \right)}} \right|} \right\} \lt \delta $
, the iteration will stop (0 <
 $\;\delta $
< 1, where k is the iteration step).
$\;\delta $
< 1, where k is the iteration step).
Nucleolar precursor bodies detection
The third part of the proposed method is NPB detection. NPBs are present in the pronuclei region, and the pronuclei are in the oolemma area. The number of NPBs and their position in the pronuclei are two main factors in detecting abnormalities in the zygote area.
The proposed approach uses the template-matching method to find NPBs. Template matching is one of the most common classification methods. This phase is based on cross-correlation to matched templates (Prasad et al., Reference Prasad, Kulkarni and Prasad2009). Our approach uses 100 templates that had been cropped from the images of the dataset. Then, the correlations between each template and the regions of the image were calculated. In this way, the correlation value of each area is saved in a respective one-dimensional array. Equation (4) shows the correlation rate measurement (Powers, Reference Powers2011):
 $$r = {{\mathop \sum \nolimits_m \mathop \sum \nolimits_n \left( {{A_{mn}} - \bar A} \right)\left( {{B_{mn}} - \bar B} \right)} \over {\sqrt {\left( {\mathop \sum \nolimits_m \mathop \sum \nolimits_n {{\left( {{A_{mn}} - \bar A} \right)}^2}} \right)\left( {\mathop \sum \nolimits_m \mathop \sum \nolimits_n {{\left( {{B_{mn}} - \bar B} \right)}^2}} \right)} }}$$
In the above equation, r (i.e. the correlation rate) ranges between −1 (providing no correlation) to +1 (providing complete correlation).
 $\bar A$
and
$\bar A$
and
 $\bar B$
are the mean (average) of the template and candidate image, respectively. m and n also refer to the pixel location of the images. The proposed method uses a threshold value of 11. In other words, the first 11 items of the arranged array are returned as detected NPBs.
$\bar B$
are the mean (average) of the template and candidate image, respectively. m and n also refer to the pixel location of the images. The proposed method uses a threshold value of 11. In other words, the first 11 items of the arranged array are returned as detected NPBs.
Results
The efficiency of the proposed method and its implementation on the dataset were studied. Firstly, the prepared dataset is introduced. Secondly, the results of each stage of the proposed method are shown, then all the results on the database are analyzed. All the algorithms in this research were implemented in MATLAB 2016a software. All these implementations were carried out as a single thread without any parallelization. In this study, we utilized a medium processing power computer with an Intel Core™ 2 Duo Processor P8700 (2.53 GHz) and 4 GB RAM capacity.
Dataset
The data used in this research included 2000 human zygote images selected after obtaining informed consent from patients, and compiled from the IVF centre of Al-Zahra hospital in Rasht, Iran. This study was approved by the ethics committee of Guilan University of Medical Sciences. These images were taken under an inverted microscope, 16–19 h after IVF/ICSI. This microscope was equipped with a charge coupled device (CCD) camera (accompanied) with coloured lenses, and its image resolution was 764 × 576 in RGB colour space. The magnification of the images taken by this microscope is small (×159, ×200). So, the provided images were of low quality. Consequently, the analysis of such images is difficult for embryologists to perform. Some of the aforementioned images are shown in Figure 4.
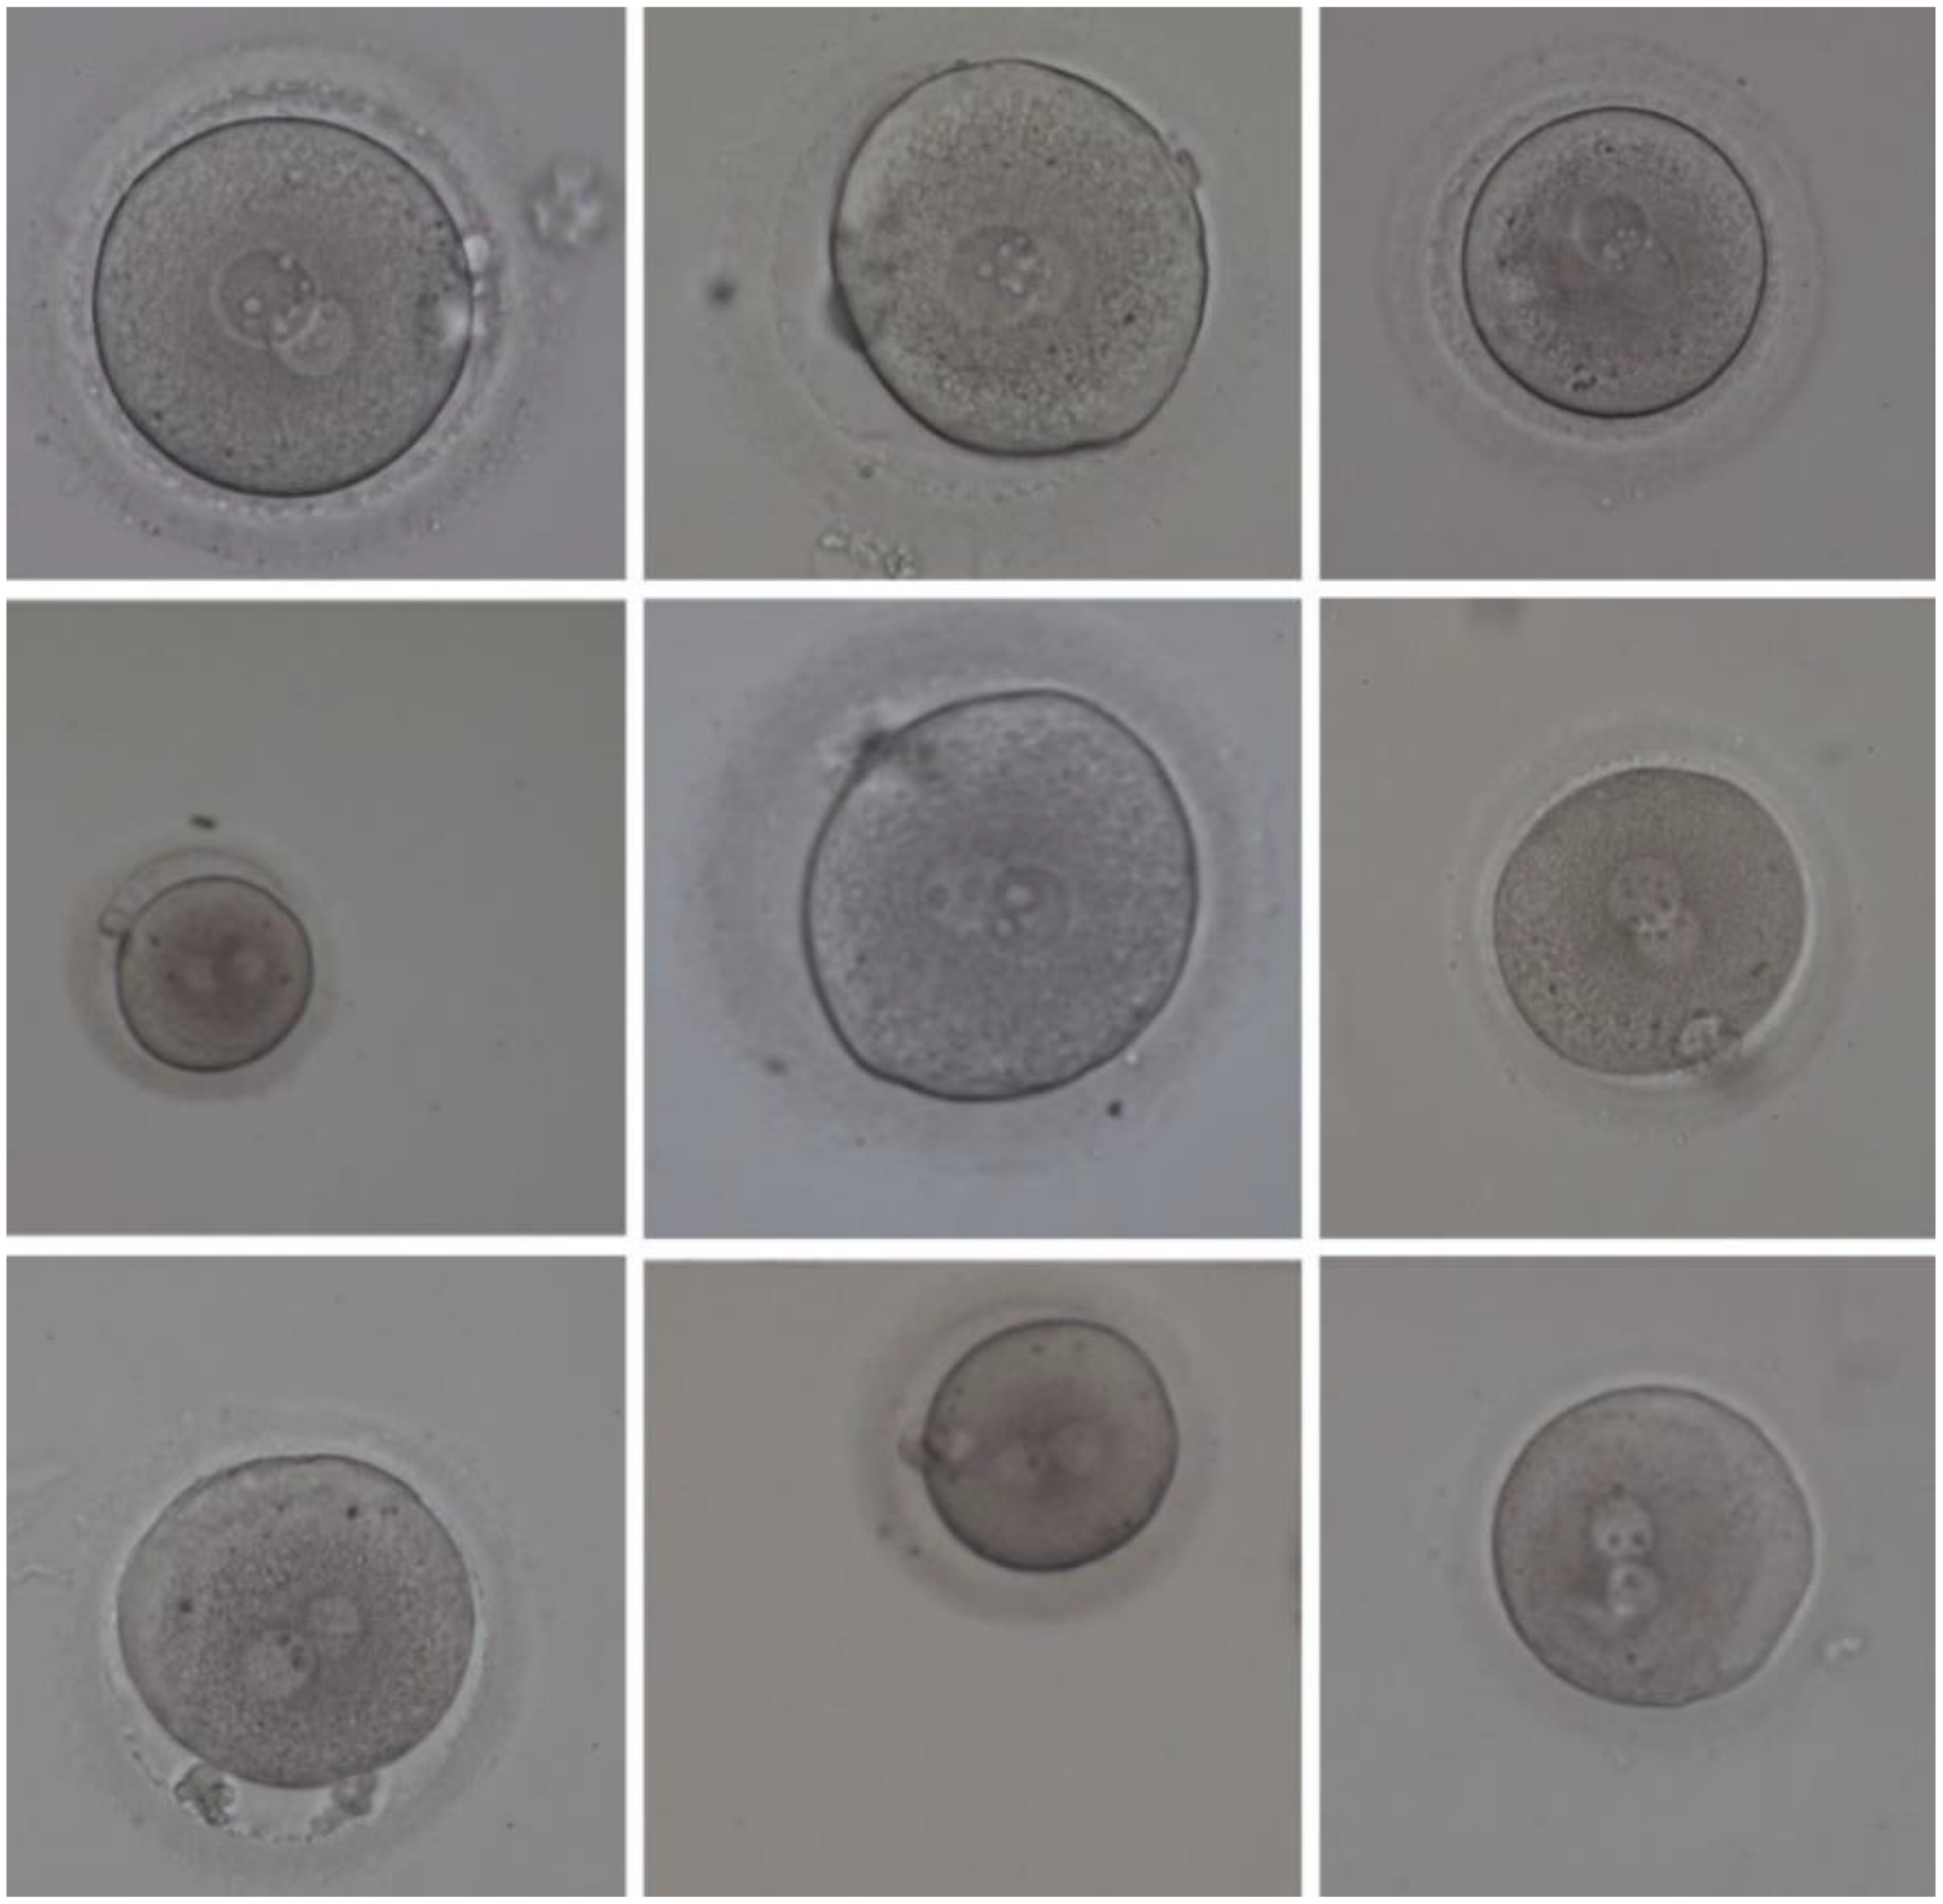
Figure 4. Some samples of the human zygote morphometric evaluation dataset (HZME-DS) images.
As shown in Figure 4, images of the given data were affected by the significant amount of noise and were of low quality. Therefore, some of the critical features for determining a suitable zygote for fertilization were immensely vague and unclear, such that they were not visible even to embryologists. Consequently, presenting a method that can lead to detecting and extracting the zygote vital features with a great chance of success is highly important to improve fertility.
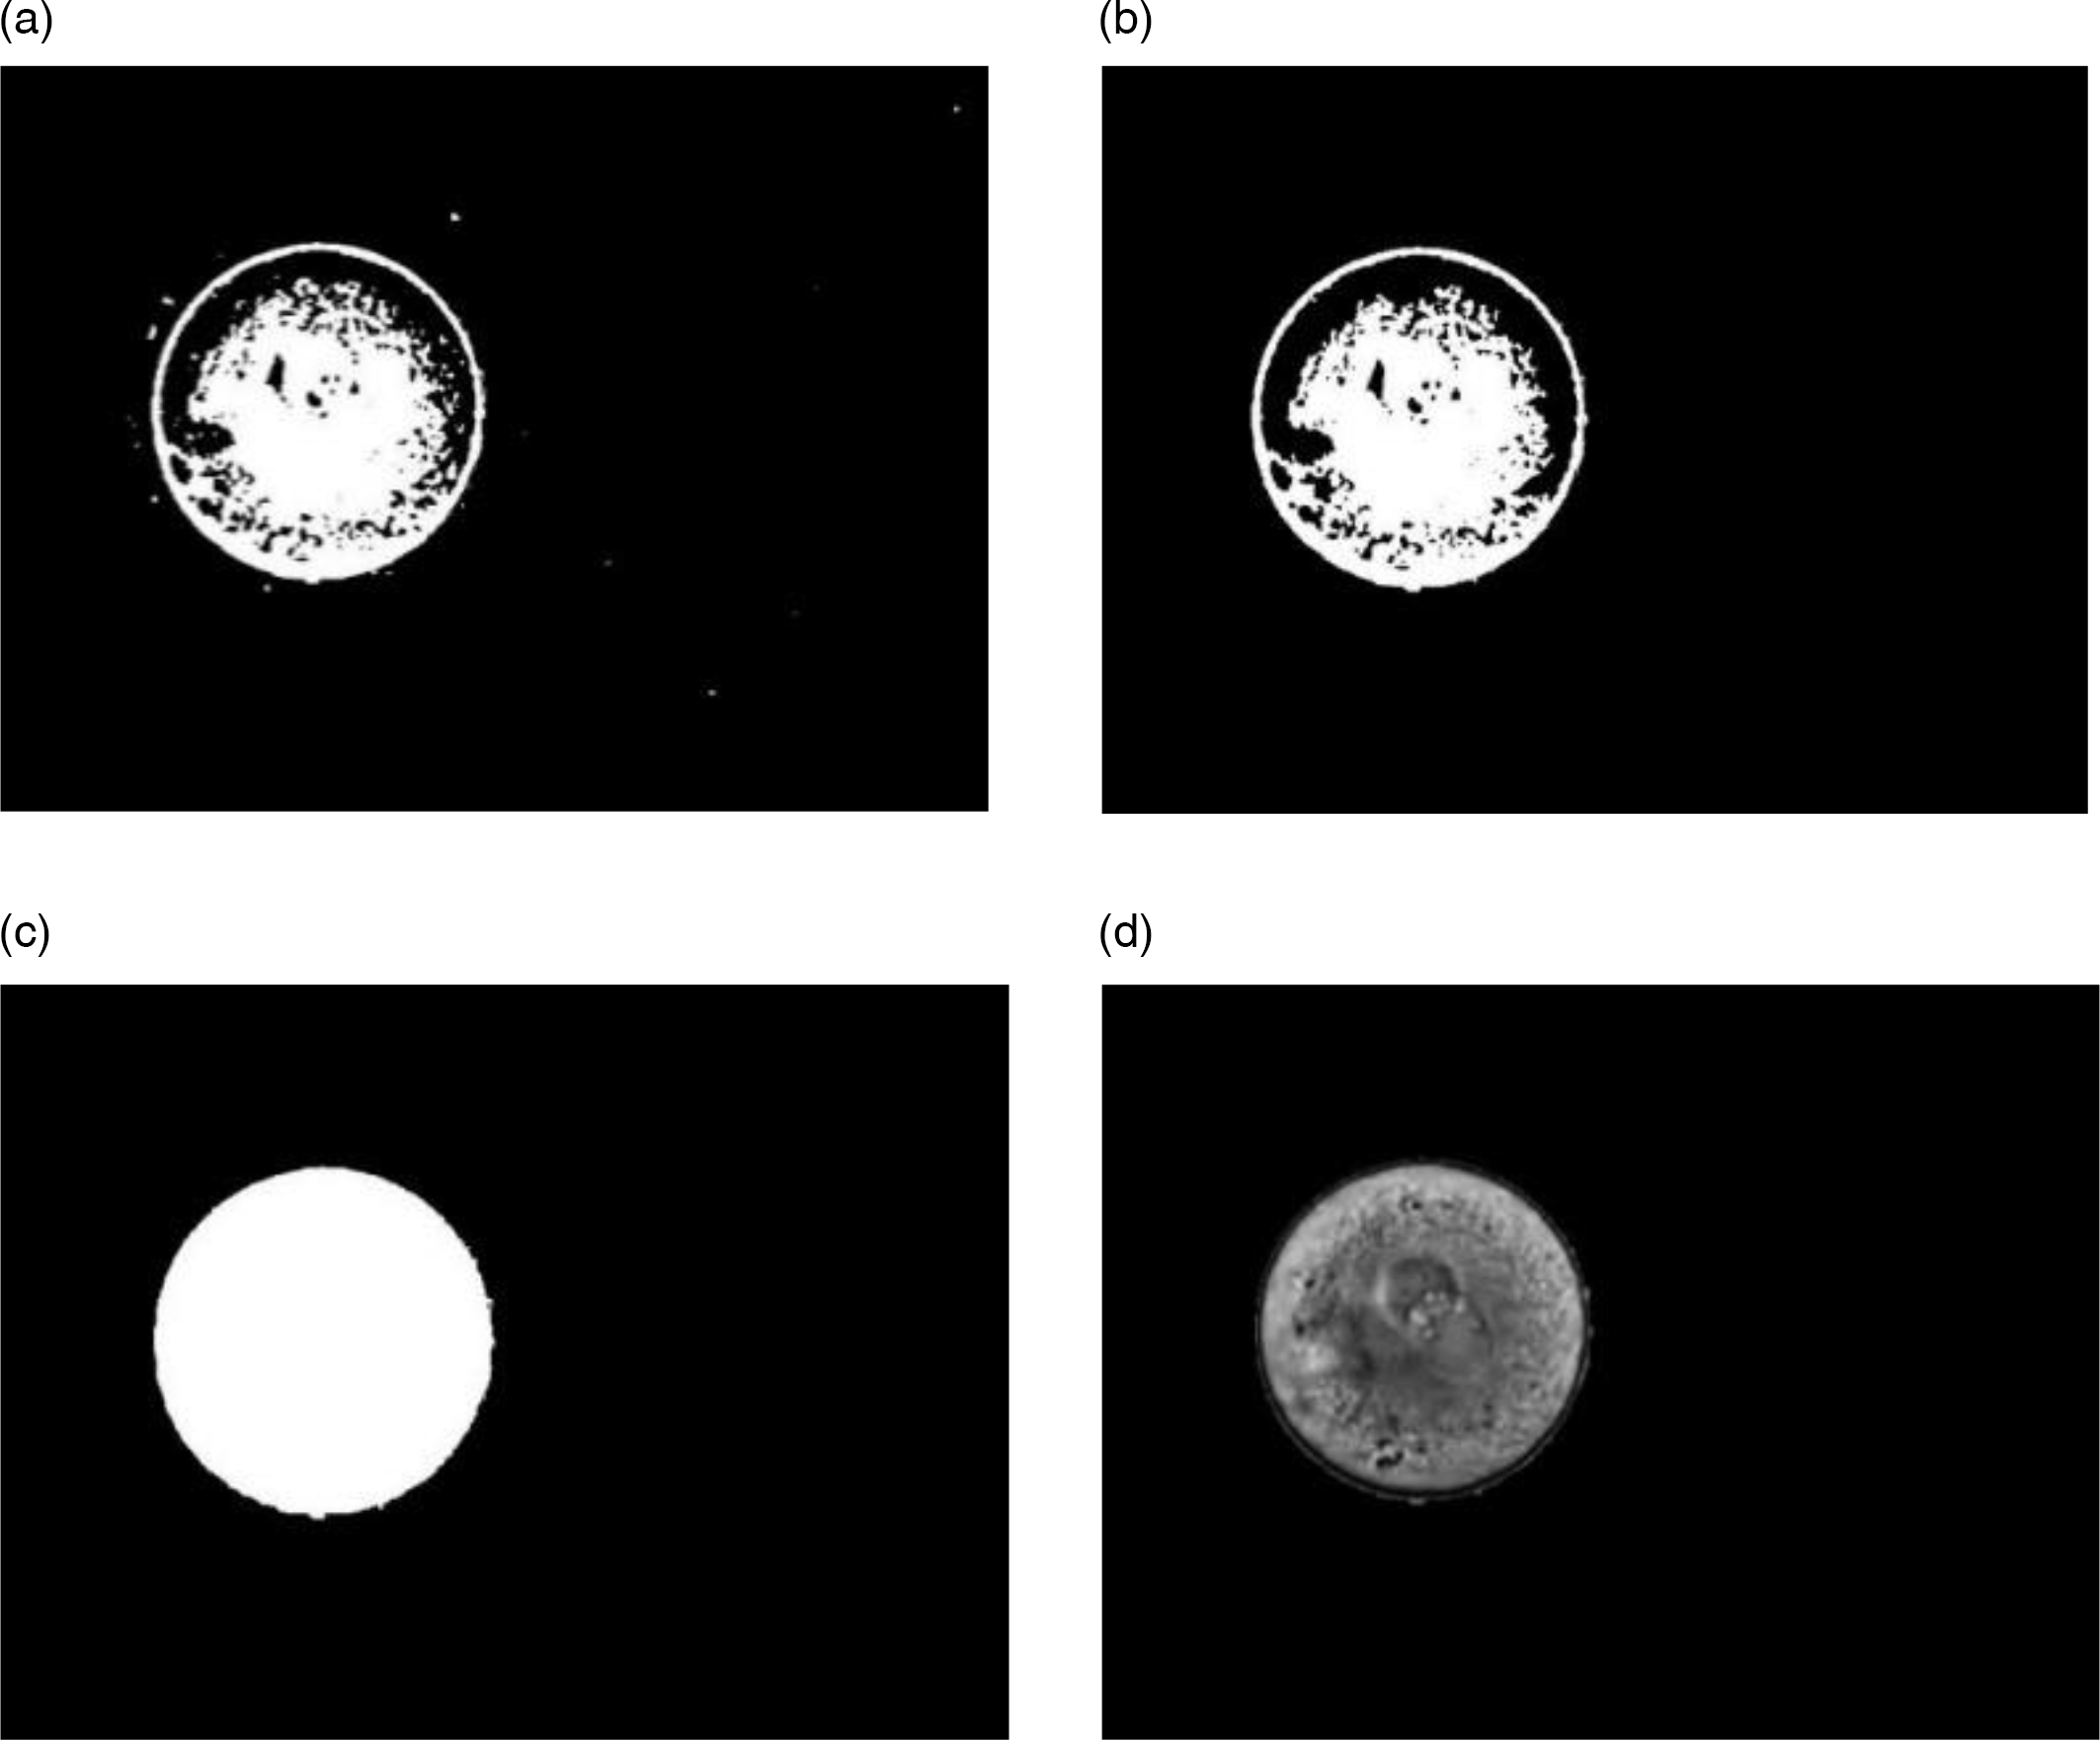
Some of the provided data included some zygote cell images and, in some cells, the required 2PN stage for the continuation of the fertility process was not formed. As a result, to use this dataset in the proposed method, data processing is needed for data integrity, and only valid data will be considered for the dataset. Therefore, after pre-processing, 703 images were retained to be analyzed using the proposed method. Our built dataset was called the human zygote morphometric evaluation dataset (HZME-DS). In all 703 analyzed images, all the areas discovered by the proposed method were tested manually and were given to a recognized expert to evaluate the accuracy of the proposed method. A sample of this manual work is presented in Figure 5, and was performed to be able to compare the manually scored images with images extracted by automated methods. The HZME-DS is freely available for academic purposes at http://nlp.guilan.ac.ir/dataset.aspx.

Figure 5. Extracting the aim regions manually. (a) Extraction of oolemma section/area. (b) Extraction of zona pellucida section. (c) Extraction of the perivitelline space region. (d) Extraction of nucleolar precursor bodies (NPBs).
Evaluation criteria
Four measures, namely TP, FP, TN, and FN, were calculated to evaluate the proposed method. These measures are explained as follows (Han et al., Reference Han, Pei and Kamber2011):
-
TP (True Positive): The number of correctly identified pixels of a certain area.
-
FP (False Positive): The number of incorrectly identified pixels of a certain area.
-
TN (True Negative): The number of correctly identified pixels outside a certain area.
-
FN (False Negative): The number of incorrectly identified pixels outside a certain area.
The performance of the method was studied using a confusion matrix, as shown in Table 1. Every column of the matrix shows the number of predicted samples and every row shows the number of actual samples.
Table 1. Confusion matrix

Recall, Precision and F-measure, which are common for performance evaluation of similar algorithms, are also used in this study. These measures are described in the following equations:
 $$Recall = {{TP} \over {TP + FN}}$$
 $$Precision = {{TP} \over {TP + FP}}$$
 $$F - measure = {{2\;Precision\; \times Recall} \over {Precision\; + \;Recall}}$$
Performance of proposed method:
The results of each step of the proposed method are described in more detail in the following sections.
Output of the pre-processing step
As mentioned in previous paragraphs, one of the most important pre-processing techniques in image processing is reducing noise. This technique can improve the quality of images and removes undesirable noise. Figure 6 shows the outputs of our proposed noise reduction algorithm on a sample from the HZME-DS.

Figure 6. Pre-processing steps: noise reduction. (a) Input image. (b) Converting the colour space from RGB to YCbCr. (c) The Y dimension. (d) Image sharpening. (e) Gaussian filtering. (f) Wavelet transformation.
The input image is shown in Figure 6(a). The colour space of this image is the RGB input space. To use the noise reduction method, the colour space should be first turned to grey space. The output of this process is shown in Figure 6(b). Then, the image is transferred to YCbCr space; the use of the Y dimension is shown in Figure 6(c). As mentioned previously, the correlation among colours is less in this space and this can help the image segmentation and edge-finding processes. The next step is shown in Figure 6(d). In this stage, the sharping process is implemented to make the noise reduction step easier. In the next step, a Gaussian filter is applied, and its output is shown in Figure 6(e). Finally, after completing all the aforementioned steps, wavelet transform is implemented. This step leads to the reduction of the image noise to an acceptable rate. As a result, the input image is ready for the subsequent processing steps. The output of this stage is shown in Figure 6(f).
Output of the oolemma detection step
As explained in the previous paragraphs, the oolemma spot of the zygote area needs to be checked. The steps for oolemma detection are shown in Figure 7. First, the noise-removed image is transferred to a black and white space. The output of this stage is shown in Figure 7(a). Then, as explained, images of small spots are omitted, considering the implemented thresholding. The image that resulted from this stage is shown in Figure 7(b). The next proposed step, in order to produce a uniform image of the oolemma, is to fill the holes that exist in this area to form a binary mask of this particular region. The output of this stage is shown in Figure 7(c). After generating the binary mask, the oolemma region is separated from the original image. So, oolemma detection and extra information are omitted. The result of this stage is shown in Figure 7(d).

Figure 7. Oolemma detection. (a) Converting the colour space to greyscale. (b) Removing small regions. (c) Filling the holes. (d) Oolemma region detected.
Output of the perivitelline space and ZP detection steps
As described before, the proposed method should detect the perivitelline space and the ZP. After oolemma area detection, performed in the previous step, the oolemma region should be subtracted to detect and analyze two areas of the perivitelline space and ZP. Then, as explained before, the FCM method, one of the best well known clustering algorithms, is used to extract and separate the perivitelline space and ZP areas from each other.
As the specified threshold was roughly chosen, clustering was not completely accurate in some images. In this way, in some images, false positives formed in the surrounding areas of the perivitelline space were mistakenly chosen. To improve the performance of the proposed method and reduce the error rate, a threshold value was chosen and, based on this threshold value, the reduction process was implemented. As the threshold value is measured in such a way that the outer part of the perivitelline space is considered in most of the dataset images, the erosion operator aimed to improve the results and reduce the error rate. The output of the proposed method of this stage is shown in Figure 8.

Figure 8. Perivitelline space and zona pellucida detection. (a) Denoized image. (b) FCM output image. (c) Zona pellucida. (d) Perivitelline space.
The output of the pre-processing stage is shown in Figure 8(a), which shows a zygote cell image without noise. As mentioned, the proposed method uses the FCM algorithm to detect perivitelline space and ZP areas then, after clustering to reduce error rate, erosion is performed. The results of the erosion operator after the clustering process are shown in Figure 8(b). Finally, images for the perivitelline space and ZP extraction areas can be seen in Figure 8(c) and 8(d), respectively.
Output of the NPB detection step
The previous stage shows that the proposed method can successfully detect oolemma areas, perivitelline space, and ZP. In this stage, the proposed method should detect real NPBs in pronuclei, which is a critical feature for fertility rate. As the NPBs are found in the 2PN, and this area itself is within the oolemma, our focus should be on the oolemma area to detect the NPBs. Therefore, the output image of the detection phase of the oolemma method is used to detect the NPBs. Consequently, as each image contains several NPBs, and considering the amount of threshold chosen according to the set, all the positions that adapted to the pattern were regarded as NPBs. The patterns used in the adapted pattern method play a crucial role in the precision of this method. This pattern must include all the provided set implemented in the adaption pattern process. The proposed method used 100 patterns for template matching. Next, some samples of the patterns used in this process are presented. One result of the proposed method to detect the NPBs is shown in Figure 9.

Figure 9. NPBs detection. (a) Input image. (b) Detected nucleolar precursor bodies (NPBs).
Result analysis
In the second part of the analysis of the proposed method, the results of the proposed method are described based on standard measures presented previously. To evaluate the detection accuracy of the oolemma spot, perivitelline space, and ZP, after manual extraction of these areas, the accuracy rate of region detection was assessed using this approach by the overlaying the pixels, extracted by the proposed method, on these areas. To evaluate the accuracy of detection for these three areas, first the TP, FP, TN, and FN of each image area were calculated. Then, the F-measure, which is presented in Equation (3), was used. This criterion is made of precision and recall parameters and can also explain the harmonic average of these two. This criterion can determine how successful was the proposed method for accurate detection of each of oolemma area, ZP, and perivitelline space. The average results of the detection precision of these three areas are presented in Table 2. As shown in this table, the proposed method can detect all the oolemma areas, perivitelline spaces, and ZPs, and was done completely automatically with an ∼80% success rate.
Table 2. F-measure value for oolemma detection, zona pellucida, and the perivitelline space

In another analysis, as shown in Table 3, the accuracy of detecting these three regions was categorized in 90, 85, 80, 75, and 70% intervals. Each of these categories presents the percentage of accurate detection for these areas. For example, the first category row includes the accurate detection algorithm of at least 70%. The second category shows an accurate detection algorithm of at least 75%. The percentage indicates the success of the proposed method in accurately detecting each of these categories. For example, as can be seen in Table 3, the proposed method was able to determine the ZP areas of 508 images (72.26%) from the HZME-DS with at least 70% accuracy.
Table 3. Accuracy of oolemma, zona pellucida, and perivitelline space detection

Precision and Recall equations were used to study the accuracy of the proposed method in detecting the NPBs after calculating the TP, FP, TN, and FN criteria. The results for the accurate determination of NPB detection are shown in Figure 10.

Figure 10. Accuracy of nucleolar precursor body (NPB) detection.
As presented in Figure 10, the average of the proposed method accuracy in detecting NPBs was 81.14%. In other words, the method was able to accurately detect areas that were NPBs. Also, as in Figure 10, the precision average of the proposed approach for detecting NPBs was 79.53%. As the original images from the dataset were of low quality and contained noise, the edges of the area could not be determined accurately, even by expert embryologists in many cases. Therefore, some error around the edge of the specific area of the proposed method was inevitable.
Discussion
The efficiency of IVF treatment is poor, and may result in multiple pregnancies, or may require more than one cycle to achieve pregnancy. The proposed method was applied to two-pronucleus zygote (2PN) images to help embryologists select the embryos with the highest implantation probability, by providing morphological measurements of zygotes. The dataset images were subject to severe noise conditions, therefore the first part of the proposed method was a noise reduction step. The algorithm succeeded in reducing the noise levels of the dataset images to a great extent. After the noise reduction step, the proposed method automatically identified the oolemma, ZP, and perivitelline space regions and NPBs, which are indicators of embryo viability and normality. To the best of our knowledge, there has not been any previous procedure using 2PN images in a fully automated analysis system on such a large dataset; Most existing research has described small datasets, and there has not been any fully automated method for human zygotes that could evaluate all the analyzed measures. Therefore, a manual dataset was created, explained previously, to analyze the accuracy of this method.
A recent study created an algorithm to evaluate the zygote cytoplasm based on a convolutional neural network (CNN) (Zhao et al., Reference Zhao, Li, Li, Li, Luo, Li, Lee, Wang and Chan2021). In that study, first the group segmented the cytoplasmic area of the zygote, then they recognized the irregular zygotes. To do this, they labelled the shape regularity (regular, irregular) of 8377 zygote images and used them as input to the CNN segmentation they proposed. In that study, they only evaluated the irregularity of the cytoplasmic area of the zygote, whereas there are other key features in the zygote image possible to show its quality (Scott et al., Reference Scott, Alvero, Leondires and Miller2000). Another study used computer vision image-processing methods and deep learning techniques together to predict embryo viability (VerMilyea et al., Reference VerMilyea, Hall, Diakiw, Johnston, Nguyen, Perugini, Miller, Picou, Murphy and Perugini2020). However, this study worked on day-5 blastocyst images that are very different from the zygote stage and cannot be compared with the proposed method. In almost all other existing methods, algorithms were implemented on small datasets, however the proposed method works on a relatively large dataset, which could be more reliable.
In conclusion, the proposed algorithm represents a new automated and robust method for evaluating embryos to aid IVF techniques. This method could be very reliable as it covers the most important morphological characteristics of the human zygote cell. It was tested on a large dataset of 703 images collected from an IVF clinical centre. Extracting the most important human zygote cell image features has important implications for the analysis of human zygote cells to improve IVF outcomes and this serves as an important lens for future research on scoring zygote cells.
There is a limitation to this study that presents opportunities for future research. This method was unable to detect the pronuclei region automatically. We hope to overcome this hurdle in our future research. As the proposed method succeeded in diagnosing the important features of the zygote cells that determine the fertility rate, future work can focus on scoring the zygote cell by relying on these morphometric evaluations.
Financial support
This research received no specific grant from any funding agency, commercial or not-for-profit sectors.
Conflict of interest
The authors declare that they have no competing interests.
Ethical Standards
This study was approved by the ethics committee of Guilan University of Medical Sciences, Rasht, Iran.