


I. INTRODUCTION
Choline fenofibrate (the choline salt of fenofibric acid), marketed as Trilipix®, is a lipid regulating agent available as delayed release capsules for oral administration. It is generally used for the management of low-density lipoprotein cholesterol to reduce triglycerides and increase the quantity of high-density lipoprotein cholesterol in the blood. Trilipix can be used alone or in conjunction with statins in the treatment of hypercholesterolemia and hypertriglyceridemia. The choline salt of fenofibric acid was first disclosed in US Patent 7,259,186 (Clink et al., Reference Clink, Paterson, Gao, Zhang, Long, Morris and Rosenberg2007; Abbott Laboratories), and a crystalline form A was claimed in US Patent 2011/0288331 (Ponnaiah et al., Reference Ponnaiah, Desai, Rathod, Katariya, Bhimani and Modi2011; Alembic Pharmaceuticals, Ltd.). The systematic name (CAS Registry Number 856676-23-8) is 2-hydroxy-N,N,N-trimethylethanaminium 2-[4-(4-chlorobenzoyl)phenoxy]-2-methylpropanoate. A two-dimensional molecular diagram is shown in Figure 1. After this work was completed, the morphology of choline fenofibrate was described by Bordawekar et al. (Reference Bordawekar, Kuvadia, Dandekar, Mukherjee and Doherty2014), and the crystal structure included in the Cambridge Structural Database (Groom and Allen, Reference Groom and Allen2014) as Refcode KUKYUM.
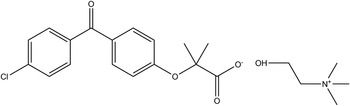
Figure 1. The molecular structure of choline fenofibrate.
The presence of high-quality reference powder patterns in the PDF™ (Powder Diffraction File; ICDD, 2014) is important for phase identification, particularly by pharmaceutical, forensic, and law enforcement scientists. The crystal structures of a significant fraction of the largest dollar volume pharmaceuticals have not been published, and thus calculated powder patterns are not present in the PDF-4 databases. Sometimes experimental patterns are reported, but they are generally of low quality. This structure is a result of a collaboration among ICDD, Illinois Institute of Technology (IIT), Poly Crystallography Inc., and Argonne National Laboratory to measure high-quality synchrotron powder patterns of commercial pharmaceutical ingredients, include these reference patterns in the PDF, and determine the crystal structures of these Active Pharmaceutical Ingredients (APIs).
Even when the crystal structure of an API is reported, the single-crystal structure was often determined at low temperature. Most powder diffraction measurements are performed at ambient conditions. Thermal expansion (generally anisotropic) means that the peak positions calculated from a low-temperature single-crystal structure often differ significantly from those measured at ambient conditions. These peak shifts can result in failure of default search/match algorithms to identify a phase, even when it is present in the sample. High-quality reference patterns measured at ambient conditions are thus critical for easy identification of APIs using standard powder diffraction practices.
II. EXPERIMENTAL
Choline fenofibrate was commercial reagent (M.P. 206–212 °C), purchased from Toronto Research Chemicals (lot# 1-GUY-9-1), and was used as-received. The white powder was packed into a 1.5 mm diameter Kapton capillary, and rotated during the measurement at ~50 cycles s−1. The powder pattern was measured at 295 K at beam line 11-BM (Lee et al., Reference Lee, Shu, Ramanathan, Preissner, Wang, Beno, Von Dreele, Ribaud, Kurtz, Antao, Jiao and Toby2008; Wang et al., Reference Wang, Toby, Lee, Ribaud, Antao, Kurtz, Ramanathan, Von Dreele and Beno2008) of the Advanced Photon Source at Argonne National Laboratory using a wavelength of 0.413 685 Å from 0.5 to 50°2θ with a step size of 0.001° and a counting time of 0.1 s step−1. The pattern was indexed on a primitive orthorhombic unit cell having a = 12.337, b = 28.561, c = 12.022 Å, V = 4236.0 Å3, and Z = 8 using Jade 9.5 (MDI, 2014). The space group was suggested to be Pbca, which was confirmed by successful solution and refinement of the structure. A reduced cell search in the Cambridge Structural Database (Groom and Allen, Reference Groom and Allen2014) combined with the chemistry “C H N O Cl only” yielded two hits, but no structure for choline fenofibrate; the same search in the 2016 release of the CSD yields KUKYUM (Bordawekar et al., Reference Bordawekar, Kuvadia, Dandekar, Mukherjee and Doherty2014). A name search on “fenofibrate” yielded hits for ethyl fenofibrate (Yang and Wang, Reference Yang and Wang2012; PAWFUQ) and isopropyl fenofibrate (Henry et al., Reference Henry, Zhang, Gao and Buckner2003, TADLIU; Balendiran et al., Reference Balendiran, Rath, Kotheimer, Miller, Zeller and Rath2012, TADLIU01 and TADLIU02). A connectivity search on the fenofibrate backbone yielded these two hits, plus the methyl ester (Zou et al., Reference Zou, Fang, Zhong, Guo and Wei2012, PAVPUZ) and fenofibric acid (Rath et al., Reference Rath, Haq and Balendiran2005, QANHUJ).
A choline cation and a fenofibrate anion were built and their conformations optimized using Spartan '14 (Wavefunction, 2013), and saved as mol2 files. These files were converted into Fenske–Hall Z-matrix files using OpenBabel (O'Boyle et al., Reference O'Boyle, Banck, James, Morley, Vandermeersch and Hutchison2011). Using these two fragments, the structure was solved with FOX (Favre-Nicolin and Černý, Reference Favre-Nicolin and Černý2002). One of the solutions had a much lower cost factor than the other nine.
Rietveld refinement was carried out using GSAS (Toby, Reference Toby2001; Larson and Von Dreele, Reference Larson and Von Dreele2004). Only the 1.0°–25.0° portion of the pattern was included in the refinement (d min = 0.955 Å). All non-H bond distances and angles were subjected to restraints, based on a Mercury/Mogul Geometry Check (Bruno et al., Reference Bruno, Cole, Kessler, Luo, Motherwell, Purkis, Smith, Taylor, Cooper, Harris and Orpen2004; Sykes et al., Reference Sykes, McCabe, Allen, Battle, Bruno and Wood2011) of the molecule. The Mogul average and standard deviation for each quantity were used as the restraint parameters. The restraints contributed 0.60% to the final χ2. The C1–H10 and C14–H23 benzene rings were refined as rigid bodies. Isotropic displacement coefficients were refined, grouped by chemical similarity. The hydrogen atoms were included in calculated positions, which were recalculated during the refinement. The U iso of each hydrogen atom was constrained to be 1.3× that of the heavy atom to which it is attached. The peak profiles were described using profile function #4 (Thompson et al., Reference Thompson, Cox and Hastings1987; Finger et al., Reference Finger, Cox and Jephcoat1994), which includes the Stephens (Reference Stephens1999) anisotropic strain broadening model. The background was modeled using a three-term shifted Chebyshev polynomial, with a four-term diffuse scattering function to model the Kapton capillary and any amorphous component. The final refinement of 85 variables using 23 045 observations (23 002 data points and 43 restraints) yielded the residuals R wp = 0.100, R p = 0.081, and χ 2 = 3.423. The largest peak (0.58 Å from Cl11) and hole (1.95 Å from Cl11) in the difference Fourier map were 0.84 and −0.70 e(Å)−3, respectively. The Rietveld plot is included as Figure 2. The largest errors are in the shapes of the low-angle peaks, and may indicate subtle changes in the sample during the measurement.
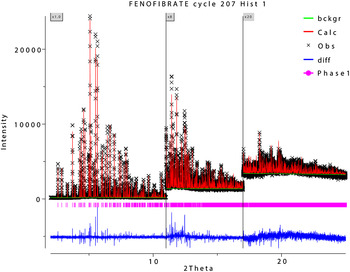
Figure 2. (Color online) The Rietveld plot for the refinement of choline fenofibrate. The black crosses represent the observed data points, and the red line is the calculated pattern. The blue curve is the difference pattern, plotted at the same vertical scale as the other patterns, and the green line is the background. The vertical scale has been multiplied by a factor of 8 for 2θ > 11.0°, and by a factor of 20 for 2θ > 17.0°.
A density functional geometry optimization (fixed experimental unit cell) was carried out using CRYSTAL09 (Dovesi et al., Reference Dovesi, Orlando, Civalleri, Roetti, Saunders and Zicovich-Wilson2005). The basis sets for the H, C, N, and O atoms were those of Gatti et al. (Reference Gatti, Saunders and Roetti1994), and the basis set for Cl was that of Apra et al. (Reference Apra, Causa, Prencipe, Dovesi and Saunders1993). The calculation used 8 k-points and the B3LYP functional, and took ~37 days on a 2.4 GHz PC.
III. RESULTS AND DISCUSSION
The powder pattern does not correspond to the ones reported for choline fenofibrate polymorphs (Ponnaiah et al., Reference Ponnaiah, Desai, Rathod, Katariya, Bhimani and Modi2011). The refined atom coordinates of choline fenofibrate are reported in Table I, and the coordinates from the density functional theory (DFT) optimization in Table II. The root-mean-square (rms) deviation of the non-hydrogen atoms in the fenofibrate is 0.057 Å, and in the choline is 0.043 Å (Figure 3). This excellent agreement between the refined and optimized structures is strong evidence that the experimental structure is correct (van de Streek and Neumann, Reference van de Streek and Neumann2014). The major differences are in the orientations of the methyl hydrogen atoms, which are expected since they were included in the refinement in calculated positions. Compared with the single-crystal structure KUKYUM, the rms displacement of the fenofibrate is 0.052 Å and of the choline is 0.029 Å; the molecular structures are essentially identical. The unit cells and structures were determined at slightly different temperatures (Table III). The c-axes differ the most, but it is unclear whether the difference represents anisotropic thermal expansion or merely differences in samples. This discussion uses the DFT-optimized structure. The asymmetric unit (with atom numbering) is illustrated in Figure 4, and the crystal structure is presented in Figure 5.

Figure 3. (Color online) Comparison of the refined and optimized structures of choline fenofibrate. The Rietveld refined structure is in red, and the DFT-optimized structure is in blue.

Figure 4. (Color online) The molecular structure of choline fenofibrate, with the atom numbering. All atoms are represented by 50% probability spheroids.

Figure 5. (Color online) The crystal structure of choline fenofibrate, viewed down the c-axis. The hydrogen bonds are shown as dashed lines.
Table I. Rietveld refined crystal structure of choline fenofibrate.

Table II. DFT-optimized (CRYSTAL09) crystal structure of choline fenofibrate.
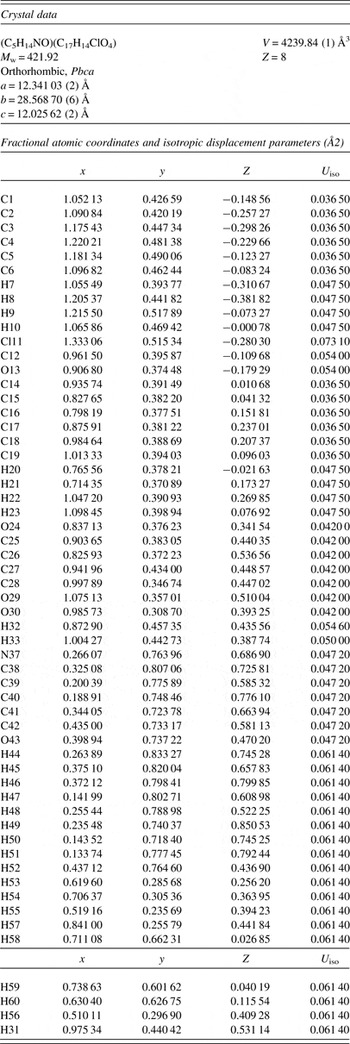
Table III. Lattice parameters of choline fenofibrate at two temperatures. KUKYUM used a different choice of axes, but the space group in both cases is Pbca; the lattice transformation does not change the short Hermann-Mauguin symbol.

All the bond distances, angles, and torsion angles fall within the normal ranges indicated by a Mercury Mogul Geometry check (Macrae et al., Reference Macrae, Bruno, Chisholm, Edington, McCabe, Pidcock, Rodriguez-Monge, Taylor, van de Streek and Wood2008). A quantum mechanical conformation examination (DFT/B3LYP/6-31G*/water) using Spartan '14 indicated that the observed conformation of the fenofibrate anion is ~2.4 kcal mole−1 higher in energy than a local minimum. A molecular mechanics (MMFF) sampling of conformational space indicated that the solid-state conformation is within 0.1 kcal mole−1 of the minimum energy conformation. The fenofibrate anion is in very close to its minimum-energy conformation in the solid state.
Analysis of the contributions to the total crystal energy using the Forcite module of Materials Studio (Accelrys, 2013) suggests that the intramolecular deformation energy contains significant contributions from bond, angle, and torsion angle distortion terms. The intermolecular energy is dominated by electrostatic contributions, which in this force-field-based analysis include hydrogen bonds, although van der Waals attraction is also significant. The hydrogen bonds are better analyzed using the results of the DFT calculation.
As might be expected, the hydroxyl group of the choline anion makes a strong hydrogen bond to the ionized carboxylate group of the fenofibrate anion (Table IV). This O–H···O hydrogen bond contributes ~15.2 kcal mole−1 to the crystal energy. These hydrogen bonds are discrete, having a graph set D1,1(2) (Etter, Reference Etter1990; Bernstein et al., Reference Bernstein, Davis, Shimoni and Chang1995; Shields et al., Reference Shields, Raithby, Allen and Motherwell2000). Together with the C–H···O hydrogen bonds, these link the cations and anions into layers parallel to the ac-plane. Between these layers there are layers of phenyl/chlorine contacts. Van der Waals attraction among the phenyl rings seems important to the crystal energy.
Table IV. Hydrogen bonds in the DFT-optimized crystal structure of choline fenofibrate.

The volume enclosed by the Hirshfeld surface (Figure 6; Hirshfeld, Reference Hirshfeld1977; McKinnon et al., Reference McKinnon, Spackman and Mitchell2004; Spackman and Jayatilaka, Reference Spackman and Jayatilaka2009; Wolff et al., Reference Wolff, Grimwood, McKinnon, Turner, Jayatilaka and Spackman2012) is 520.90 Å3, 98.3% of one-eighth the unit-cell volume. The molecules are thus not tightly packed. The only significant close contacts (red in Figure 6) involve the hydrogen bonds.
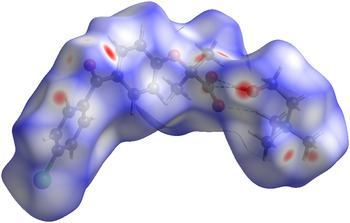
Figure 6. (Color online) The Hirshfeld surface of choline fenofibrate. Intermolecular contacts longer than the sums of the van der Waals radii are colored blue, and contacts shorter than the sums of the radii are colored red. Contacts equal to the sums of radii are white.
The Bravais–Friedel–Donnay–Harker (Bravais, Reference Bravais1866; Friedel, Reference Friedel1907; Donnay and Harker, Reference Donnay and Harker1937) morphology suggests that we might expect platy morphology for choline fenofibrate, with {010} as the principal faces. The more-sophisticated treatment of Bordawekar et al. also yields thick plates with {010} (our axes) as the principal faces. A fourth-order spherical harmonic preferred orientation model was included in the refinement; the texture index was only 1.019, indicating that preferred orientation was not significant in this rotated capillary specimen. The powder diffraction pattern of choline fenofibrate is included in the PDF as entry 00-065-1410.
SUPPLEMENTARY MATERIAL
The supplementary material for this article can be found at http://dx.doi.org/10.1017/S0885715616000099
ACKNOWLEDGEMENTS
Use of the Advanced Photon Source at Argonne National Laboratory was supported by the U. S. Department of Energy, Office of Science, Office of Basic Energy Sciences, under Contract No. DE-AC02-06CH11357. This work was partially supported by the International Centre for Diffraction Data. We thank Lynn Ribaud for his assistance in data collection.


