


INTRODUCTION
Perennial ryegrass (Lolium perenne L.) is suited to many intensive ruminant production systems in temperate climates due to its high yield potential, persistency under grazing (Tallowin et al. Reference Tallowin, Brookman and Santos1995) and high digestibility (Wilkins Reference Wilkins1997). These traits contribute to its potential to reduce feed costs (Finneran et al. Reference Finneran, Crosson, O'Kiely, Shalloo, Forristal and Wallace2011) and its majority representation in reseed mixtures (Rath & Peel Reference Rath, Peel and McGilloway2005).
National perennial ryegrass variety evaluation schemes assess the relative agronomic performance of a large number of varieties, and only a select few that represent the most elite performing varieties are eventually recommended to farmers. Recommendations are primarily based on seasonal and annual herbage yield, persistence and, to a lesser extent, nutritive quality (Grogan & Gilliland Reference Grogan and Gilliland2011). Within the Irish Recommended List, perennial ryegrass varieties are categorized into three maturity groups based on mean heading date (DAFM 2012), and these groups differ in their suitability for meeting specific farming requirements (Frame Reference Frame1991; Gilliland et al. Reference Gilliland, Camlin and Johnston1995; Laidlaw Reference Laidlaw2004). Varieties are also categorized as either diploid or tetraploid and each of these types also has its own niche role in farming enterprises (Gilliland et al. Reference Gilliland, Barrett, Mann, Agnew and Fearon2002).
The agronomic quality of perennial ryegrass is difficult to define as swards may have several functions (e.g. grazing, conservation or both) and ultimately forage quality is expressed through animal productivity rather than simply indices measured in the laboratory (Casler Reference Casler2001; Wilkins & Humphreys Reference Wilkins and Humphreys2003; Humphreys Reference Humphreys2005). These self-regenerating swards are harvested several times a year (Camlin Reference Camlin and Weddell1997), and a loss in productivity or nutritive quality at one harvest may be compensated for at a later harvest (Gilliland Reference Gilliland1997). Consequently, grass quality needs to be assessed throughout the growing season if a balanced overall judgement is to be made on a variety.
A major role of grass is to support animal production and its nutritive value is fundamental to fulfilling this requirement. In vitro content of digestible dry matter (CDDM) has been cited as the single best indicator of nutritional value (Casler Reference Casler2001; Wilkins & Humphreys Reference Wilkins and Humphreys2003), since it influences both grass intake and energy availability (Wilkins & Humphreys Reference Wilkins and Humphreys2003). Thus, for example, Casler & Vogel (Reference Casler and Vogel1999) reported an average 3·2% increase in live weight gain by beef cattle per 1% increase in grass digestibility.
Crude protein (CP) in grass is a major source of nitrogen for protein synthesis by microbes in the rumen. In grazed swards, perennial ryegrass CP concentration is relatively high among forages and is invariably above the threshold of 80 g CP/kg DM required for rumen function (Coleman & Moore Reference Coleman and Moore2003).
Water-soluble carbohydrate (WSC) concentration has attracted the attention of grass breeders and a sufficient increase in its concentration can increase intake and improve animal productivity (Humphreys Reference Humphreys1989). Miller et al. (Reference Miller, Moorby, Davies, Humphreys, Scollan, MacRae and Theodorou2001) reported an additional 2·7 kg daily milk yield when a perennial ryegrass variety with an additional 39 g WSC/kg DM rather than a control variety was supplied to late lactation heifers.
Conservation of ryegrass (e.g. as silage) provides the opportunity to fill seasonal gaps in feed availability (O'Kiely & Kaiser Reference O'Kiely, Kaiser and McGilloway2005). However, despite the widespread use of silage making on farms, insufficient attention is paid to the ensilability properties of grass varieties in national variety evaluation schemes (Conaghan et al. Reference Conaghan, O'Kiely, Howard, O'Mara and Halling2008a). Both WSC, the primary source of fermentable substrate during ensilage, and buffering capacity, which indicates the amount of fermentation acids and thus of fermentable substrate required, combine to provide such information (Buxton & O'Kiely Reference Buxton, O'Kiely, Buxton, Muck and Harrison2003).
An understanding of the relationships between maturity and ploidy groupings for herbage yield and quality traits of perennial ryegrasses from a national variety evaluation scheme would facilitate the selection of varieties particularly suited to specific farm enterprise requirements.
Objectives
The primary objective of the present study was to assess the differences in four quality characteristics (in vitro CDDM, WSC, CP and buffering capacity) and herbage yield for maturity, ploidy and age of sward groups of perennial ryegrass varieties undergoing assessment in a national variety evaluation scheme.
MATERIALS AND METHODS
Field plots
Field trials were carried out at the Grass and Clover Variety Evaluation Centre at Backweston, Co. Kildare, Ireland (53°26′N, 06°30′W, 50 m asl). The soil type is a clay loam with a pH of 7·2 and 63 g/kg organic matter (Grogan & Gilliland Reference Grogan and Gilliland2011). The trials were carried out for the Grass and Clover Recommended List Varieties for Ireland (DAFM 2012) under an established protocol (Grogan & Gilliland Reference Grogan and Gilliland2011).
Plot management
Perennial ryegrass varieties were arranged into three separate maturity groups (early, intermediate and late) based on mean date of ear emergence. Both intermediate and late groups were sown in separate trials each year while the early group was sown in alternate years. In late summer, plots (7·0×1·5 m) were sown as monocultures of perennial ryegrass varieties in the year prior to first harvest at a sowing rate of 31·0 and 41·0 kg/ha for diploids and tetraploids, respectively. Within each maturity group, plots were sown in a randomized complete block design with four replicate blocks. Inorganic nitrogen fertilizer was applied at an annual rate of 350 kg N/ha in all harvest years except for 2006, when 400 kg N/ha was applied. An initial 40 kg N/ha was applied in February and with 100–110, 90–110, 50–60, 35–45 and 25–35 kg N/ha applied after the first five harvests, sequentially.
The current study comprised 5 years of sowings (2001, 2002, 2004, 2005 and 2006) and each new set of plots was harvested in the two subsequent years, except for the sowings in 2002 and 2004 when only one subsequent harvest year was available for analysis (see Fig. 1). A total of 1208 plots were sown across the five sowing years. Each of these plots was harvested six or seven times throughout a growing season, in one or two harvest years resulting in a total of 11580 plots harvested.

Fig. 1. Schematic outline of sowing and harvest year schedule used for analyses A and B. S, year of sowing; H1, year of first full season after sowing; H2, year of second full season after sowing.
In each harvest year, plots underwent combined simulated grazing and conservation management. The first harvest was targeted for early April; however, if there were good growing conditions earlier in the season an additional harvest may have been taken prior to April. Each maturity group was harvested individually based on the productivity on plots, with a maximum gap of 1 week between early and late groups. The initial harvest(s) simulated spring grazing and the next two simulated conservation harvests taken at 7- and 6-week re-growth intervals, respectively. The final three harvests simulated grazing and were then taken after 4-, 5- and 6-week re-growth intervals. These were the targeted harvest intervals throughout the study; however, the targets were adjustable over the course of the study to reflect the changing weather and growing conditions. Plots were harvested to a stubble height of 50 mm above ground level using a Haldrup harvester (Haldrup, Logstor, Denmark) and herbage yield was estimated via an on-board weighing scale. A sample of c. 300 g from each plot was oven dried at 80 °C for 16 h to determine dry-matter concentration. These were subsequently milled (Retch SM 100) through a 1 mm pore sieve prior to analysis of quality traits using near infrared reflectance spectroscopy (NIRS).
NIRS calibration
The NIRS calibrations were independently developed using 2076 samples that included a subset of the above perennial ryegrass samples as well as comparable Italian and hybrid ryegrass samples. These samples encompassed the range of climatic conditions, species, maturity, ploidy, genotype and age of sward occurring at this site. Absorbance (log 1/reflectance) was measured from 400 to 2500 nm at 2 nm intervals using a NIRsystems 6500 or a standardized NIRsystems XDS (Foss UK Ltd, Warrington, UK).
Laboratory analysis
Each of the 2076 samples were analysed for four quality traits using reference methods. Buffering capacity was measured according to Playne & McDonald (Reference Playne and McDonald1966), while CP (N×6·25) was determined using method 990-03 of the Association of Analytical Chemists (AOAC 1990) with a LECO FP-428 (Leco Corporation, St. Joseph, MI, USA). In vitro CDDM was assessed using the two-stage technique of Tilley & Terry (Reference Tilley and Terry1963) modified by the final residue being isolated by filtration, and the automated anthrone method (Thomas Reference Thomas1977) was used to determine WSC concentration.
Chemometrics
Chemometric techniques were applied to the NIR spectra using WinISI version 4·00 (Infrasoft International, Port Matilda, PA, USA). Calibrations were developed across the wavelength range of 1108–2498 nm at 2 nm intervals. Permutations of several different chemometric techniques were applied to the spectra to form the calibration models. The spectra had two spectral pre-treatments, each with two options, applied prior to the application of regression techniques: (a) a scatter correction treatment of standard normal variate and de-trending (SNV-D; Barnes et al. Reference Barnes, Dhanoa and Lister1989) was applied to spectra or no scatter correction treatment was applied, and (b) a curve smoothing of 1, 4, 4 or 2, 5, 10 derivations was carried out on the spectra, where the first value denotes the derivate, the second value denotes the gap over which the derivate is calculated and the third value denotes the number of data points. Three regression techniques (modified partial least squares, partial least squares and principal component regression) were then used to relate the reference data to the spectra. These combinations of spectral pre-treatments and regression techniques resulted in 12 permutations of calibration models per quality trait. Outliers were removed from each calibration model on the basis of chemical residual T>2·5 or spectral global H>10·0 using the WinISI software. A cross-validation was carried out in which 0·20 of the full calibration set was randomly removed as a validation set. The remaining samples were then used to form a new calibration model and this model was applied to the validation set. This process was repeated five times and optimal calibration models were selected on the basis of high R 2 and low standard errors of cross-validation (Burns et al. Reference Burns, Gilliland, Grogan and O'Kiely2011).
Statistical analysis
Since not all varieties were sown every year, the data were analysed using two separate analyses to optimize the use of information from the database. Analysis A comprised both the intermediate and late groups sown in 2001, 2005 and 2006 and harvested in each of the two subsequent years (Fig. 1). Analysis B comprised the early, intermediate and late groups sown in 2002, 2004 and 2006, and harvested in one of the two subsequent years (Fig. 1). This facilitated Analysis A assessing age of sward effects while having a larger sample size for assessing the effects of ploidy. Analysis B facilitated a comparison of the early group with the intermediate and late groups.
For Analysis A, 170 variety units (unique variety within a sowing year) had been sown (Table 1) and harvested in the two following years resulting in a total of 8412 plot harvests. Analysis B comprised 195 variety units (of which 63 were present in Analysis A) harvested in one of the 2 years following sowing resulting in 4404 plot harvests (of which 1512 were present in Analysis A). As different varieties were at different stages along their evaluation cycle during the present study not all varieties were present in each sowing. This resulted in 13 varieties that were common to the 3 years of sowings for Analysis A and 21 that were common to each of the sowings for Analysis B. The results from the harvests within a year were grouped as follows: Spring – harvests taken up to 17 April; Silage 1 – harvest taken on c. 29 May; Silage 2 – harvest taken on c. 10 July; Rest of year – combines the harvests taken on c. 7 August, 11 September and 23 October. Annual herbage yield was the cumulative total of the individual harvest values, while annual herbage quality trait values were based on the appropriate individual harvest values averaged using a weighting for individual harvests derived from their, respective, DM contributions to annual yield. Due to poor growing conditions, the first harvest in 2006 produced herbage yields below the reliable tolerance limits of the on-board weighing scales and less than was required for nutritive analysis so these samples were not included in yield or quality traits.
Table 1. Total number of perennial ryegrass variety units* (n) and plot harvests (n 1) for various categories of variety for Analyses A and B
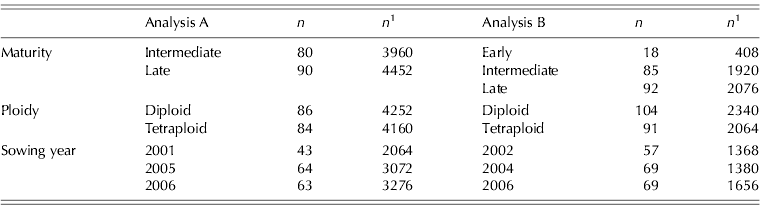
* A variety unit is defined as a unique variety within a sowing year (i.e. if a variety is sown in another year then it is a separate variety unit).
Analysis A comprised intermediate and late groups in an restricted maximum likelihood (REML) analysis with fixed effect terms for harvest year, maturity, ploidy and age of sward and random effect terms for trial, block within trial and variety within block within trial. A trial is defined as the maturity group within a sowing year (Fig. 1). Individual terms were added to the full fixed model and then maturity, ploidy, age of sward and the maturity×ploidy interaction were individually dropped from the full mixed model to assess the significance of each individual term. The random terms ensured that the effect of age of sward was tested against the error estimate at the age of sward within variety within block within trial level of the data. Analysis B included the early, intermediate and late groups with a REML analysis carried out, effectively on the trial-by-variety means, with fixed effect terms for harvest year, maturity and ploidy and random effect terms for trial and for variety within trial. Individual terms were added to the full fixed model and then maturity, ploidy and maturity×ploidy interaction were individually dropped from the full mixed model to assess the significance of each individual term.
Where a significant effect of maturity occurred in Analysis B, a student's t-test was applied to each paired combination of maturity groups to assess the significance between groups.
RESULTS
NIRS
The four calibration models that provided the most accurate and robust cross-validation statistics are displayed in Table 2 along with a summary of similar published calibration models. The most accurate calibration model was for predicting CP (R 2=0·98), with WSC concentration and buffering capacity calibration models also being accurate (R 2=0·96, 0·95, respectively). The in vitro CDDM calibration model was least accurate (R 2=0·86). These were the four models used to predict in vitro CDDM, WSC, CP and buffering capacity of the perennial ryegrass samples from the plots.
Table 2. Comparison of NIRS calibration models and validations from the current study with values quoted in literature for quality traits of ryegrass

N: number of samples used in calibration/validation; R 2: coefficient of determination; s.e.: standard error of prediction; s.e.%: standard error of prediction as a percentage of the mean.
* Cross-validation.
† Organic matter.
‡ Nitrogen concentration used in the literature, multiplied by 6·25 for ease of comparison. All samples dried and milled unless stated otherwise.
Maturity
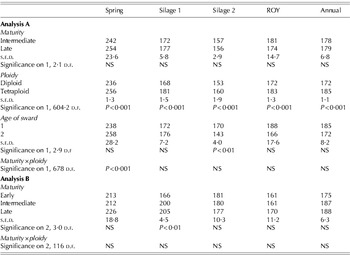
Within Analysis A, maturity had no significant effect on herbage yield (Table 3), in vitro CDDM (Table 4), WSC (Table 5), CP (Table 6) or DM (Table 8) at any individual seasonal period or for the annual value. For buffering capacity, the only effect was for ‘Annual’ where the intermediate group had lower (P<0·05) values than the late group with the same relationship approaching significance (P=0·053) at ‘Silage 1’. However, with the inclusion of the early group (Analysis B), maturity had a significant effect on herbage yield in the ‘Rest of Year’ period (P<0·05), with the early group having the lowest yield (Table 3).
Table 3. REML analysis of seasonal and cumulative annual herbage yield (t/ha) for main effects of maturity, ploidy, age of sward and maturity×ploidy interaction displaying effect means, s.e.d. and P-value for Analyses A and B

ROY, rest of year; s.e.d., average standard error of difference between means; d.f., degrees of freedom; NS, not significant.
Table 4. REML analysis of seasonal and weighted-average annual in vitro CDDM (g/ kg) for main effects of maturity, ploidy, age of sward and maturity×ploidy interaction displaying effect means, s.e.d. P-value for analyses A and B

ROY, rest of year; s.e.d., average standard error of difference between means; d.f., degrees of freedom; NS, not significant.
Table 5. REML analysis of seasonal and weighted-average annual WSC (g/kg DM) for main effects of maturity, ploidy, age of sward and maturity×ploidy interaction displaying effect means, s.e.d. P-value for analyses A and B
ROY, rest of year; s.e.d., average standard error of difference between means; d.f., degrees of freedom; NS, not significant.
Table 6. REML analysis of seasonal and weighted-average annual CP (g/kg DM) for main effects of maturity, ploidy, age of sward and maturity×ploidy interaction displaying effect means, s.e.d. and P-value for analyses A and B

ROY, rest of year; s.e.d., average standard error of difference between means; d.f., degrees of freedom; NS, not significant.
In Analysis B, maturity also had an effect on in vitro CDDM in the ‘Spring’ (P<0·01) period, with the late group being significantly greater than the early group, and in the ‘Annual’ (P<0·01) period, where the late group was significantly higher than either the early or intermediate groups (Table 4).
A significant maturity×ploidy interaction occurred for in vitro CDDM in Analysis A in the ‘Spring’ (P<0·01), ‘Silage 1’ (P<0·01), ‘Silage 2’ (P<0·05) and ‘Annual’ (P<0·05) periods (Table 4), whereby intermediate diploids had lower values than intermediate tetraploids (783 v. 795 g/kg, respectively). The only other significant maturity×ploidy interactions for Analysis A were in ‘Spring’ for WSC (P<0·001) and CP (P<0·01) and ‘Annual’ for DM (P<0·05).
Ploidy
Tetraploid swards had greater herbage yields (P<0·001), in vitro CDDM values (P<0·001) and WSC concentrations (P<0·01) than diploids in all seasons and annually. An exception to the above occurred for herbage yield in the ‘Spring’ period, where the difference was not significant (Table 3).
Diploid swards had a higher CP and DM concentration (P<0·001) than tetraploid swards over the growing season. This relationship occurred at all seasonal periods for DM concentration (Table 8) and in the ‘Spring’ (P<0·001), ‘Silage 2’ (P<0·05) and ‘Rest of Year’ (P<0·01) periods for CP concentration, while no significant effect was found in ‘Silage 1’ (Table 6).
Table 7. REML analysis of seasonal and weighted-average annual buffering capacity (mEq/kg DM) for main effects of maturity, ploidy, age of sward and maturity×ploidy interaction displaying effect means, s.e.d. and P-value for analyses A and B

ROY, rest of year; s.e.d., average standard error of difference between means; d.f., degrees of freedom; NS, not significant.
Table 8. REML analysis of seasonal and weighted-average DM (g/kg) for main effects of maturity, ploidy, age of sward and maturity×ploidy interaction displaying effect means, s.e.d. and P-value for analyses A and B

ROY, rest of year; s.e.d., average standard error of difference between means; d.f., degrees of freedom; NS, not significant.
Diploid swards had a significantly higher buffering capacity than tetraploids swards in ‘Spring’ (P<0·01), but a lower value in the ‘Silage 1’ (P<0·001), ‘Silage 2’ (P<0·05) and ‘Rest of Year’ (P<0·001) periods and in the ‘Annual’ (P<0·05) period (Table 7).
Age of sward
In their first full season, swards had a higher herbage yield in ‘Spring’ (P<0·001) and ‘Silage 1’ (P<0·05) than in their second season. This resulted in a higher (P<0·001) annual herbage yield in the first season after sowing (Table 3).
Age of sward had no effect (P>0·05) on in vitro CDDM, WSC, CP or DM except for WSC at ‘Silage 2’ when 1-year-old swards had a higher (P<0·01; Table 5) value. One-year-old swards had a higher annual buffering capacity than 2-year-old swards (P<0·05) reflecting higher (P<0·05) values in the ‘Spring’ and ‘Silage 2’ seasonal periods, but with no significant difference in either the ‘Silage 1’ or ‘Rest of year’ periods (Table 7).
DISCUSSION
NIRS calibrations
As the current calibration set comprises samples from five harvest years and is based on 176 different ryegrass varieties, the model incorporates a wide range of growing conditions, plant genotypes and tissue development stages relevant to ryegrass variety evaluation at this one site.
The most accurate calibration models were for predicting CP: values in the literature have R 2=0·93–0·99; Table 2) and the current study compared favourably with this range (R 2=0·98). The lower R 2 of in vitro CDDM in comparison with the other three quality traits may be related to the involvement of animal factors, thus incorporating additional variation (Coleman & Moore Reference Coleman and Moore2003). The in vitro CDDM calibration (R 2=0·86) was within the range of accuracy in other published work (R 2=0·83–0·96). The accuracy of these calibrations was satisfactory considering the larger calibration size (n=1986; 90 outliers removed from full calibration set) compared to other studies (n=49–193).
Maturity
Perennial ryegrass varieties are categorized into three maturity groups, although the mean heading dates of perennial ryegrass varieties form a continuum (Gilliland et al. Reference Gilliland, Barrett, Mann, Agnew and Fearon2002). This allows the harvest date of each group to be targeted to a physiological stage such as 0·5 ear emergence, to compare intrinsic varietal differences (Weddell et al. Reference Weddel, Gilliland, McVittie and Weddell1997). Aldrich & Dent (Reference Aldrich and Dent1963) have previously shown that there are differences in seasonal yield distribution across this continuum. The results of the present study confirm this, as there were only significant seasonal yield differences in the ‘Silage 1’ period. However, because the three maturity groups were cut at relatively similar times, it is noted that there is an underlying influence of differences in developmental stage at harvest on these comparisons. Even within a maturity group, such underlying effects cannot be entirely avoided unless each variety is harvested at the exact same developmental stage. The present results were, however, in contrast to the studies by Gilliland et al. (Reference Gilliland, Barrett, Mann, Agnew and Fearon2002) and Laidlaw (Reference Laidlaw2005), who found earlier groups to have a higher herbage yield in early April, corresponding to the spring period of the present study; they also found that the late group had a higher herbage yield in the summer period coinciding with the timing of the silage cuts in the present study. Similarly, the lack of significant difference between the maturity groups for total annual herbage yield is in contrast to Gilliland et al. (Reference Gilliland, Barrett, Mann, Agnew and Fearon2002), who found a significant difference in the annual herbage yield of the three maturity groups, and both Gowen et al. (Reference Gowen, O'Donovan, Casey, Rath, Delaby and Stakelum2003) and O'Donovan & Delaby (Reference O'Donovan and Delaby2005), who found the late group to have a higher annual herbage yield than the intermediate group in grazed swards.
The present study imposed a different management regime to any of these previous studies as it did not involve animal grazing and tested a much larger and different set of varieties (43–69 varieties annually compared to 9–12 in the previous studies). As Gilliland & Mann (Reference Gilliland and Mann2000) have shown, the management regime imposed on the sward can significantly affect productivity patterns and strong genotype×environment interactions are known to occur for productivity (Conaghan et al. Reference Conaghan, Casler, McGilloway, O'kiely and Dowley2008b) and quality traits, particularly WSC concentration (Evans et al. Reference Evans, Fraser, Owen and Davies2011). This highlights the challenges encountered when evaluating varieties for agronomic use and the limitations in extrapolating results from variety trials onto farm level, as reported by Conaghan et al. (Reference Conaghan, Casler, McGilloway, O'kiely and Dowley2008b).
When the nutritive value parameters were compared between maturity groups, a number of significant differences were found. In ‘Silage 1’, intermediate and late groups had significantly higher in vitro CDDM than the early group. This is an important observation, as first-cut silage contributes the most conserved forage of any harvest in the growing season in Ireland (Connolly et al. Reference Connolly, Kinsella and Quinlan2003). This suggests it may be possible to grow varieties from the late maturing group to a higher yield than earlier maturing types, while still maintaining an adequate digestibility, and this is in accord with Humphreys & O'Kiely (Reference Humphreys and O'Kiely2006).
A significant increase in WSC concentration was also recorded in ‘Silage 1’ and this probably contributed to the differences in in vitro CDDM at this harvest. There are, however, other important implications of increased WSC concentration. When WSC concentration is expressed on an aqueous phase basis and considered together with buffering capacity (DM basis) they provide a good index of ensilability (O'Kiely & Muck Reference O'Kiely, Muck and Cherney1998). The overall mean WSC and buffering capacity values among all ‘Silage 1’ and ‘Silage 2’ herbages (49 g WSC/l and 367 mEq/kg DM) indicated that crops had a considerable surplus of fermentable substrate and should have been quite straightforward to preserve properly as silage. Herbage maturity group had no overall impact on ensilability in the ‘Silage 2’ harvest, with the lower WSC concentration among the early group (45·7 g/l) than among the intermediate (55·4 g/l) or the late (59·2 g/l) groups being offset by the correspondingly lower buffering capacity values associated with the early group (i.e. 322 v. 349 and 408 mEq/kg DM, respectively). Thus, maturity categorization had no impact on ensilability. Across all three maturity groups, the ensilability indices of herbages from ‘Silage 1’ indicated they would be easier to preserve than ‘Silage 2’ herbages.
Notably, there were no significant differences in CP concentrations between maturity groups. Binnie et al. (Reference Binnie, Mayne and Laidlaw2001) have shown that high application rates of inorganic N fertilizer can raise CP concentration, with the relatively high rates in the present study (350–400 kg N/ha per annum) possibly masking any differences that might exist between maturity groups. In addition, as perennial ryegrass is known for its high CP concentration, with swards normally exceeding the 80 g CP/kg DM concentration thought to be limiting to rumen function (Coleman & Moore Reference Coleman and Moore2003), the lack of differences may also reflect the low priority of CP as a trait for ryegrass breeders (O'Donovan et al. 2011).
Ploidy
Gilliland et al. (Reference Gilliland, Johnston and Connelly2007) reported an increase in the usage of tetraploid cultivars of perennial ryegrass over the past 25 years in Northern Ireland, and these now account for almost 0·30 of all perennial ryegrass seed sold. This increased usage was attributed to the perceived increased yield potential and nutritive value of tetraploid varieties. This advantage was repeated in the present study, as tetraploids conferred a small but statistically significant DM yield advantage in all seasonal periods except ‘Spring’, which gave a total yield increase of 0·66 t/ha per annum. This was similar to the findings of Gilliland et al. (Reference Gilliland, Barrett, Mann, Agnew and Fearon2002), who found no seasonal differences between ploidies but an additional 1 t DM/ha per annum from tetraploids. Under animal grazing conditions, however, Gowen et al. (Reference Gowen, O'Donovan, Casey, Rath, Delaby and Stakelum2003) and Balocchi & Lopez (Reference Balocchi and Lopez2009) found diploids swards to have a higher annual herbage yield than tetraploids. Although additional environmental and management factors are likely to affect the yield potential of diploid and tetraploid swards, these inconsistencies raise concern regarding how representative simulated-grazing is of actual grazing. This is clearly not a simple issue, as Wims et al. (Reference Wims, McEvoy, Boland, O'Donovan, Schnyder, Isselstein, Taube, Auerswald, Schellberg, Wachendorf, Herrmann, Gierus, Wrage and Hopkins2010) found no significant re-ranking of varieties when comparing animal grazed and simulated grazed plots.
The higher nutritive value of tetraploid varieties is well established (Wilkins Reference Wilkins1991; Gilliland et al. Reference Gilliland, Barrett, Mann, Agnew and Fearon2002; Balocchi & Lopez Reference Balocchi and Lopez2009), although it is unclear as to the mechanism(s) that induce higher nutritive value. A proposed explanation is that the increased ratio of cell contents to cell wall in tetraploids allows for increased intra-cellular components without a proportional increase in potentially lower nutritive value cell wall material (Wilkins & Sabanci Reference Wilkins and Sabanci1990). However, this possible explanation cannot be the single causal factor as the CP concentration of tetraploids was found to be lower.
The increased in vitro CDDM of tetraploids as shown throughout the growing season in the current study may be partially attributed to the increased WSC concentration (Humphreys Reference Humphreys1989). However, it could equally have been due to a decrease in fibrous material (O'Donovan et al. Reference O'Donovan, Lewis and O'Kiely2011) or a change in fibre digestibility.
The increased WSC concentration of tetraploids may have resulted in the decreased CP concentration. Smith et al. (Reference Smith, Simpson, Culvenor, Humphreys, Prud'homme and Oram2001) reported altered carbon partitioning between intracellular components in grass varieties bred for high WSC concentration.
Tetraploid varieties are often suggested as being optimal for ensilage, reflecting the higher yield potential under mechanical harvested systems and the increased WSC concentration. In ‘Silage 1’, the higher DM and lower WSC (g/kg DM) concentrations associated with diploid compared to tetraploid varieties meant that when expressed on an aqueous phase basis the WSC concentrations were numerically quite similar (42·0 and 41·9 g/l for diploids and tetraploids, respectively). Although buffering capacity was lower for the diploid varieties, the magnitude of this effect was very small (434 v. 441 mEq/kg DM). In ‘Silage 2’, the higher DM and lower WSC (g/kg DM) concentrations associated with diploid compared to tetraploid varieties meant that when expressed on an aqueous phase basis the WSC concentrations were 35·9 and 34·2 g/l, respectively. There was no effect of ploidy on buffering capacity. In terms of ensilability indices the increased WSC concentration of tetraploids is effectively counteracted by the decreased DM concentration when WSC concentration is reported on an aqueous phase basis. Although ‘Silage 1’ diploids had a marginally lower buffering capacity the effect of ploidy on silage fermentation is likely to be minimal.
Age of sward
As a sward ages, its yield and quality has been shown to decrease due to the invasion of secondary grasses and weeds (Wilkins Reference Wilkins1997). The present study had a decreased herbage yield of 31% between the first and second year swards; however, it was not clear whether this was a result of weather conditions in the year of harvest, age of plant material or the residual effects of soil fertility and structure following sowing (Parsons et al. Reference Parsons, Edwards, Newton, Chapman, Caradus, Rasmussen and Rowarth2011). There was, notably, no decline in digestibility and little deterioration in other nutritional quality traits between 1- and 2-year-old swards, with the only difference being WSC concentration in ‘Silage 2’. Here again it is possible that the high application rates of inorganic nitrogen fertilizer masked any deterioration in CP concentration, as Keady et al. (Reference Keady, Mayne and Fitzpatrick2000) have shown that increasing the application rate of inorganic nitrogen fertilizer increases the CP concentration in the sward.
Age of sward did not affect ensilability in ‘Silage 1’, while in ‘Silage 2’ the slightly higher WSC values in 1-year-old swards (36·3 v. 33·8 g/l) was counterbalanced by a correspondingly higher buffering capacity (385 v. 367 mEq/kg DM). Thus, there was little indication of any effect of age of sward on grass ensilability.
It is noted, however, that the present study only examined swards up to 2 years after sowing and the longer-term effects of sward aging may not be reliably predicted from the current dataset.
Implications
Although differences have been reported on a statistically significant basis, any changes in nutritive quality need to be extrapolated to the animal interface to determine their true value to ruminant enterprises. Small increases in digestibility can be valuable as they can have a beneficial effect on grass intake and energy availability from the sward (Casler Reference Casler2001; Coleman & Moore Reference Coleman and Moore2003; Wilkins & Humphreys Reference Wilkins and Humphreys2003), with a 3·2% increase in beef production being reported per 1% increase in digestibility (Casler & Vogel Reference Casler and Vogel1999). The required scale of increase in WSC concentration is less clear as Miller et al. (Reference Miller, Moorby, Davies, Humphreys, Scollan, MacRae and Theodorou2001) found that 40 g WSC/kg DM provided increased milk production and quality, while Taweel et al. (Reference Taweel, Tas, Smit, Elgersma, Dijkstra and Tamminga2005) found no benefit in milk production or quality when heifers were fed a perennial ryegrass cultivar with increased WSC concentration (24–31 g WSC /kg DM greater than control). A complicating factor as reported by Parsons et al. (Reference Parsons, Edwards, Newton, Chapman, Caradus, Rasmussen and Rowarth2011) is that increases in nitrogen use efficiency (NUE) are dependent on the ratio of energy (in the form of WSC) to nitrogen (including CP sources). Although this is a continuum response in which any increase in WSC will lead to an increase in NUE, detection in field trials requires a substantial increase in WSC. In the present study, the largest difference between ploidy groups was reported in the ‘Spring’ period when tetraploids had 22 g/kg DM higher WSC than diploids. Nonetheless, there was a maximum range of 90 g/kg DM in annual WSC concentrations between individual ryegrass varieties (data not presented) representing the difference between the worst and elite performing varieties. This scale of differences would be expected to confer significant animal production benefits.
The main conclusions from the present work were that although significant differences exist between ploidy and maturity for herbage yield, nutritive quality traits and ensilability indices, there is justification for the use of these groups in evaluation trials as they permit like-for-like comparisons between varieties. It also shows that despite breeders’ achievements in creating considerable differences between individual varieties, as evident in recommended list publications, ploidy and maturity group characteristics remain an influence on performance. As these differences between groups, and particularly between ploidies, were sufficiently large to affect animal productivity and efficiency, end-users are also justified in selecting varieties from within a specific group to get the performance profile that suits their individual farming enterprise. The seasonal differences between maturity groups at the first silage cut suggests that timing this harvest differently for the three groups in the variety trials might better reflect best management practice. The detectable sward age effects between the first and second harvest years could be the start of a progressive decline in performance of swards following sowing or equally evidence that the first year after reseeding does not reflect the longer-term potential of perennial ryegrass swards. A longer-term study of sward age should easily resolve which of these two possibilities is the causal factor of this observation.
The Department of Agriculture, Food and the Marine research stimulus fund (07 526) is acknowledged for providing the resources to carry out this research; the laboratory staff at Teagasc, Grange for carrying out the laboratory analyses and the field staff at the Variety Evaluation Unit, Backweston for the harvesting and management of ryegrass plots.


