


INTRODUCTION
Plasmodium vivax is the most widespread, yet relatively understudied, human malaria parasite. This species causes up to 390 million clinical cases each year (Price et al. Reference Price, Tjitra, Guerra, Yeung, White and Anstey2007; Battle et al. Reference Battle, Gething, Elyazar, Moyes, Sinka, Howes, Guerra, Price, Baird and Hay2012), with 2·49 billion people currently at risk of infection in tropical areas of Latin America, the Middle East, Central, South and Southeast Asia, Oceania and East Africa (Gething et al. Reference Gething, Elyazar, Moyes, Smith, Battle, Guerra, Patil, Tatem, Howes, Myers, George, Horby, Wertheim, Price, Mueller, Baird and Hay2012). Brazil alone accounts for half of the laboratory-confirmed malaria cases in the region of the Americas and the Caribbean, with over 206 000 P. vivax infections recorded in 2012 (World Health Organization, 2013). The main endemic sites in Brazil are open mining enclaves, logging camps and farming settlements across the Amazon Basin, a region that currently accounts for 99·9% of the country-wide malaria burden (da Silva-Nunes et al. Reference da Silva-Nunes, Moreno, Conn, Gamboa, Abeles, Vinetz and Ferreira2012). The colonization of densely forested areas in rural Amazonia typically results in massive deforestation, which creates or expands breeding habitats of the main local malaria vector, Anopheles darlingi (Norris, Reference Norris2004; Vittor et al. Reference Vittor, Gilman, Tielsch, Glass, Shields, Lozano, Pinedo-Cancino and Patz2006, Reference Vittor, Pan, Gilman, Tielsch, Glass, Shields, Sanchez-Lozano, Pinedo, Salas-Cobos, Flores and Patz2009). As a consequence, new frontier settlements typically experience malaria outbreaks until these communities become more stable and malaria incidence starts to decline (Castro et al. Reference Castro, Monte-Mór, Sawyer and Singer2006).
The forces and mechanisms that promote genetic diversity of P. vivax across time and space remain poorly understood. For example, why do isolates of this species display more genetic diversity than isolates of another major human malaria parasite, Plasmodium falciparum, originating from the same or similar endemic settings (Neafsey et al. Reference Neafsey, Galinsky, Jiang, Young, Sykes, Saif, Gujja, Goldberg, Young, Zeng, Chapman, Dash, Anvikar, Sutton, Birren, Escalante, Barnwell and Carlton2012)? Next, why does genetic diversity remain high, and co-infections with several distinct parasite clones remain common, in areas experiencing a dramatic reduction in malaria transmission, such as Sri Lanka (Gunawardena et al. Reference Gunawardena, Ferreira, Kapilananda, Wirth and Karunaweera2014)? Finally, why are P. vivax microsatellite haplotypes so short lived in rural Amazonia, being rarely re-sampled a few months after their first appearance in the population (Ferreira et al. Reference Ferreira, Karunaweera, da Silva-Nunes, da Silva, Wirth and Hartl2007; Orjuela-Sánchez et al. Reference Orjuela-Sánchez, da Silva, da Silva-Nunes and Ferreira2009), whereas P. falciparum microsatellite haplotypes may persist for years (Anderson et al. Reference Anderson, Haubold, Williams, Estrada-Franco, Richardson, Mollinedo, Bockarie, Mokili, Mharakurwa, French, Whitworth, Velez, Brockman, Nosten, Ferreira and Day2000)?
Here we investigate the temporal and spatial dynamics of P. vivax polymorphisms during the early phases of occupation of a frontier settlement in the Amazon Basin of Brazil. The genetic characterization of P. vivax isolates collected over a period of 3 years revealed a moderate-to-high overall diversity, with a large proportion of multiple-clone infections (MCI), but also a near-clonal expansion of closely related parasites during an outbreak. Little temporal and no spatial clustering were observed in the distribution of parasite haplotypes. We compare these patterns with those reported for other P. vivax populations worldwide and discuss how population genetic studies of parasites can provide valuable information for ongoing malaria elimination efforts.
MATERIALS AND METHODS
Study area
We sampled P. vivax isolates in farming settlements of Remansinho area (population, 260), which are scattered in the equatorial rain forest of Southern Amazonas State, Northwestern Brazil (Fig. 1). Once a sparsely populated rubber tapper community, Remansinho now comprises a main settlement situated along the final 40 km of the Ramal do Remansinho, a 60 km long unpaved road originating from the BR-364 interstate highway, and 4 settlements along secondary roads originating from this main unpaved road, known as Ramal da Linha 1, Ramal da Castanheira, Ramal dos Seringueiros and Ramal dos Goianos. The area receives most rainfall between November and March (annual average, 2318 mm), but malaria transmission occurs year-round. The main local malaria vector is A. darlingi (Sinka et al. Reference Sinka, Rubio-Palis, Manguin, Patil, Temperley, Gething, Van Boeckel, Kabaria, Harbach and Hay2010).
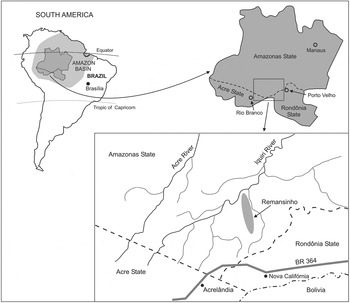
Fig. 1. Map showing the location of the field site, Remansinho, Southern Amazonas State, Brazilian Amazonia. The map also shows the village of Nova Califórnia (Western Rondônia State), the nearest town, Acrelândia (Eastern Acre State), where our field laboratory is situated, and the BR 364 interstate highway, which connects Acre, Rondônia and Southern Amazonas to the rest of the country.
Study design and population
A population-based prospective cohort study was initiated in March 2010 to estimate the prevalence and incidence of malaria parasite carriage in Remansinho, by combining microscopy and molecular diagnosis. This ongoing study comprises periodic cross-sectional malaria prevalence surveys of the entire population, complemented with clinical and laboratory surveillance of febrile illness episodes. We used a structured questionnaire to determine the presence of 13 malaria-related signs and symptoms (such as fever, chills, sweating, headache, myalgia, arthralgia, abdominal pain, nausea, vomiting, dizziness, cough, dyspnoea and diarrhoea) up to 7 days prior to the interview (da Silva-Nunes and Ferreira, Reference da Silva-Nunes and Ferreira2007). Since March 2010, we have enrolled 584 participants distributed into 205 households; all dwellings were geo-referenced with a positional accuracy within 15 m.
To estimate the monthly incidence of clinical malaria, we examined all records of microscopically confirmed infections diagnosed between March 2010 and October 2013 at the government-run health posts in Remansinho and in the nearest village, Nova Califórnia (Fig. 1). These infections were diagnosed through active and passive detection of febrile cases during the study period; finger-prick blood samples were collected and examined for malaria parasites whenever febrile subjects visited the health posts in Remansinho or Nova Califórnia, or were found to be sick during house-to-house visits carried out periodically by local malaria control teams. This strategy is assumed to detect virtually all clinical malaria episodes in cohort subjects between the cross-sectional surveys, since there are no other public or private facilities providing laboratory diagnosis of malaria in the area. Moreover, laboratory diagnosis (either by microscopy or rapid diagnostic tests) is required to obtain antimalarial drugs in Brazil, which are distributed free of charge by the Ministry of Health and cannot be purchased in local drugstores.
Field isolates and P. vivax genotyping
During each cross-sectional survey, all study participants aged more than 3 months, irrespective of any clinical symptoms, were invited to contribute a venous blood sample for malaria diagnosis and, if found positive, subsequent parasite genotyping. Participation rates ranged between 70·3 and 96·3% across surveys. Laboratory diagnosis of malaria was based on microscopic examination of thick smears and quantitative real-time polymerase chain reaction (qPCR) as previously described (Gonçalves et al. Reference Gonçalves, Scopel, Bastos and Ferreira2012). Here we analysed 116 samples with qPCR-confirmed P. vivax infection collected during March–May 2010 (survey A), May–July 2010 (survey B), March–April 2011 (survey C), October 2011 (survey D), April 2012 (survey E), October–November 2012 (survey F) and April 2013 (survey G). Given the small numbers of parasite samples, we combined data from surveys E to G in most analyses. We also genotyped consecutive parasite samples from 3 asymptomatic carriers of low-density P. vivax infection (missed by conventional microscopy but confirmed by qPCR) enrolled in October 2012. Because only cases confirmed by microscopy or rapid diagnostic tests are eligible for antimalarial treatment in Brazil (Ministry of Health of Brazil, 2010), these subjects were left untreated but were followed up over the next 15–30 days, with 2–3 samples collected during this period.
We used 200-μL aliquots of whole venous blood applied to QIAamp DNA blood kits (Qiagen, Hilden, Germany) to prepare DNA templates for parasite genotyping. Before PCR amplification, DNA samples underwent whole-genome amplification by isothermal strand displacement, using the GenomiPhi HY DNA amplification kit (GE Healthcare, Little Chalfont, Buckinghamshire, UK), to increase DNA template volume. We typed 15 highly polymorphic single-copy loci that map to 11 different chromosomes (Table 1). The marker set included 14 microsatellites, 13 of them consisting of trinucleotide repeats and 1 of tetranucleotide repeats (Karunaweera et al. Reference Karunaweera, Ferreira, Hartl and Wirth2007), and 1 variable domain of the antigen-coding locus merozoite surface protein-1, known as msp1F1, which also consists of trinucleotide repeats (Imwong et al. Reference Imwong, Pukrittayakamee, Grüner, Rénia, Letourneur, Looareesuwan, White and Snounou2005). Alleles of all microsatellite markers but MS16 were PCR amplified with the oligonucleotide primers and protocols described by Orjuela-Sánchez et al. (Reference Orjuela-Sánchez, Brandi and Ferreira2013a ); genotyping of MS16 and msp1F1 was carried out using the nested PCR protocols of Koepfli et al. (Reference Koepfli, Mueller, Marfurt, Goroti, Sie, Oa, Genton, Beck and Felger2009). PCR products were separated by capillary electrophoresis on an automated DNA sequencer ABI 3500 (Applied Biosystems). The lengths (in base pairs) and relative abundance (peak heights in electropherograms) of the PCR-amplified alleles were determined using the commercially available GeneMapper 4.1 (Applied Biosystems) software. The minimal detectable peak height was set to 200 arbitrary fluorescence units. Selected microsatellite amplicons (2–5 per locus) were sequenced, using previously described methods and primers (Karunaweera et al. Reference Karunaweera, Ferreira, Hartl and Wirth2007), to analyse the type of repeats observed. DNA sequences of these amplicons were compared with those previously reported for Sri Lankan isolates (Karunaweera et al. Reference Karunaweera, Ferreira, Hartl and Wirth2007; GenBank accession numbers, DQ676626–676681). The repeat arrays were classified as either perfect, compound, interrupted or complex (Sutton, Reference Sutton2013).
Table 1. Overall diversity of 14 microsatellite loci and 1 antigen-coding locus in 84 Plasmodium vivax isolates from Remansinho, Amazon Basin of Brazil (2010–2013)
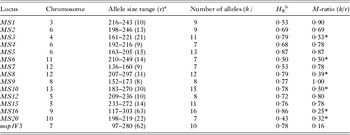
* M-ratio < 0·68, suggesting a recent reduction in population size. An asterisk must also be added to the last M-ratio value (0·16), corresponding to the msp1F3 marker, since it is also smaller than 0·68.
a r is the number of possible alleles within the allele size interval.
b H E is the expected heterozygosity.
Data analysis
A P. vivax isolate was defined as a sample of parasites derived from a single patient at a single occasion; 1 isolate may comprise 1 or more genetically diverse clones. We scored 2 alleles at a locus when the minor peak was >33% the height of the predominant peak. Samples were considered to contain MCI if at least 1 locus showed more than 1 allele. We additionally used the proportion of infections with >1 locus showing two or more alleles (MCI >1) as a more stringent criterion to define mixed-clone infections. Multilocus haplotypes were defined as unique combinations of alleles at each locus analysed. Most analysis considered only the most abundant alleles for haplotype assignment in MCI (Orjuela-Sánchez et al. Reference Orjuela-Sánchez, Brandi and Ferreira2013a ). However, given the risk of misassigning haplotypes due to biased amplification of co-existing alleles in MCI (Havryliuk et al. Reference Havryliuk, Orjuela-Sánchez and Ferreira2008), we considered all possible haplotypes when comparing paired samples from the same subjects. For this purpose, we listed all combinations of alleles, considering major and minor peaks, in each pair. Here we report the genetic distance between the closest haplotypes found in the pair of consecutive samples.
Three approaches were used to measure the genetic diversity of parasite populations. First, we calculated the expected heterozygosity (H E) as a measure of overall genetic diversity; H E = [n/(n−1)][1−∑p i 2], where n is the number of isolates analysed and p i is the frequency of the ith allele in the population. H E gives the average probability that a pair of alleles randomly obtained from the population is different and ranges between 0 and 1. Next, we calculated the genotypic richness index (R), which measures the proportion of unique genotypes present in the sample; R = (G−1)/(n−1), where G is the number of distinct genotypes in the sample (Dorken and Eckert, Reference Dorken and Eckert2001). Finally, we calculated the average pairwise genetic distance between isolates; genetic distance = 1−ps, where ps is the proportion of alleles shared between haplotypes.
The standardized index of association (I S A) was used to test for evidence of overall multilocus linkage disequilibrium (LD) in the parasite population. This test compares the variance (V D ) of the number of alleles shared between all pairs of haplotypes observed in the population (D) with the variance expected under random association of alleles (V E ) as follows: I S A = (V D /VE −1)(r−1), where r is the number of loci analysed. V E is derived from 10 000 simulated datasets in which alleles were randomly reshuffled among haplotypes. Significant LD is detected if V D is greater than 95% of the values derived from the reshuffled datasets. Data were analysed with LIAN 3.5 software (Haubold and Hudson, Reference Haubold and Hudson2000).
We used 3 strategies to evaluate genetic variation over time. First, we used the version 3 of eBURST software (Feil et al. Reference Feil, Li, Aanensen, Hanage and Spratt2004) to identify haplogroups (defined as groups of haplotypes that are identical to each other at 13 or more of the 15 loci analysed) and examined their temporal distribution. Next, we used the STRUCTURE 2.2 software (Pritchard et al. Reference Pritchard, Stephens and Donnelly2000) to identify clusters of genetically related isolates and evaluate their temporal distribution. This software uses a Bayesian clustering approach to assign isolates to K populations characterized by a set of allele frequencies at each locus. We ran the program 10 times each for K values between 1 and 6. Each analysis was involved 100 000 iterations, with 50 000 burn-in cycles, using the admixture model to account for both correlated and uncorrelated allele frequencies. We computed the posterior probability for each K and show here the clustering pattern associated with the strongest statistical support (K = 3). Isolates with a predominant ancestry (>0·70) in 1 of the 3 populations were considered as members of that particular population; when no clear predominant ancestry could be defined, the isolates were considered to have a mixed ancestry. Finally, we tested whether the pairwise genetic distance between isolates tended to increase with increasing distance between the dates of sample collection, by using the Mantel non-parametric matrix correlation test (Mantel, Reference Mantel1967). The significance of the correlation coefficient (r) was tested with 500 permutations using the ade4 package of the R statistical software (R Core Team, 2013).
To test whether genetically related parasites clustered spatially, we calculated the pairwise genetic distance between isolates collected during the same survey, to minimize the effect of temporal distance on genetic differentiation. We next used the Spearman correlation test to determine whether these genetic distances correlated with the pairwise distances between the dwellings where parasite sample donors lived. Linear distances between dwellings were calculated using their global positioning system (GPS)-determined coordinates.
Finally, we looked for evidence of a recent population bottleneck in P. vivax from Remansinho as a result of declining malaria transmission. First, we used the M-ratio test of Garza and Williamson (Reference Garza and Williamson2001), calculated as the ratio between the number of alleles found in the population (i.e. occupied allelic states, k) and the total number of possible allelic states (occupied or not, r) given the size range of alleles observed for each marker. An M-ratio value <0·68 is considered as suggestive of a recent reduction in population size, assuming a stepwise mutation model of microsatellite-type sequences and a robust population size (Garza and Williamson, Reference Garza and Williamson2001). Second, we evaluated the allele frequency distribution of P. vivax microsatellites (Luikart et al. Reference Luikart, Allendorf, Cornuet and Sherwin1988). Because alleles at low frequencies tend to become less abundant after a major population bottleneck, the typically L-shaped distribution observed in populations at mutation-drift equilibrium tends to become flattened as rare alleles are lost as a result of a recent population bottleneck (see e.g. Anderson et al. Reference Anderson, Haubold, Williams, Estrada-Franco, Richardson, Mollinedo, Bockarie, Mokili, Mharakurwa, French, Whitworth, Velez, Brockman, Nosten, Ferreira and Day2000). We used a χ 2 test to compare the proportions of rare P. vivax microsatellite alleles (<5% frequency) in Remansinho and Granada, another typical settlement in rural Amazonia (da Silva-Nunes et al. Reference da Silva-Nunes, Codeço, Malafronte, da Silva, Juncansen, Muniz and Ferreira2008). Statistical significance was defined at the 5% level in all analyses.
Ethics statement
Study protocols have been approved by the Institutional Review Board of the University Hospital of the University of São Paulo (1025/10) and by the National Human Research Ethics Committee of the Ministry of Health of Brazil (551/2010). Written informed consent was obtained from all study participants or their parents/guardians.
RESULTS
Malaria incidence and genetic diversity in P. vivax
Between March 2010 and October 2013, 529 microscopically confirmed P. vivax and 2 P. falciparum infections were diagnosed through active and passive surveillance of febrile illnesses in the study population (6966 person-months of follow-up). Figure 2 shows the monthly incidence of clinical vivax malaria over the study period. We observed a P. vivax outbreak in October 2012, with 0·4 cases per person-month, followed by a marked and sustained decline in transmission thereafter.

Fig. 2. Monthly incidence of microscopically confirmed clinical vivax malaria in Remansinho, Brazil, between March 2010 and October 2013 (continuous line, left y-axis) and number of Plasmodium vivax samples collected during population-wide cross-sectional surveys in the area (bars, right y-axis). Dark-grey bar segments indicate samples that were fully typed with 15 markers, whereas light-grey bar segments indicate samples that were partially typed with 10–14 markers.
DNA samples from 84 (72·4%) of the 116 PCR-confirmed P. vivax infections diagnosed during cross-sectional surveys had all markers typed, while the remaining 32 (27·6%) had 10–15 markers typed (Fig. 2). Further analyses only considered fully typed isolates, except for comparisons of sequential infections in the same subjects, which considered both fully and partially typed samples. Completely typed P. vivax isolates were derived from subjects who were symptomatic (42·9%) and from those who reported none of the 13 malaria-related symptoms investigated up to 7 days prior to sample collection (57·1%); their infections were either patent (i.e. diagnosed by conventional microscopy, 45·2%) or subpatent (i.e. missed by conventional microscopy, 54·8%). Not surprisingly, the proportion of symptomatic infections increased linearly with increasing parasite density (χ 2 for linear trend = 9·95, 1 degree of freedom [d.f.], P = 0·002; qPCR-determined parasitaemias stratified into quartiles for this analysis). Overall, this parasite population was moderately to highly diverse, with a significant multilocus LD and a large proportion of MCI (Table 1). Similar proportions of MCI (80·5 vs 72·9%) were found in symptomatic and asymptomatic P. vivax carriers (Yates’ corrected χ 2 = 0·31, 1 d.f., P = 0·58); the proportions of MCI>1 in symptomatic and asymptomatic infections were nearly identical (52·8 vs 54·2%; Yates’ corrected χ 2 = 0·01, 1 d.f., P = 0·92). We therefore found no association between multiplicity of infection and the presence of malaria-related symptoms in this community.
One multilocus haplotype was shared by 3 isolates, all sampled during survey D in October 2011; all other 81 haplotypes were recovered only once. We characterized 6 haplogroups in the population, each comprising 2–7 samples. The largest haplogroup comprised 6 samples (including the 3 isolates sharing the same haplotype) collected in October 2011 and 1 sample collected in April 2012 (survey E). The second largest haplogroup was a trio of isolates collected in surveys A, C and G, which shared either 13 or 14 alleles. All other haplogroups were pairs of samples collected during survey C (1 pair) or D (3 pairs) that shared 13 alleles. We conclude that all identical and most closely related haplotypes (i.e. those belonging to the same haplogroup) in the population were sampled during the malaria outbreak in October 2011.
The M-ratio test yielded values <0·68 for microsatellites MS3, MS6, MS8, MS10, MS16 and MS20, in addition to msp1F3 (Table 1). However, the complex mutational patterns found in microsatellites MS6, MS8, MS10, MS16 and MS20 (Supplementary Table S1) are likely to violate the stepwise mutation model assumed by the M-ratio test. Moreover, msp1F3 variation is likely to be affected by natural selection, given the antigenic nature of the product of this locus and its potential role in red blood cell invasion. We thus consider that only the low M-ratio for MS3, but not at other loci with more complex mutation patterns, might suggest a recent bottleneck in the malaria parasite population of Remansinho. Furthermore, Fig. 3 shows that overall allele frequency distribution of microsatellite alleles was clearly L-shaped and similar to that previously found in parasites collected over 3 years (2004–2006) in Granada, about 150 km west of Remansinho. Comparable proportions of rare alleles (frequency <5%) were found in both populations (61·1 vs 51·3%; Yates’ corrected χ 2 = 3·33, 1 d.f., P = 0·07). These findings indicate that rare alleles have not been lost, in the recent past, by the parasite population of Remansinho.

Fig. 3. Frequency distribution of microsatellite allele frequencies in Plasmodium vivax isolates collected in Remansinho, Brazil, in 2010–2013 (n = 84; grey bars) and in Granada (a frontier settlement about 150 km west of Remansinho) in 2004–2006 (n = 148; black bars). Data are presented for all loci combined. An L-shaped frequency distribution is expected for non-bottlenecked populations at mutation-drift equilibrium (Luikart et al. Reference Luikart, Allendorf, Cornuet and Sherwin1998).
Parasite diversity over time and space
The overall levels of P. vivax genetic diversity and the proportion of MCI remained nearly unchanged over 3 years, except for parasites collected during survey D (Table 2). These samples showed the lowest average H E, the lowest R index and the lowest average pairwise genetic distance. Furthermore, parasites from survey D had the lowest proportions of MCI and MCI>1, with the strongest LD (Table 2). These findings are consistent with a nearly clonal expansion of 1 or a few genetically related haplotypes during the malaria outbreak in October, 2011. Furthermore, out of the 3 major subpopulations detected by Bayesian clustering analysis (Supplementary Fig. S1), 1 (represented in black in Fig. 4) was almost exclusively observed during survey D. We next hypothesized that parasite populations from Remansinho have gradually diverged over time as a result of migration, genetic drift, mutation and recombination. The weak, but significant, positive correlation between genetic distance and temporal distance (in days) between dates of collection (r = 0·06, P = 0·03, Mantel matrix correlation test; Supplementary Fig. S2) provides some support for this hypothesis.

Fig. 4. Monthly distribution of 3 clusters of genetically related Plasmodium vivax haplotypes in Remansinho, Brazil, 2010–2013. Isolates are grouped according to the populations in which they have predominant ancestry. They were considered as members of 1 of the 3 populations (represented by dark-grey, black or stripped bar segments) if they had a membership fraction greater than 70% in this population, as determined by the Bayesian clustering approach implemented in STRUCTURE software. When no predominant ancestry could be defined, the isolates were considered to have a ‘mixed ancestry’ and were represented with white bar segments.
Table 2. Temporal trends of genetic diversity among Plasmodium vivax isolates from Remansinho, Amazon Basin of Brazil (2010–2013)

a MCI (%) is the percentage of infections with at least 1 locus showing more than 1 allele.
b MCI>1 (%) indicates the proportion of infections with >1 locus showing more than 2 alleles.
* P<0·01.
** P = 0·02.
We next tested whether genetically related parasites found in Remansinho clustered spatially, according to place where infected subjects lived. In this analysis, we considered only pairwise genetic distances of parasites collected during the same survey, to remove the confounding effect of genetic differentiation over time. The pairwise genetic distances between parasites did not correlate with the linear distance, in km, between the place of residence of infected subjects (r s = −0·017, P>0·05, Spearman correlation test; Supplementary Fig. S3).
Haplotypes in consecutive parasite samples
Owing to the year-round malaria transmission in Remansinho, recurrent episodes of parasitaemia in the same subjects may originate from recrudescences, relapses and new infections. We compared multilocus haplotypes in consecutive P. vivax samples collected from 12 subjects between 3 and 15 months apart. Between 11 and 15 markers were typed in each of these pairs of sequential samples. None of the paired samples shared exactly the same alleles, with genetic distances ranging between 0·23 and 0·67 (Supplementary Table S2). These data are consistent with our previous findings in the Amazon Basin of Brazil (Ferreira et al. Reference Ferreira, Karunaweera, da Silva-Nunes, da Silva, Wirth and Hartl2007; Orjuela-Sánchez et al. Reference Orjuela-Sánchez, da Silva, da Silva-Nunes and Ferreira2009), showing a fast turnover of P. vivax haplotypes in these populations. We also compared consecutive samples from 3 asymptomatic carriers of subpatent P. vivax infection, collected about 2 weeks apart from each other. We found little allele sharing between most sample pairs, with genetic distances ranging between 0·19 and 0·92 (Supplementary Table S3). As previously described for P. falciparum carriers (Farnert, Reference Farnert2008), we suggest that haplotypes with different temporal dynamics co-exist in asymptomatic P. vivax infections. Therefore, the analysis of a single sample per infection is likely to underestimate the multiplicity of P. vivax infections in Remansinho and similar endemic settings.
Global microsatellite diversity in P. vivax
We compared our data with those from 10 other studies that used microsatellite markers to characterize worldwide P. vivax populations. Table 3 shows the mean number of alleles per locus and average H E for a common set of 9 microsatellites that were used in all studies. Studies were ranked according to increasing H E. Genetic diversity estimates for Remansinho were quite similar to previous estimates from Brazil (Ferreira et al. Reference Ferreira, Karunaweera, da Silva-Nunes, da Silva, Wirth and Hartl2007; Orjuela-Sánchez et al. Reference Orjuela-Sánchez, da Silva, da Silva-Nunes and Ferreira2009) and Venezuela (Chenet et al. Reference Chenet, Schneider, Villegas and Escalante2012), being intermediate between those from hypoendemic settings in Peru (van den Eede et al. Reference Van den Eede, van der Auwera, Delgado, Huyse, Soto-Calle, Gamboa, Grande, Rodríguez, Llanos, Anné, Erhart and D'Alessandro2010b ) and South Korea (Iwagami et al. Reference Iwagami, Hwang, Kim, Park, Lee, Matsumoto-Takahashi, Kho and Kano2013) and those from meso- and hyperendemic settings in Africa (Gunawardena et al. Reference Gunawardena, Karunaweera, Ferreira, Phone-Kyaw, Pollack, Alifrangis, Rajakaruna, Konradsen, Amerasinghe, Schousboe, Galappaththy, Abeyasinghe, Hartl and Wirth2010), Southeast Asia (Gunawardena et al. Reference Gunawardena, Karunaweera, Ferreira, Phone-Kyaw, Pollack, Alifrangis, Rajakaruna, Konradsen, Amerasinghe, Schousboe, Galappaththy, Abeyasinghe, Hartl and Wirth2010; van den Eede et al. Reference Van den Eede, Erhart, van der Auwera, van Overmeir, Thang, Hung le, Anné and D'Alessandro2010a ; Orjuela-Sánchez et al. Reference Orjuela-Sánchez, Sá, Brandi, Rodrigues, Bastos, Amaratunga, Duong, Fairhurst and Ferreira2013b ) and Oceania (Koepfli et al. Reference Koepfli, Timinao, Antao, Barry, Siba, Mueller and Felger2013). The overall genetic diversity of P. vivax populations tends to correlate positively with the levels of malaria endemicity in each setting, with the puzzling exception of Sri Lanka, where the shrinking local parasite population maintained high levels of genetic diversity, detected not only with microsatellites (Gunawardena et al. Reference Gunawardena, Ferreira, Kapilananda, Wirth and Karunaweera2014; Table 3) but also with single-nucleotide polymorphisms (SNP) (Orjuela-Sánchez et al. Reference Orjuela-Sánchez, Karunaweera, da Silva-Nunes, da Silva, Scopel, Goncalves, Amaratunga, Sá, Socheat, Fairhurst, Gunawardena, Thavakodirasah, Galapaththy, Abeysinghe, Kawamoto, Wirth and Ferreira2010). The potential implications of this finding for malaria elimination efforts in Sri Lanka have been recently reviewed (Gunawardena et al. Reference Gunawardena, Ferreira, Kapilananda, Wirth and Karunaweera2014).
Table 3. Number of alleles and expected heterozygosity (H E) of 9 microsatellites in worldwide Plasmodium vivax populations

a References: [1] Van den Eede et al. (Reference Van den Eede, van der Auwera, Delgado, Huyse, Soto-Calle, Gamboa, Grande, Rodríguez, Llanos, Anné, Erhart and D'Alessandro2010b ); [2] Iwagami et al. (Reference Iwagami, Hwang, Kim, Park, Lee, Matsumoto-Takahashi, Kho and Kano2013); [3] Chenet et al. (Reference Chenet, Schneider, Villegas and Escalante2012); [4] Ferreira et al. (Reference Ferreira, Karunaweera, da Silva-Nunes, da Silva, Wirth and Hartl2007); [5] Orjuela-Sánchez et al. (Reference Orjuela-Sánchez, da Silva, da Silva-Nunes and Ferreira2009); [6] Gunawardena et al. (Reference Gunawardena, Karunaweera, Ferreira, Phone-Kyaw, Pollack, Alifrangis, Rajakaruna, Konradsen, Amerasinghe, Schousboe, Galappaththy, Abeyasinghe, Hartl and Wirth2010); [7] Orjuela-Sánchez et al. (Reference Orjuela-Sánchez, Sá, Brandi, Rodrigues, Bastos, Amaratunga, Duong, Fairhurst and Ferreira2013b ); [8] Koepfli et al. (Reference Koepfli, Timinao, Antao, Barry, Siba, Mueller and Felger2013); [9] Van den Eede et al. (Reference Van den Eede, Erhart, van der Auwera, van Overmeir, Thang, Hung le, Anné and D'Alessandro2010a ); [10] Gunawardena et al. (Reference Gunawardena, Ferreira, Kapilananda, Wirth and Karunaweera2014).
b DMZ is the Demilitarized Zone (border between South and North Korea).
c PNG is Papua New Guinea.
DISCUSSION
Plasmodium vivax diversity is influenced by the local patterns of malaria transmission, being positively correlated (except for the Sri Lankan population) with the levels of malaria endemicity in worldwide comparisons. However, an outbreak resulting from the near-clonal expansion of closely related parasites may affect several population-level parameters, such as H E, multilocus LD and the proportion of MCI. Accordingly, we observed the lowest parasite diversity in Remansinho, with the smaller proportion of MCI and the strongest LD, at the time of the malaria outbreak, offering a textbook example of epidemic population structure of a human pathogen (Smith et al. Reference Smith, Smith, O'rourke and Spratt1993). All population genetic parameters returned to pre-outbreak values during the last 2 years of study, despite the concomitant decline in malaria incidence. Moreover, we always recovered different parasite haplotypes from sequential infections in the same individuals, as well as from sequential samples collected during the same infection. Therefore, although cross-sectional surveys can offer useful snapshots of parasite diversity in different transmission settings, further longitudinal studies are required to examine the complex temporal dynamics of P. vivax polymorphism in individuals and communities.
A recent meta-analysis concluded that the structure of repeat arrays affects the mutation rate of P. vivax microsatellites; loci with non-perfect repeat types appeared to be more polymorphic, with higher number of alleles per locus and higher H E (Sutton, Reference Sutton2013). The present study combined 6 microsatellites with perfect trinucleotide repeats (MS1, MS3, MS4, MS7, MS9 and MS15) and 8 microsatellites containing non-perfect repeat arrays (Supplementary Table S1). These non-perfect repeat arrays are interrupted (e.g. TAAA repeats in MS2 are interspaced with non-repetitive TATA motifs) or comprise compound repeats (e.g. MS5 has tri- [CCT] and hexanucleotide [CCTCTT] motifs) or display complex structures (e.g. GGA and AGA repeats in MS10 are interspaced with non-repetitive sequences). Interestingly, 4 of the 5 microsatellites with the highest H E and highest allele numbers in the Remansinho population (Table 1) had non-perfect repeat arrays. These markers containing complex repeat arrays may have overestimated P. vivax microsatellite diversity in previous between-species comparisons with other sympatric human malaria parasites (Ferreira et al. Reference Ferreira, Karunaweera, da Silva-Nunes, da Silva, Wirth and Hartl2007; Orjuela-Sánchez et al. Reference Orjuela-Sánchez, Sá, Brandi, Rodrigues, Bastos, Amaratunga, Duong, Fairhurst and Ferreira2013b ).
Hypnozoite carriage and resulting relapses can, at least in part, account for the high prevalence of MCI usually seen in natural P. vivax populations (Havryliuk and Ferreira, Reference Havryliuk and Ferreira2009). Hypnozoites originating from several previous P. vivax infections can accumulate in the host's liver and awake simultaneously at the time of a new blood-stage infection, resulting in the co-circulation of multiple strains. However, frequent MCI do not necessarily translate into frequent outcrossing, which would disrupt the significant multilocus LD found in Remansinho and other Amazonian settings (Ferreira et al. Reference Ferreira, Karunaweera, da Silva-Nunes, da Silva, Wirth and Hartl2007; Orjuela-Sánchez et al. Reference Orjuela-Sánchez, da Silva, da Silva-Nunes and Ferreira2009; Rezende et al. Reference Rezende, Tarazona-Santos, Fontes, Souza, Couto, Carvalho and Brito2010; Van den Eede et al. Reference Van den Eede, van der Auwera, Delgado, Huyse, Soto-Calle, Gamboa, Grande, Rodríguez, Llanos, Anné, Erhart and D'Alessandro2010b ; Chenet et al. Reference Chenet, Schneider, Villegas and Escalante2012). Strong LD is a hallmark of P. falciparum populations from low-endemicity regions (Anderson et al. Reference Anderson, Haubold, Williams, Estrada-Franco, Richardson, Mollinedo, Bockarie, Mokili, Mharakurwa, French, Whitworth, Velez, Brockman, Nosten, Ferreira and Day2000), where MCI are rare and gametes with identical haplotypes often fuse in the midgut of mosquito vectors during the parasite's sexual reproduction. This explanation for frequent inbreeding under low-level P. falciparum transmission has been called the ‘starving sex’ or ‘passive clonality’ hypothesis (Tibayrenc and Ayala, Reference Tibayrenc and Ayala2014). However, the persistence of strong LD in highly diverse P. vivax populations with frequent MCI is unexpected under the starving sex hypothesis. Alternatively, P. vivax might display some degree of ‘active’ or ‘in-built clonality’ (Tibayrenc and Ayala, Reference Tibayrenc and Ayala2014), which would allow parasites to reduce their recombination load, defined as the loss of fitness as beneficial allele combinations are broken apart by meiosis (Charlesworth and Charlesworth, Reference Charlesworth and Charlesworth1975).
Population stratification, with non-random mating between members of subpopulations, might be an alternative explanation for the strong LD observed in Remansinho. A previous SNP study revealed a clear subdivision in sympatric P. vivax populations from another settlement in the Amazon Basin of Brazil (Orjuela-Sánchez et al. Reference Orjuela-Sánchez, Karunaweera, da Silva-Nunes, da Silva, Scopel, Goncalves, Amaratunga, Sá, Socheat, Fairhurst, Gunawardena, Thavakodirasah, Galapaththy, Abeysinghe, Kawamoto, Wirth and Ferreira2010), although the reasons for restrained recombination between them remain unclear. Moreover, mitochondrial genome sequencing showed divergent P. vivax clades circulating in South America, possibly as a consequence of independent parasite migration events (Taylor et al. Reference Taylor, Pacheco, Bacon, Beg, Machado, Fairhurst, Herrera, Kim, Menard, Póvoa, Villegas, Snounou, Cui, Zeyrek and Escalante2013). Nevertheless, we found no evidence that P. vivax populations from Remansinho are structured into stable, long-lasting microsatellite haplotypes. To the contrary, we found a short lifespan of multilocus haplotypes in this and all other P. vivax populations so far analysed longitudinally (Ferreira et al. Reference Ferreira, Karunaweera, da Silva-Nunes, da Silva, Wirth and Hartl2007; Orjuela-Sánchez et al. Reference Orjuela-Sánchez, da Silva, da Silva-Nunes and Ferreira2009). As mentioned elsewhere (Orjuela-Sánchez et al. Reference Orjuela-Sánchez, da Silva, da Silva-Nunes and Ferreira2009), these findings are somewhat surprising for a hypnozoite-producing parasite, since relapses could potentially allow the same P. vivax strain to repeatedly circulate in the host population. The high mutability of P. vivax microsatellites containing complex repeat arrays might account, at least in part, for the short lifespan of multilocus haplotypes in these communities. Furthermore, we found no evidence for a spatial clustering of microsatellite haplotypes (Supplementary Figure S3), arguing against the hypothesis that isolation by distance could explain the reduced meiotic recombination rate in parasites from Remansinho.
A series of elegant experiments showed that competition between Plasmodium chabaudi strains co-infecting the same host could increase malaria-related morbidity in mice (de Roode et al. Reference de Roode, Pansini, Cheesman, Helinski, Huijben, Wargo, Bell, Chan, Walliker and Read2005, Bell et al. Reference Bell, de Roode, Sim and Read2006, Mideo, Reference Mideo2009), but whether similar effects occur in natural mixed-genotype P. vivax infections in humans remains unknown (Havryliuk and Ferreira, Reference Havryliuk and Ferreira2009). Here we found that co-infection with 2 or more P. vivax strains did not affect the risk of clinical malaria attacks in Remansinho.
Population genetic measures can theoretically provide metrics for monitoring the effect of control efforts on the overall size of malaria parasite populations (Nkhoma et al. Reference Nkhoma, Nair, Al-Saai, Ashley, McGready, Phyo, Nosten and Anderson2013). A shrinking parasite population is expected to have reduced genetic diversity, low proportion of MCI, little outcrossing and strong LD. In the present study, the marked decline in malaria transmission in Remansinho since October 2011 was not mirrored by changes in these parameters. However, parasite genotyping proved useful for tracking a malaria outbreak associated with a single or a few related P. vivax strains introduced into the community. Monitoring the origin and spread of new parasite strains that can cause outbreaks is a major challenge in regions and countries approaching malaria elimination. This task may be greatly facilitated by the judicious use of molecular genotyping in the public health context, with the recent development of relatively simple, field-deployable barcoding strategies for malaria parasites (Daniels et al. Reference Daniels, Volkman, Milner, Mahesh, Neafsey, Park, Rosen, Angelino, Sabeti, Wirth and Wiegand2008).
SUPPLEMENTARY MATERIAL
To view supplementary material for this article, please visit http://dx.doi.org/10.1017/S0031182014001176.
ACKNOWLEDGEMENTS
We thank all inhabitants in Remansinho for their enthusiastic participation in this study; Amanda B. Gozze, Pablo S. Fontoura, Kézia Katiani G. Scopel, Nathália F. Lima, Carlos E. Cavasini, Vanessa C. Nicolete, Raquel M. Gonçalves, Maria José Menezes, Rosely dos Santos Malafronte, Ariel M. Silber and Cristiana F. Alves de Brito for laboratory support during fieldwork; Mônica da Silva-Nunes, Carla Roberta O. Carvalho and Mauro R. Tucci for the clinical care of patients; Cleide F. Nunes and Eusueli Arraes da Silva for microscopic diagnosis of malaria; Márcio C. Santana, Andrecresa N. Duarte and Francisco Naildo C. Leitão for overall logistic support; and Carmen S. A. Takata for help with microsatellite typing.
FINANCIAL SUPPORT
This research was supported by research grants from the Fundação de Amparo à Pesquisa do Estado de São Paulo (FAPESP), Brazil (grant no. 2010/50333-8) and the National Institute of Allergy and Infectious Diseases, National Institutes of Health, USA (grant no. U19 AI089681 to Joseph M. Vinetz). CLB is supported by the Coordenação de Aperfeiçoamento de Pessoal de Nível Superior, Brazil; SB is supported by FAPESP (Post-doctoral scholarship, 2013/23770-6); and MUF receives a senior researcher scholarship from the Conselho Nacional de Desenvolvimento Científico e Tecnológico of Brazil.


