


The proliferation of complex financial products such as payday loans, credit cards, rent-to-own, tax refund anticipation plans, and reverse mortgages, requires that consumers must become more sophisticated if they are to sail confidently through increasingly treacherous financial waters. Yet people are far from financially literate, by which we mean they lack the knowledge and ability to process financial information and make informed decisions about personal finances.Footnote 1 For this reason, policymakers and private organizations are increasingly seeking ways to enhance levels of financial literacy in the population at large.Footnote 2
Despite burgeoning interest in the topic, there is as yet little consensus on how and when to best target financial literacy training. Some contend that it should start young; for instance, Lusardi et al. (Reference Lusardi, Mitchell and Curto2010) found that having better-educated mothers raised their off springs’ financial knowledge, suggesting that such training may beneficially begin in childhood. Friedline et al. (Reference Friedline, Elliott and Chowa2013) showed that early access to savings accounts improved economic well-being and improved economic well-being could help lower-income young people lead better lives. Using Dutch and Norwegian data, Webley and Nyhus (Reference Webley and Nyhus2013) found that teenagers and young adults who had been encouraged to save and taught to budget were more conscientious, more future oriented, and better able to control spending. Cole et al. (Reference Cole, Paulson and Shastry2015) showed that high school can provide mathematics skills useful in informing subsequent financial behavior, Bernheim et al. (Reference Bernheim, Garrett and Maki2001) reported that savings was higher among students exposed to mandatory financial literacy training in high school and Tennyson and Nguyen (Reference Tennyson and Nguyen2001) showed that course mandates had positive impacts on test scores in the area of savings/investing. Others have identified the workplace as a fruitful arena for up-skilling (Bernheim and Garrett, Reference Bernheim and Garrett2003; Clark et al., Reference Clark, d'Ambrosio, McDermed and Sawant2006, Reference Clark, Morrill and Allen2012). Lusardi et al. (Reference Lusardi, Michaud and Mitchell2017) developed a calibrated stochastic life cycle model, which featured endogenous financial literacy accumulation. Their model predicted that providing pre-labor market financial knowledge to college graduates improves their wellbeing by an amount equivalent to 56% of their initial wealth. In a large meta-analysis of studies on financial literacy, Fernandes et al. (Reference Fernandes, Lynch and Netemeyer2014) argued that ‘there must be some immediate opportunity to enact and put to use knowledge or it will decay. Moreover, without a ready expected use in the near future, motivation to learn and to elaborate may suffer.’ (p. 30)
The present paper evaluates a quasi-natural experiment which provided college students an opportunity to take a financial literacy course. We control for endogeneity due to self-selection into courses: that is, more motivated students who seek financial education might make better financial choices than their less-motivated counterparts. To disentangle the effect of the training versus selection, we overcome this challenge by focusing on undergraduate students at a university in Singapore who used the university online bidding system to select their college courses. Each semester, all students received a fixed amount of fictitious e-dollar currency, which they then used to bid for their preferred classes. After the bidding process was complete, the computer system ranked bids in descending order and it then enrolled students starting with the highest bids on down until all vacancies were filled. Using a difference-in-difference estimation strategy, we compare the performance of students who bid enough to be admitted to the course, with that of students who bid for the course but could not enroll because they did not meet the minimum bid cutoff.Footnote 3 We argue that students who are more motivated to learn personal finance would set higher bid amounts to enroll in the course, so to account for student motivation and willingness to enroll in the course, we control for students’ bid amounts.
The contributions of this study are twofold. First, to our knowledge, no prior researchers have been able to differentiate the effect of motivation to undertake financial education from the effect of financial literacy training. Our identification strategy gives us a clean way to estimate the effect of financial education on various outcomes. Second, we use a comprehensive measure of financial knowledge that aggregates responses to more than a dozen questions covering various aspects of financial literacy. This variable is particularly relevant for the population under study as this group had very high initial levels of initial financial literacy.
Our results show that, after receiving the financial training, students were better informed on financial topics as measured by the percentage of questions answered correctly. We also find that the treatment group was more likely to make financial plans for the future, compared with the controls. In particular, students receiving the financial education showed an 11% improvement in financial knowledge scores and a 16% increase in the prevalence of financial planning. Course participation did not, however, change measured financial discipline, which is not surprising given that the students were not yet earning a living. Finally, the bid amount had no significant effect on any of the main estimates suggesting that selection bias may not be an important concern among undergraduate students. However, we also find that more motivated students are more likely to be financially disciplined.
In what follows, we next briefly review key studies relevant to our work, and we follow this with a discussion of our data and method. This is followed by a presentation of main results and a brief conclusion.
Prior studies
Several authors have sought to explore the links between financial education, financial literacy, and financial behavior among young adults. For instance Lusardi et al. (Reference Lusardi, Mitchell and Curto2010) reported that financial education among young adults in the National Longitudinal Survey of Youth (NLSY) was surprisingly low. Volpe et al. (Reference Volpe, Chen and Pavlicko1996); Chen and Volpe (Reference Chen and Volpe1998) confirmed that college students had little knowledge about investments, and women students were less informed than their male counterparts. Several other authors found positive links between college students’ financial knowledge and their financial behavior (Peng et al., Reference Peng, Martina, Bartholomae, Fox and Cravener2007; Borden et al., Reference Borden, Lee, Serido and Collins2008; Gutter and Copur, Reference Gutter and Copur2011; Xiao et al., Reference Xiao, Ahn, Serido and Shim2014).
Nevertheless, few authors have been able to address the identification problem noted above, making it difficult to isolate the independent effect of the training from the possible self-selection driven by unobserved motivation. Bernheim et al. (Reference Bernheim, Garrett and Maki2001) showed that US adults who had taken a high school personal financial management course saved more than those who had not taken the course. Their identification approach relied on differences in mandates across states and time periods. Brown et al. (Reference Brown, van der Klaauw, Wen and Zafar2013) used variation in finance, economics, and mathematics course offerings and graduation requirements mandated by state-level high school curricula to analyze the relationship between financial education and debt outcomes in early adulthood. Cole et al. (Reference Cole, Paulson and Shastry2015) employed state/time variations in high school graduation requirements to examine the impact of financial education on asset accumulation, and they concluded that state mandates requiring high school financial literacy courses did not boost the propensity to save. Moreover, the state adoption of these mandates was correlated with economic growth, which could have had an independent effect on savings and wealth accumulation. Lusardi and Mitchell (Reference Lusardi and Mitchell2009) concluded that state mandates for financial literacy programs did enhance saving, once differences in state spending levels were accounted for. Mandell and Klein (Reference Mandell and Klein2009) examined a matched sample of administrative records to identify high school students who had/had not taken personal financial management courses, and they concluded that there was little overall impact.
One problem with the prior studies is that their authors were unable to control for student self-selection, despite the real possibility that the more able, responsible, and motivated students would enroll in financial literacy training – and hence exactly those who would also be more likely to make sound financial choices. For instance, Mandell and Klein (Reference Mandell and Klein2007) showed that questions relating to motivation did add to explaining students’ financial literacy scores, after controlling for other important determinants of financial literacy. Meier and Sprenger (Reference Meier and Sprenger2010) showed that differences in individual time preferences helped predict which individuals chose to become financially literate. Fernandes et al. (Reference Fernandes, Lynch and Netemeyer2014) meta-analysis found much larger effects on financial behavior in observational studies as opposed to studies based on experimental and quasi experimental designs. They argued that this could reflect omitted variables bias in observational studies, since those typically getting financial education already had various psychological traits associated with careful management of finances. In other words, failing to control on individual heterogeneity in time preferences and motivation could produce biased estimates of the efficacy of financial literacy programs on student outcomes.
The handfuls of extant studies on young adults that have used experimental or quasi-experimental procedures have not provided strong evidence on the causal effects of financial education on financial knowledge and behavior. Gartner and Todd (Reference Gartner and Todd2005) evaluated a randomized test of whether offering online credit card education to credit cardholders was effective in changing behavior. They found no effects of financial education on college students’ timely payments and credit balances. Carlin and Robinson (Reference Carlin and Robinson2012) evaluated financial education among teenagers at a financial education theme park and found that students made better financial decisions after undergoing training. Nevertheless, the treatment assignment in their study was not randomized, casting doubt on the results. Skimmyhorn (Reference Skimmyhorn2016) used US military administrative data to evaluate the effects of a mandatory 8-hour financial literacy course given to all new US army enlisted personnel during 2007–08. While he found that course attendance doubled savings and generated lasting effects that persisted over 2 years, the external validity of that study is unclear due to its exclusive focus on US army personnel.
In sum, there remains substantial disagreement regarding the efficacy of financial education for the young. Only a few studies have had credible identification strategies and there is, at best, mixed evidence that financial education improves financial outcomes, particularly among college students. In what follows, we describe our approach, which overcomes these shortcomings.
The financial literacy course and enrollment process
Our experiment used students at a premier university in Singapore who employed that university's online bidding system to select their college courses. The program in question is the Financial Planning and Advisory course, offered to undergraduates as an elective. The course teaches students how to manage their personal assets and finance; it conveys an understanding of personal financial planning and asset management principles, while also explaining how to apply the principles in practice. The primary goal of the Personal Finance course is to help students achieve better financial outcomes for themselves and their families, taking into account that financial wellbeing requires young people to set realistic goals, develop thoughtful plans to achieve their goals, and learn to sacrifice short-term desires for long-term good.
Students taking this class are exposed to a wide range of topics covering basic financial concepts, financial planning tools and processes as well as investment products. The course covers concepts such as compounding of interest, inflation, trade-offs between risk and return, personal risk profiling, risk diversification, and asset allocation. Students are taught how to draw up a simple personal financial plan, develop cash budgets, manage liquid assets and consumer loans, buy a house and life insurance, minimize income taxes and estate duties, and plan for retirement. Students are also taught how to invest in bonds, equities, mutual funds, and insurance products.
The course enrollment process
To control on the self-selection considerations discussed above, our study takes advantage of the course auction process at a university in Singapore. At the start of each term, all students bid for courses using virtual currency called e-dollars (e$). To bid, a student had to devote a minimum of e$10 per course, and depending on his willingness to take the class, the student could allocate any amount of his or her e$ to that class. Our identification strategy relies on comparing outcomes for students who successfully bid and enrolled in the financial literacy class, with outcomes for students who bid for the class but did not enroll since their bids were just under the cutoff requirement. We also control for the amount bid, which is arguably a good proxy for student motivation level. As the total amount of e$ allocated per student each semester is fixed, students need to ration their bids in order to enroll in their preferred courses as well as to register for sufficient courses to progress in their studies. Our identification strategy gives us a clean way to estimate the effect of financial education on various outcomes. Further by controlling for the bidding amount, we argue that any ex-post observable differences between the groups may be attributed solely to the effect of the classroom training.
Specifically, given a fixed total number of e$, students at this institution made their course choices by taking into account what they perceived to be the demand and supply for the courses along with their academic study plans. Students generally treat the e$ as extremely valuable, since the courses in which they enroll determine their grades, performance, and the time required for graduation. The academic year is divided into semesters known as Term 1 (beginning in August) and Term 2 (beginning in January). At the beginning of each year, students were allocated e$ worth $100 for each Term; any unused e$ are transferred to the next Term. Bidding cycles for Terms 1 and 2 consisted of five rounds, namely rounds 1, 1A and B, 2 and 2A. The first three rounds (1, 1A, 1B) were scheduled before the start of the Term. Rounds 2 and 2A took place during the first 2 weeks of the Term. Students were informed of the bidding rounds in advance through the online system and received reminders via email. Any available spot in courses on offer could be bid for with a minimum bid value of e$10. The system did not allow students to bid for multiple places in the same course; places in multiple sections of the same course; or courses that had scheduling or examination time clashes with each other. After each student submitted his bids, the system ranked student bid amounts in descending order, and students were assigned to classes based on the highest bids until all vacancies were filled. Classes are generally capped at 45 students; so if the first round bids did not fill the course, two additional rounds were fielded, each lasting a week. The number of available seats was reduced with each passing round, and students who do not bid on time miss several class sessions. For that reason, all students keen to take a particular course tend to bid during the first round; generally the initial allocation to a given course reflects a student's motivation to take the class.
It is worth noting that the bidding system was sealed, so that students were unaware of the identities or bid amounts of other students. Additionally, student collusion on bidding was unlikely, since in the event of a tie bid (which occurred when the number of students submitting the same exact e$ bid for a section exceeded the number of vacancies available), the system awarded the bid to the student who placed his bid first. Accordingly, students were motivated to place their bids early to increase the probability of getting into the class. Those who were unsuccessful in their bids could bid for the course in subsequent bidding windows/rounds. Students who needed to drop a confirmed course could do so and receive a full refund subject to a maximum e$ refund for each bidding round.Footnote 4 In this way, the system's incentive structure was designed to dissuade students from bidding for a course simply as a safety net; that is, only students motivated to take a particular class ended up bidding.
The school's computer system collected data on the students who bid for the Financial Planning and Advisory course offered as an elective each term, and taught by two professors. Multiple sections were offered each term for most courses including the financial planning class. At the beginning of each academic term and before classes started, the registrar's office provided a list of IDs and amounts bid by students vying for the class. We then sent emails to all of these students, asking them to fill out the baseline surveys (irrespective of whether their bids were successful). Reminders were sent out every week until the deadline for completing the survey was reached. A typical email sent to students is provided in the Appendix. The baseline survey included questions about the students’ family background, work experience, financial attitudes, behavior and interests, financial planning capabilities, and financial knowledge. A follow-up survey similar to the baseline was fielded 5 months after, at the end of the term. As an incentive to complete each survey, students were granted a grocery store voucher worth $10.
Descriptive statistics
At the beginning of each term, we divided the course applicants into a Treatment and a Control group based on the cutoff for successful bids for each bidding round. The Treatment group comprised students whose bids were above the cutoff and who were thus invited by the computer system to enroll in the financial literacy course. The Control group included students whose bid amounts were below that semester's computer cutoff. If students bid multiple times, we assigned them to Control and Treatment groups based on the result of their last round in the bidding cycle. However, if a student bid multiple times even in the last round, we assign him or her a value equal to the average of the multiple bids in the last round. Our database spans four terms over two academic years (i.e., 2011–12 and 2012–13). Over these four terms, 743 students bid for the course. The response rate for the survey was 632 responses comprising 376 responses to the baseline (51%) and 256 (34%) to the endline survey. Our sample of 632 includes 151 (24%) in the control group and 481 (76%) in the treatment group.Footnote 5
Note that the willingness to pay for a financial education course does not have a sharp discontinuity around the cutoff for bids. As a result, we do not observe a single cutoff bid that can be used to run a quasi-experimental strategy like Regression Discontinuity Design (RDD). There are two reasons for this; first, students were assigned to the class based on their bid amounts on a first-come-first-serve basis. For instance, consider three students, student A with an e$ bid amount of $40, student B with a bid of $41.88 and student C who bid $38.67 in round 1. However, student A bid for the class a few days after Student B and C. After the bidding cycle closes, the system sorts students in a descending order and assigns them to the class based on whether or not they were above or below the cutoff bid and on a first-come-first-serve basis. Thus, even though student A's bid was higher than student C's, he or she is unsuccessful in enrolling in the course as the class may have reached its maximum capacity of 45 students. On the other hand, both student B and C are successfully assigned to the class.
Figure 1 below shows the percentage of students by treatment status who bid for a certain amount of e$. Two observations are evident from the figure. First, there is significant overlap of bids between the two groups. This is consistent with the first come first serve rule for assignment to a class in addition to the amount bid. A control group student who bid the same amount as a treatment group student would be unsuccessful in registering for the class if they were late in bidding.
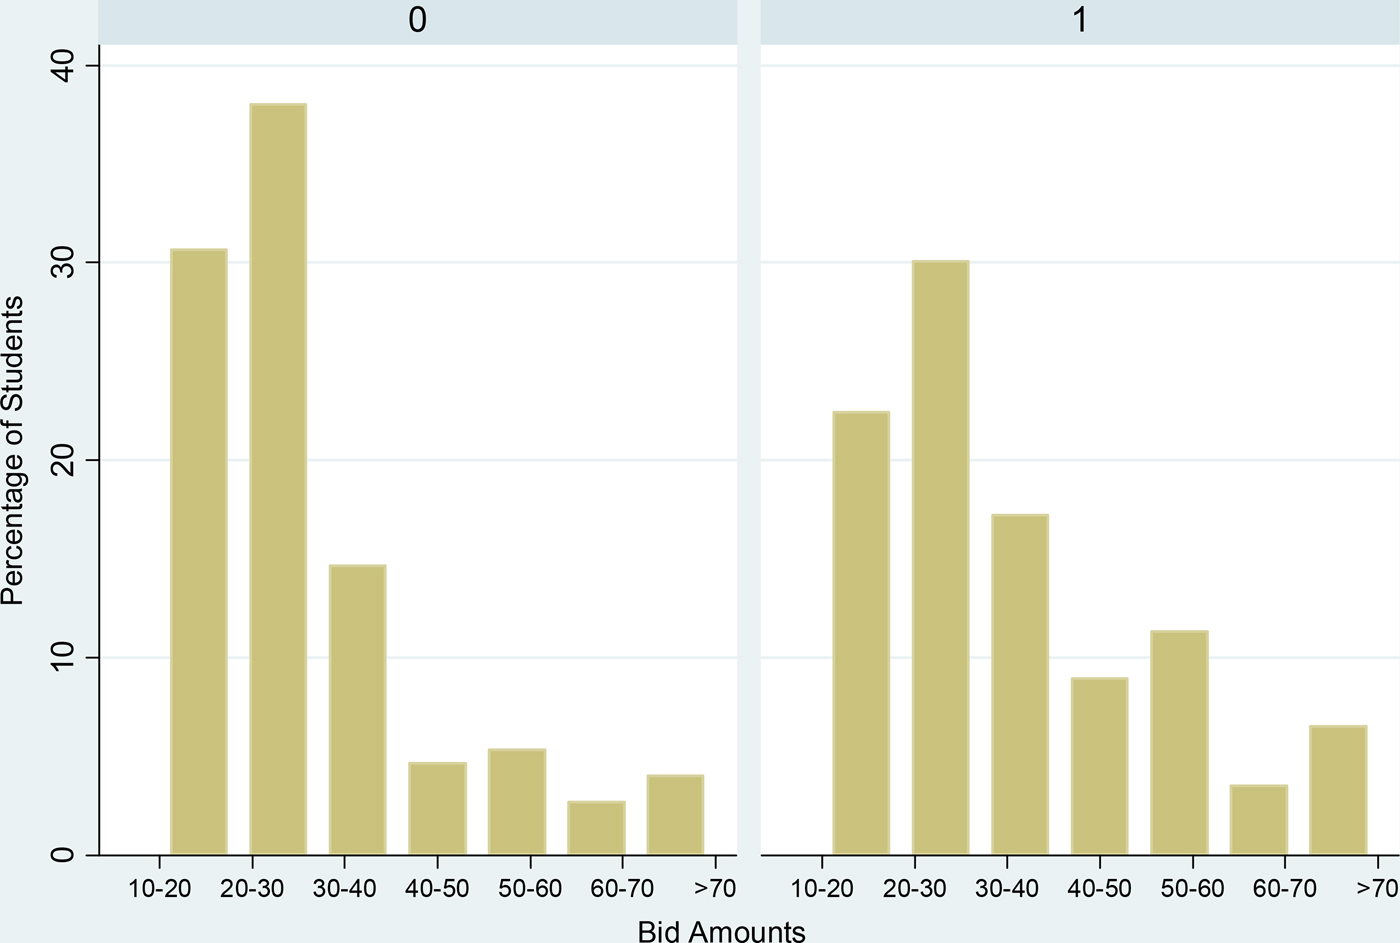
Figure 1. (Colour online) Percentage distribution of bid amounts by treatment status.
Second, there is a higher percentage of students in the control group bidding for smaller amounts. The distribution is skewed towards the lower tail for the control group. On the other hand, a large percentage of students in the treatment group bid higher amounts. Thus students with higher bid amounts are more likely to get assigned to the financial planning class.
Another reason that we do not observe a clear cut-off bid is that students are allowed to bid in multiple rounds. For example, imagine that student B decides to drop the class. Thus a new vacancy is created and the university opens up the second round of the bidding cycle, round 1A. Student A now bids a smaller amount, say $21.88, but still manages to enroll in the course based on the cutoff for this round. For the purpose of our analysis, all three students are a part of the treatment group since in the event of a student bidding in multiple cycles, we assign them to treatment and control groups based on the last round of bidding.Footnote 6 Though we could use a Fuzzy-RDD approach, which relies on the weaker assumption that there is a discontinuity in the probability of treatment, we are restricted in our choice of empirical strategy by the sample size and concerns of statistical precision. Note that restricting the sample to those students who only bid in one round also does not eliminate overlap of bids due to the reasons stated above.
Table 1 presents descriptive statistics for the baseline survey data. Column 1 presents means (and standard deviations in parentheses) of the main pre-Treatment variables, while Columns 2 and 3 report means for the Treatment and Control groups, respectively. Column 4 presents t-statistics for differences in means at the baseline (with p-values in parentheses). Panel A shows that the mean bid amount for entire sample was around e$32: this was a high value by university standards for elective courses, underscoring the high importance that students assigned to the financial literacy course. As expected, the Treatment group bid more on average, and the difference between the Treatment and Control groups was statistically significant (t = −1.93, p-value = 0.06). Otherwise the two groups were quite similar at baseline, with the same proportion of males and females, similar ages and academic performance as measured by Grade Point Averages (GPAs).Footnote 7 There were no statistically significant differences between Treatment and Control groups in terms of maternal education (indicated by four dummy variables), an indicator for socioeconomic status.Footnote 8
Table 1. Pre-treatment (baseline) characteristics by treatment status

Standard deviations and p-values (for t-statistics) in parentheses; difference significant at the ***1%, **5%, *10% levels.
The age variable equals 1 if the pupil was age 18–19, 2 if age 20–21, and so on to 5 for age 26+.
The average age was 22–23, and the age difference between groups is not statistically significant.
The GPA variable takes a value between 1 and 6 where, GPA = 1 if actual GPA was below 2.0.,
2 if between 2 and 2.69, 3 if 2.7–2.99, 4 if 3–3.69, 5 if 3.7–3.99, and 6 if actual GPA was 4.
Next we compare the effect of the financial education course on five key outcomes. The first measure is financial literacy, measured as the proportion of questions answered correctly of the three widely-used questions in the literature (Lusardi and Mitchell, Reference Lusardi and Mitchell2007a, Reference Lusardi and Mitchellb). These three include one on compound interest, another on inflation, and the last on risk diversification. Our second outcome variable was a more comprehensive financial knowledge variable defined as the percentage of questions correct of the 13 total questions asked of the students. These included the three basic financial literacy questions just mentioned plus ten others that measured student knowledge of bank accounts, net worth, bounced checks, net present values, taxes, retirement savings, investments, stocks, mutual funds, credit cards, and related finance charges.Footnote 9
Our remaining three outcomes variables had to do with financial planning, prudence, and personal financial discipline. Specifically, we asked questions that required students to rate how important it was for them to plan for future saving, investments, buying a car or a home, setting aside money for children's education, and saving for retirement. In particular, we asked them to rate these options as follows:
Using the scale given below, please rate your ability in achieving the following activities: 1. Did not think about it; 2. Started thinking about it; 3. Beginning to plan for it; 4. Have developed a plan but not executed; and 5. Implemented the plan.
The financial planning variable was defined by the total score on these six options (in percentage terms), where a higher percentage implied doing better on financial planning. Similarly, an individual would be considered more financially prudent based on his percentage score on six questions pertaining to spending less than his income, maintaining health insurance coverage, knowing about the risks associated with credit cards, paying credit card bills in full each month, putting money aside for future needs, and acknowledging that life insurance was important. A similar scaling method is used with higher percentage scores associated with more financially prudent behavior. Finally, the financially disciplined were identified as those who scored well on four measures: maintaining financial records; enjoying thinking about money management; felt in control of current financial situation; and felt capable of handling future financial and investment decisions.
Table 1, Panel B, reports the means and standard deviations for these five outcome variables. Interestingly, the students’ initial financial literacy score of 87% was quite high, as was the percentage of financial knowledge questions answered correctly, 70%. The lowest percentage score was for financial planning, at 40%. Finding such high levels of financial literacy is not surprising inasmuch as students in Singapore tend to cover topics related to interest rates and inflation in high school. These high levels of financial literacy also imply that, for them, a more detailed measure of financial knowledge incorporating knowledge of credit cards, net present value, taxes, retirement planning, is needed to discriminate between students. This we accomplish with our more complete measure of financial knowledge. The t-test for pre-treatment differences in outcomes between the treatment and control group is insignificant for all outcomes except financial planning (t = 1.92 with a p-value = 0.06). Incidentally, the raw difference indicates that the control group had higher financial planning skills at baseline.
Table 2 reports the means of our five outcome variables for both Treatment and Control groups; the latter are reported for both the baseline and post surveys. Differences in means appear in column (3) along with significance tests. For all five outcome variables, the simple difference in difference estimate is positive (shown by the bolded values), and it is statistically significant in two cases, namely for Financial Knowledge and Planning. These results can be interpreted, at first pass, as the causal effects of the financial literacy course under the assumption that, in the absence of the program, the outcomes would not have changed differentially between those who successfully bid for class and those whose bids were unsuccessful. Students whose bids were successful were 8% more likely to answer the financial knowledge questions correctly. Their financial planning capabilities were also boosted by 7% compared with the Control group, and all these coefficients are statistically significant at the 5% level.
Table 2. Outcomes by treatment status and time period (D–D)

Standard errors in parentheses; difference significant at the ***1%, **5%, *10% levels.
Table 3 reports the percentage of students who answered correctly, in the baseline and endline surveys, the 13 questions on financial knowledge. There is some variation in the baseline in the initial level of financial knowledge ranging from 31% students knowing the difference between a tax rebate and tax relief to 88% students having knowledge of inflation rates. In the endline survey, students are much more likely to answer correctly the question on bounced checks (i.e., an increase from 55% to 68%), the question on long-term investment options (52% versus 64%) and knowledge of fixed deposits (63–72%). In a recent review of the literature, Lusardi and Mitchell (Reference Lusardi and Mitchell2014) note that when comparing financial literacy across countries, people have the most difficulty answering the risk diversification question. It is interesting to note that among Singaporean undergraduate students, financial literacy, as measured by the three standard questions # 10, 11, and 12 is high to begin with. Moreover, in the endline survey, there is a 6% increase in proportion of students who answer the question on risk diversification correctly.
Table 3. Financial knowledge questions: percent answered correctly
Evaluating the impact of the financial education program
Our goal is to evaluate the impact of enrolling in the financial education course (D i = 1 versus 0) on financial knowledge and other outcomes of interest (Y i). One way to do so might be to estimate the following OLS regression using the subset of those who enrolled in the course, controlling for a vector of observable individual and family background characteristics (X i):
 $$Y_i = \alpha _1 D_i + \gamma {\rm ^{\prime}}X_i + \varepsilon _i. $$
In principle, the coefficient α 1 would measure the impact of the financial education program on student outcomes for those who enrolled in the course. But if students did self-select into the financial literacy course based on unobserved characteristics (ε), the OLS estimate of α 1 will be biased. For instance, students more motivated to save or make financial plans could also have been more likely to enroll in the course, thus biasing the estimated coefficient of interest.
To control for such a possibility, we add to the model student bids for the course as a control variable, on the grounds that students allocated their e$ according to their levels of interest in the course. We also include term-specific fixed effects in the specification to allow for the possibility that students could have bid more for a popular professor or for a particular time that suited their schedules. All regressions also control for maternal education, student academic ranking, sex, and age, as shown in Table 1. Finally, since students with better cognitive ability might also be more financially literate (McArdle et al., Reference McArdle, Smith, Willis and Wise2011), we also control for students’ Grade Point Average (GPA). Accordingly, an extended regression model can be estimated using students who enrolled in the course, controlling for motivation (Bid) and professor quality (T):
 $$Y_i = \beta _1 Post_i + \beta _2 Bid_i + \beta _3 T_i + \gamma ^{\prime}X_i + \mu _i. $$
Here Post is a variable that takes on the value of 0 when the survey was taken at baseline (before the course began), and 1 at the end of the term. Now the coefficient β 1 measures the efficacy of the course, and the Bid variable refers to each student's e$ bid for the course. If student heterogeneity were associated with individual motivation or discount rates, we would anticipate that the Bid variable would control for these unobserved factors. T controls for the term in question.
One could argue that bids are likely to be influenced by more than students’ interest in financial education. Students may be influenced to bid based on perceived professor quality, known difficulty or ease of assessment, location of classes, personal timetabling etc. However, professor quality, location and difficulty of assessment or any course specific factor should be common knowledge and should affect the decision to bid and not the amount of bid. Since both the treatment and control group bid for classes, any such factor should get differenced out by the control group. Time tabling is unlikely to be a constraining factor as multiple sections (at least two sections) of each of the courses are offered every term by the same faculty. Finally, we include controls for the term, which is a proxy for teacher fixed effects since our data spans across two instructors who taught four terms over two academic years (i.e., 2011–12 and 2012–13).
Students may also bid higher if their friends select to bid for the same class. However, as explained earlier, student collusion on bidding was unlikely, since in the event of a tie bid (which occurred when the number of students submitting the same exact e$ bid for a section exceeded the number of vacancies available), the system awarded the bid to the student who placed his bid first.
Empirical results
Table 4 presents alternative ways to measure the impact of the Financial Education course, on all five outcomes for the enrolled sample. The approach follows the setup in equation (2), which includes both the bid amount and term fixed effects. Results show that the financial education class had no effect on financial literacy, once bid amounts are controlled. Also GPA is highly significant, suggesting that students with better cognitive skills also have higher levels of financial literacy. This is consistent with Lusardi et al. (Reference Lusardi, Mitchell and Curto2010) who found a positive correlation between financial literacy and cognitive ability among young NLSY respondents.
Table 4. Effect of financial education on key outcomes (treatment only)
Regressions also control for mother's education as well as student's academic standing, sex, and age. Significant at ***1%, ** 5%, * 10%.
Taking the financial education class boosted overall financial knowledge levels by 5.4 percentage points; this effect is highly statistically significant. Taking the course also increased the probability of undertaking financial planning: Column (3) shows a 5.2% increase, or a 12.3% point increase, relative to the mean. Since financial knowledge in the treatment group at baseline was 71%, the class boosted financial knowledge by approximately 7.6%. Student bid amounts were marginally significant and quantitatively small, while those with higher GPAs were more financially savvy. Financial prudence was not strongly increased as a result of the course, but financial discipline did rise by 5.3% (or 8.3 percentage points over the 64% mean at baseline).
While equation (2) controls for unobserved determinants of class enrollment, it does not account for time-varying factors that might also have influenced the outcome variable. For example, those electing the course could have done so due to some negative personal experience.Footnote 10 If so, our results might overstate the effect of the course. Alternatively, students who experienced a sudden windfall increase in income may have been more likely to look for ways to save and invest, and hence would have bid more for the financial education class. In the latter instance, we would understate the effect of the course. In other words, even after controlling for motivation, we may not have completely eliminated sources of bias due to unobserved time varying factors.
To examine this question in more depth, we ask whether the decision to bid for the course might be correlated with individuals’ unobserved time varying characteristics. To this end, we now compare results with those of a control group, which did not enroll in the class. Specifically, the control group is defined as students who applied to take the course but bid unsuccessfully. This is useful in helping us difference out confounding characteristics that otherwise could bias our measured program effects. To this end, we define a variable Treat = 1 if the student successfully bid for the financial education class, whereas Treat = 0 indicates the student bid for the course but did not meet the cut-off set by the university. Next we estimate the following specification:
 $$\eqalign{ Y_i & = \gamma _1 Treat + \lambda _2 Post_i + \gamma _3 Treat \times Post_i + \cr & \quad \gamma _4 Bid_i + \gamma _5 T_i + \gamma ^{\prime}X_i + v_i.} $$
Here the coefficient γ 3will capture the difference-in-difference (D–D) estimate of the impact of financial education on our key outcomes, having controlled for the other X variables discussed above.Footnote 11
Table 5 presents regression estimates for the D–D specification including all controls in Table 4. The coefficient of most interest (γ 3) here is that on the interaction term, as it reflects the D–D estimate for the effect of the financial course on the five financial outcomes of interest. As before, the course had the most important and statistically significant impact on Financial Knowledge and Financial Planning. That is, students with successful bids were approximately 8 percentage points more financially knowledgeable due to the course, relative to students with unsuccessful bids; in other words, the course produced an 8 percentage point increase in the financial knowledge score, and the effect was significant at the 5% significance level. Relative to the mean financial knowledge (70% from Table 1), this translates to an 11% increase in financial knowledge. Similarly, financial planning increased by 16% (coefficient of 0.065 on an average financial planning score of 40%). No significant effects of the course were detected on financial literacy, prudence, or discipline. The former finding is not surprising as students’ levels of knowledge were already quite high. The latter two variables are more likely to measure long run behavioral outcomes, so we expect less of an immediate impact for students not yet earning incomes.Footnote 12
Table 5. Effect of financial literacy on key outcomes (full sample)
Regressions also control for mother's education as well as student's academic standing, sex, and age. Significant at ***1%, **5%, *10%.
Interestingly, while financial discipline was positive and significant in Table 4, we do not find any effect on this outcome variable in the extended Table 5 model. One explanation consistent with this result is that individuals who face a sudden lack of discipline in financial matters (such as an increase in frivolous expenses), maybe due to a windfall increase in income, are more likely to bid for a financial education course. It is also worth pointing out that the bid amount had no significant effect on the point estimates shown in either Tables 4 or 5.Footnote 13 This suggests that the selection bias may not be an important concern among undergraduate students. However, we chose to show the most complete specification controlling for the motivation effect. Moreover, for financial prudence and financial discipline, the coefficient on the bid amount is marginally positive and highly significant suggesting that more motivated students are more likely to be financially disciplined.
Finally, in Table 6, we study the effect of financial education on different outcomes related to credit card usage. Consistent with Gartner and Todd (Reference Gartner and Todd2005) who find insignificant effects of financial education on credit card-related outcomes, we find no effect on the number of credit cards held, probability of maintaining credit card related financial transaction records, and the probability of paying a late fee at least once in the past 12 months. For the outcome variable ‘number of credit cards held’, as shown in column (1), bid amount is positive and significant.
Table 6. Effect of financial literacy on credit card usage

Regressions also control for mother's education as well as student's, academic standing, sex, and age The outcome variables in column (2) and (3) are the probability of maintaining credit card related financial transaction records and the probability of paying a late fee at least once in the past 12 months, respectively. Significant at ***1%, **5%, *10%.
Robustness checks
One concern with the results is that they may be driven by the least or most motivated students in a cohort. To check the robustness of our results to extreme bid amounts, we drop the highest and lowest 20% of bids from our data i.e., we drop bid amounts <17 and >48 from the sample (reducing our sample by 262 observations). Though not shown here, the regression coefficients remain comparable throughout. In particular, financial knowledge increases by 8.5 percentage points and the result stays significant at the 5% level. The coefficient on financial planning stays at 0.067 though significance drops to the 10% level due to the smaller sample size.
The interaction between round and amount of bid could be more closely related to motivation than amount alone. We ran regressions controlling for the number of bids (which is a proxy for the round in which bid was successful) as well as regressions that include the interaction of bid amount with round (in addition to including these variables separately as regressors). Financial knowledge and financial planning continue to be positive and significant. Moreover, both the bid round and the interaction between the round and bid amount are not statistically significant in these regressions. Thus, our results are robust, including both the bid amount and the round in which bid was successful as additional control variables.
Discussion and conclusions
Policymakers are increasingly focusing on financial literacy as a way to reduce the peoples’ exposures to capital and labor market risks, raise saving rates, and perhaps reduce dependency on old age transfer systems. Indeed, lives can be ruined and families broken when individuals lose control over money matters, and financial planning can help people avoid such outcomes.Footnote 14 Nevertheless, there has been little evaluation of experiments in which people are provided explicit training in the field. Moreover, few have focused on which groups of individuals might be most susceptible to such coursework.
Our paper evaluates how a financial literacy training program for college students in Singapore influenced their financial knowledge levels. While prior studies have found a positive correlation between financial literacy and better saving, investment, and planning behavior, they have not provided much insight into the causal mechanisms driving this relationship. The present study traces the impact of a financial education course on college students, a group of interest as students are on the verge of entering the workforce and face a lifetime of financial decision making. We demonstrate the efficacy of classroom-based financial planning education among this population by addressing endogeneity issues and controlling on fixed effects in an experimental setup. Our data comes from undergraduate students at a university in Singapore who used the university online bidding system to select their college courses. Each semester, all students received a fixed amount of fictitious e$ currency, which they then used to bid for their preferred classes. Using a D-D estimation strategy, we compare the performance of students who bid enough to be admitted to the course, with that of students who bid for the course but could not enroll because they did not meet the minimum bid cut-off.
Our results indicate that a financial course like this can boost young persons’ financial knowledge and improve their financial planning capabilities. Specifically, we conclude that the financial education class produced an 11% increase in student financial knowledge score and a 16% increase in financial planning. Our conclusion is robust to alternative ways of measuring financial knowledge. At the same time, we acknowledge that the treatment groups’ scores in the post-study survey may be influenced by their motivation to achieve a high grade in their personal finance subject. This may create a ‘just in time’ motivation to learn the subject content. Our experimental set up does not allow us to control for such Hawthorne effects. Thus, the results might be overestimated.
In sum, our results support the recommendations of Lusardi et al. (Reference Lusardi, Mitchell and Curto2010), who proposed that financial education be provided to the young. Indeed a recent survey found that students, housewives, the unemployed, and retirees have the least financial knowledge, compared with other segments of society (Monetary Authority of Singapore, 2005). Additional financial education could beneficially help the young before they engage in financial contracts and make irreversible financial decisions.
Appendix
Invitation to the experiment
Students in our experiment receive emails at the beginning of each term. A similar follow-up email was sent out at the end of each term.
Dear Students,
We want to conduct a short survey to get information from students on their financial knowledge and planning. This information will be useful for us in understanding financial decision making and behavior among undergraduate students and also to improve on and add more courses in future that might be helpful to students. The information gathered from the survey will be held anonymous and completely confidential at all times.
As a research assistant for this project, I seek your help to complete this survey as your participation is crucial to the success of this project. We conducted a lottery of SMU students and you have been chosen to be a part of this study. As a token of our appreciation for completing the survey, we will give you a compensation of $10 in the form of food/grocery vouchers. The vouchers will be distributed in week 34. You will be contacted again with a second survey that will be administered in a few months. We would compensate you once again with $10 for completing the second survey. Please feel free to email either me or Professor XXX if you have any questions or concerns about the survey or the payment. I would appreciate if you can fill out the survey, which should take about 30 minutes by. Note that you must answer all questions in order to be eligible for the voucher.
KINDLY COMPLETE THE SURVEY BY 25th August, Saturday, 11:59 PM to be eligible for the $20voucher.
Financial education questions
Students were presented with the questions below, with only one correct answer to each question. These questions were as follows (where correct answers indicated in bold with asterisk):
(1) Personal Net worth is:
A. The difference between income and expenditures
B. The difference between assets and liabilities*
C. The difference between cash inflow and outflow
D. The difference between borrowings and savings
E. None of the above
(2) Which account usually pays the MOST interest?
A. Fixed or Time deposit*
B. Savings deposit
C. Checking or current account
(3) When a check bounces, who is usually charged a fee?
A. The check writer only*
B. The person to whom (payee) the check is written only
C. Neither the check writer nor the person to whom the check is written
D. Both the check writer and the person to whom the check is written
(4) At age 25 Rob began saving $2,000 a year for 10 years and then stopped at age 35. At age 35, Molly realized that she needed money for retirement and started saving $2,000 per year for 30 years and then stopped at age 65. Now they are both 65 years old. Who has the most money in his or her retirement account (assume both investments had the same interest rate)?
A. Molly, because she saved more money overall
B. Rob, because his money has grown for longer period of time
C. They would each have about the same amount
D. Unable to determine with information provided*
(5) Is a $500 tax rebate or a $500 tax relief more valuable to you?
A. A $500 tax rebate*
B. A $500 tax relief
C. They are the same
D. Depends on your tax bracket
E. Don't know the answer
(6) Assume you are in your early twenties and you would like to build up your nest egg for a secure retirement in 40 years. Which of the following approaches will help you accumulate a sizeable nest egg for retirement?
A. Start to build up your savings account gradually in an insured bank
B. Save money in certificate of deposit accounts
C. Put monthly savings in a diversified growth mutual fund*
D. Invest in long-term Treasury bonds
E. Accumulate money in a safe-box rented from a local bank
(7) Which of the following combination of investments is most risky?
A. A mutual fund containing 80% stocks and 20% bonds
B. A mutual fund containing 80% bonds and 20% stocks
C. An index fund (like the S&P 500)
D. Stock of a single company*
(8) Hector and Maria just had a baby. They received money as baby gifts and want to put it away for the baby's education. Which of the following tends to have the highest growth over periods of time as long as 18 years?
A. A Government savings bond
B. Stocks and mutual funds*
C. A savings deposit account
D. A fixed deposit account
(9) If Susan and Joe have money put aside for emergencies, in which of the following forms would it be of LEAST benefit to them if they needed it right away?
A. Savings account
B. A house*
C. Stocks
D. Checking or current account
(10) Suppose you had $100 in a savings account with 2% interest per year. After 5 years, how much would you have in the account if you left the money to grow?
A. More than $110*
B. Exactly $110
C. Less than $110
D. Do not know
E. Refuse to answer
(11) Imagine that your interest rate on your savings account was 1% per year and inflation rate was 2% per year. After 1 year, how much would you be able to buy with the money in this account?
A. More than today
B. Exactly the same
C. Less than today*
D. Do not know
E. Refuse to answer
(12) Is it true or false that buying a single company's stock usually provides a safer return than an equity unit trust or mutual fund?
A. True
B. False*
C. Do not know
D. Refuse to answer
(13) Which of the following credit card users is likely to pay the GREATEST dollar amount in finance charges per year, if they all charge the same amount per year on their cards?
A. Jessica, who pays at least the minimum amount each month and more, when she has the money
B. Vera, who generally pays off her credit card in full but, occasionally, will pay the minimum when she is short of cash
C. Megan, who always pays off her credit card bill in full shortly after she receives it
D. D. Erin, who only pays the minimum amount each month*


