
Introduction
Emphasis has increasingly been placed on the importance of governance systems that link multiple levels of an organization in order to understand how the characteristics of the organizational context to which individuals belong may affect their behaviors. The premise is that interactions between individuals and organizations influence individual behaviors and shape organizational characteristics and properties, management, operations, and technologies of production and provisions for governance (Heinrich & Lynn, Reference Heinrich and Lynn2000; Zaccarin & Rivellini, Reference Zaccarin and Rivellini2002). Although recent theoretical discussions and empirical investigations have increased the attention given to governance-level concerns, most works that combines individual and organizational factors has employed either organizational or individual analyses (Meier, O'Toole, & Nicholson-Crotty, Reference Meier, O'Toole and Nicholson-Crotty2004). On the one hand, the study emphasizes the impact of job- or management-related factors on employees’ perceptions and organizational situation. On the other hand, researchers who are interested in studying job- or management-related factors at the individual level of analysis have linked employees’ perceptions to the outcome variable. Both approaches have made significant contributions to explaining outcome variance. However, neither approach adequately accounts for outcome variable. The organization-level approach ignores meaningful individual differences whereas the individual-level approach neglects contextual factors that can influence and constrain individual behaviors. Examining one level at a time prevents researchers from knowing whether factors at one level remain important in explaining outcome variables after factors at the other level are accounted for without the generation of specification errors (Kozlowski & Klein, Reference Kozlowski and Klein2000). The other problem relates to generalizability and data aggregation in data sets. All too often, organizational and individual data are combined, despite important and substantive differences in their levels of interactions (Lewis & Nice, Reference Lewis and Nice1994). Furthermore, other studies may aggregated across multiple employees of the same organization (i.e., organizational climate) or by the uses of existing data collected (perhaps routine data on size, turnover, etc.) at the level of the organization (i.e., contextual data). The organizational research involves the aggregation of individual to organizational data; once acceptable within-organization agreement is now considered little more than a statistical hurdle in establishing a rationale for aggregation (Meade & Eby, Reference Meade and Eby2007). Such an approach may suffer from the limitations of conventional statistical methods for multiple levels of data, including problems with accurately estimating standard errors, assessments of model fit and explained variance, omitted variable bias, and loss of information (Heinrich & Lynn, Reference Heinrich and Lynn2000). Measurement errors might have hidden real changes and biased statistical results that partially and spuriously explain individual variances in hierarchical levels. In order to model these interactions of organizations appropriately, some researchers have recommended the use of multilevel methods in order to ensure that organization-level impacts are correctly measured and utilized. Failing to do so results in research modeling strategies that are flawed and that may yield inaccurate results. Conclusion may be consistent but based upon biased estimated if clustering effects are ignored.
However, little research has provided convincing answers by constructively comparing the results estimated by different data arrangements (e.g., disaggregation, aggregation, and weighting) with different analytical methods (e.g., OLS, multilevel model). That is, the current research is mainly interested in testing various research designs that often were used by the previous research. Thus, the current research employed the 2000 National Partnership for Reinventing Government (NPR) Employee Survey, which gathered feedback from full-time civilian federal employees in federal agencies, to compare multilevel-level variation on key issues in job satisfaction. The comparative estimates were generated by assessing how, in different data arrangements, individual and organizational factors influence job satisfaction with multilevel models as compared to ordinary least squares (OLS) through aggregation test, regression diagnosis, and informational criteria. The current research does not focus on hypothesis testing that composes the theoretical framework. Rather, this research aims to advance knowledge in whether different research designs can provide the reliable and valid answer.
The current study follows by a summary of the main sections: First, it presents a brief description of the close connections between the individual and the organizational level. Second, it explains the methodological strategies used to link individual and organizational data. The empirical results are then presented and compared, along with the OLS analysis and the multilevel analysis, by different data arrangement in terms of their impact on model parameters and estimates of job satisfaction. Next, the weakness and advantages of different data arrangements employing individual and organizational variables in terms of unbiased, reliable, and consistent results as well as research validity are discussed. Finally, the research limitations and future research directions are addressed.
Individual employee working in an organizational context
Organizations have special features that influence the analysis of processes and outcomes of theoretical importance in organizational research. Organizations are inherently hierarchical. Individuals are nested in work groups, work groups are nested in departments, departments are nested in organizations, and organizations are nested in environments (Klein, Dansereau, & Hall, Reference Klein, Dansereau and Hall1994). Employees bring certain skills and attitudes to the workplace, and they are clustered in work units with certain characteristics (Heck & Thomas, Reference Heck and Thomas2009). Given this characteristic, each organization or level affects the job behaviors of employees. Job behaviors may be influenced by combinations of variables related to employees’ backgrounds and attitudes (e.g., experience, education and work-related skills, attitudes and motivations), processes of organizational work (e.g., leadership, decision making, staff development, organizational values, resource allocation), the context of the organization, or the cross-level interactions of these variables within the structure of the organization (e.g., size, management arrangements within its clustered organizations; Heck & Thomas, Reference Heck and Thomas2009; Hofmann & Gavin, Reference Hofmann and Gavin1998). For example, job satisfaction first involves the fit between an employee's characteristics (e.g., personality, background) and those of an organization (e.g., structure, culture). Second, job satisfaction involves the interaction of organizations and employees according to how well they meet each other's needs. Job satisfaction results when employees suit their organizations. These processes cumulatively move toward homogeneity, in which members of the same organization are more similar to each other than they are to members of other organizations (Ployhart, Weekley, & Barughan, Reference Ployhart, Weekley and Barughan2006).
Implicit in this research is the recognition that an organization is an integrated system and that individual and organizational characteristics interact and combine to shape outcomes (Kozlowski & Klein, Reference Kozlowski and Klein2000). Therefore, in addition to the individual factors that are important correlates of job satisfaction in the literature, we identify the organizational features that are expected to have a direct effect on job satisfaction. Consistent with this hierarchical level perspective is our expectation that individual outcomes combine to form a collective phenomenon at the organizational level.
Data arrangement
At least three approaches can be used to estimate the relative homogeneity of organizations: weighting, disaggregation, and aggregation. When researchers deal with multilevel variables (e.g., a lower-level outcome and both lower-and higher-level predictors), they are given at least three options for data analysis. Each way could have a very different effect on the results of the investigation.
The first option is that researchers sometimes apply sample weights and other corrections to account for oversampling of some individuals in the study (Heck & Thomas, Reference Heck and Thomas2009). Weighting is a way of adjusting a sample to allow for possible bias due to unit non-response. Weighting a sample should make it more representative of the population it is designed to represent so that reliable estimates can be made from the sample to the population. If the data are from a random sample, they usually come with sampling weights that reflect the sampling rate, clustering, or disproportionate sampling and that correct for differential non-response and loss to follow-up (Groves, Fowler, Couper, Lepkowski, Singer, & Tourangeau, Reference Groves, Fowler, Couper, Lepkowski, Singer and Tourangeau2009). To achieve this, we assign each case a specific weight. This weighting is achieved by dividing the population percentage for a category by the sample percentage (de Vaus, Reference de Vaus2004).
The second option is that the research can disaggregate data such that each lower-level unit is assigned a score representing the higher-level unit within which it is nested (Hofmann & Gavin, Reference Hofmann and Gavin1998). For example, in an analysis we may measure performance at the organizational level but also have items that express individual employee attitudes and motivation (Snijders & Bosker, Reference Snijders and Bosker1999). We use the original responses from the respondents without any data arrangement techniques. The emphasis is on statistical adjustments to yield unbiased estimates of variances and standard errors.
The third option is to aggregate lower-level units and to examine proposed relationships at the high level. Aggregation means that the outcome of individuals within the same organization is combining into an organizational level, for example, the mean scores of organizational citizenship factor perceived by the individuals within the same organization can be assigned to the same values. The other situation is that the same value is assigned to all organizational variables, and we attribute the properties of the organization to individuals. The researchers can avoid individual biases by aggregating data from individuals and subunits within each organization and then building a linear model that explores organizational differences in the aggregate measures (Heck & Thomas, Reference Heck and Thomas2009).
It is important to consider the potential consequences of decisions made in regard to where to place a variable in the data hierarchy and the impacts on the subsequent analysis. In this case, we intend to analyze the data at the individual level with different data arrangements to determine whether employee attitudes and behaviors influence job satisfaction.
Methodological choices
As mentioned above, OLS and multilevel model are preferred models for estimating their effects of individual and organizational level variables. First, OLS analysis is a conceptual method of investigating function relationships among variables. The assumptions of OLS analysis include assumptions about the form of the model (i.e., properties of least squares estimators are based on the linearity assumption), assumptions about errors (i.e., errors are assumed to be independently and identically distributed normal random variables each with mean zero and a common variance σ 2), assumptions about predictors (i.e., predictor variables are non-random, and their values are assumed to be fixed or selected in advance), and assumptions about observations (i.e., all observations are equally reliable and play an approximately equal role in determining the regression results and in influencing conclusions; Chatterjee & Hadi, Reference Chatterjee and Hadi2006).
The objective of research on multilevel effects is often to uncover how the contextual structure of an organization influences outcomes of individuals over and above the influence of individuals and family background. The hierarchical procedures can be specified and tested to answer questions, such as how the predictors of individuals and organizations influence individuals’ outcome. The results can include a null model – defined as containing only an outcome variable and no independent variables except as an intercept (Kreft & De Leeus, Reference Kreft and De Leeus1998), which is statistically equivalent to one-way random effects analysis of variance (ANOVA) – a random coefficient model (i.e., includes an outcome variable and independent variables at the individual level but no predictor at the organization level), or an intercept and slope as outcome model (i.e., a random coefficient model that includes an outcome variable and independent variables at the individual and organizational levels; Raudenbush & Bryk, Reference Raudenbush and Bryk2002).
Example: Job satisfaction of USA federal employees
In what follows, we develop the example of the antecedents and the consequences of US federal employees’ job satisfaction. Employing a sample data set with federal employees, this research conducts an OLS regression and multilevel regression on individual-level and organizational-level variables via different data arrangements that explain federal employees’ job satisfaction.
Sample and survey process
In September 2000, the NPR survey was conducted by the USA Office of Personnel Management (OPM) to help agencies focus on key issues in employee satisfaction and increase the efficiency and effectiveness of government service, thereby better serving customers. The survey was designed to assess employee opinions on workplace attitudes and the progress of reinvention within the federal workplace. The NPR survey was mailed to a stratified random sample of 50,844 federal civilian employees in the executive branch. Confidential responses were returned by mail to the address of a contractor. Dealing with missing values is not our research interest. In addition, if we impute missing data, other problems may influence our references. We therefore remove incomplete data using listwise deletion. As a result, the complete data set hinging on our estimated variables was only 26,218 usable responses.
A key factor in selecting the agencies to participate in the NPR survey is the extent to which their services affect the public. The performance of these ‘high-impact agencies’ is central to restoring Americans’ trust in government. The employees from 37 high-impact agencies were included in this research. Some items on the survey were taken from OPM's organizational assessment survey, as shown in Appendix 1. Therefore, the survey design appropriately accounts for multilevel variances (e.g., between and within individuals and organizations). The information of total population for each federal agency came from the Federal Employment Statistics of OPM websiteFootnote 1.
Measurement
This research includes the variables of job satisfaction, motivation, leadership, training, and individual collaboration. Because the survey is not designed for this research, only some survey items are selected in this research. Based on face validity, we chose some appropriate survey items and then used a panel of experts to review the survey item specification and the selection of items in which the content validity of the composite variables can be improved. Because the survey items and each composed measure have enough face and content validity, we summated the items’ scores into each measure. Appendix gives the conceptual definition and lists these items, consisting of each variable. Employees were asked to rate how accurately each item described them on a five-point Likert type scale (1 = ‘strongly disagree,’ to 5 = ‘strongly agree’); higher numbers indicated better scores.
Dependent variable
‘Job satisfaction’ for individual level is the dependent variable in this research. We do not employ any data arrangements in the following analysis for this variable. We use three survey items to measure this variable as listed Appendix.
Independent variables
Individual-level variables included the independent variables of leadership, training, and individual collaboration, as listed in Appendix. We did not aggregate the survey items related to individual-level independent variables. However, we weighted the ratio of the samples to the populations of their agency into weighted data for individual survey items made up of these independent variables. In addition, organization-level variables included the independent variables that assessed organization performance, organization innovation, organization collaboration, and organization customer services as formative indicators from part of the NPR survey items. These variables took the ‘organization’ as their unit of analysis, as reported in Appendix. Such variables reflect events that all employees in the organization experienced (Kozlowski & Klein, Reference Kozlowski and Klein2000). The organization-level variables are arranged by weighted data, disaggregated data, and aggregated data.
This research uses the weights to inflate the estimates back to the population level, estimating the total number of each agency in the US federal government based on the number in the study sample. Furthermore, we average the individual responses from the same agency to get a shared perspective, creating organization-level predictors for this research. Capitalizing on the aggregation process might create organizational influence and remove some potential bias from the same source.
Analytical methods
We first assessed internal consistency, discriminant validity, and central tendency for each measure. Then we checked the viability of the organization-level constructs by examining the within-group agreement, e.g., intraclass correlation (ICC1), and reliability of the mean (ICC2), using two-way random average measures reported by SPSS 18.0 reliability analysis. If there was little or no variability among individuals within each organization, any individual standing on the variable being measured could be aggregated to describe the organization's score (Heck & Thomas, Reference Heck and Thomas2009).
For the purposes of comparison, we estimated the OLS and then the multilevel models in which data arrangements were weighted, disaggregated, or aggregated. For multilevel analysis, this research used a scaling meditational strategy to simulate the influence of individual-level and organizational-level variables on job satisfaction as mediated by individual perceptions by comparing alternations and potential trade-offs among weight, disaggregation (e.g., original responses) and aggregation (e.g., creating organization-level mean). The analytical hierarchical process technique in the multilevel model was used for prioritizing the variables at different levels and then modeling by Stata 11.0 statistical software (Raudenbush & Bryk, Reference Raudenbush and Bryk2002). The same data arrangements occur in the OLS analytical method.
We tested for heteroskedasticity using the Breusch–Pagan test, which resulted in a small enough p-value for some corrective measure to be taken (Wooldridge, Reference Wooldridge2006). The variance-inflating factor (VIF) was used to test the presence of multicollinearity that may incur large variances and covariances, incorrect coefficient, t-ratio, R 2, and goodness of fit as well as inefficient standard errors (Gujarati, Reference Gujarati2003). The most common methods of model selection include hypothesis testing and ‘information criteria’, or index comparison. Using Akaike information criterion (AIC) and Bayesian information criterion (BIC) values, we measure the relative goodness of fit of a statistical model that provide a means for model selection. We favored the model with AIC and BIC smaller values.
Findings
Measurement reliability and validity
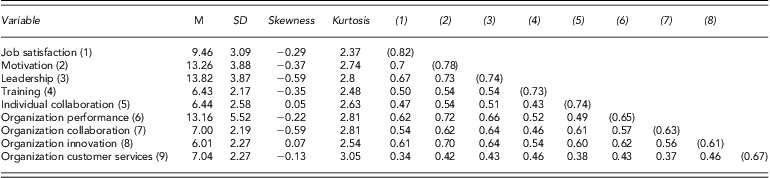
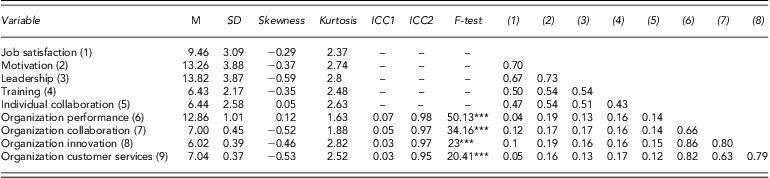
We combined the items into individual composite factors that had generally acceptable internal consistency reliabilities, as reported Table 1. The descriptive statistics showed no potential evidence violating the assumption of the normal distribution in disaggregated or aggregated data, as reported in Tables 1 and 2. However, abnormally skewed and peaked distributions may be signs of trouble in weighted data shown in Table 3 and such problems may then arise in applying multivariate statistics. Convincing evidence indicates that high discriminant validity exists between each measure in disaggregated and aggregated data (e.g., γ < 0.85). However, the correlation results in Table 1 (weighted data) do not provide discriminant validity evidence for each measure (e.g., γ > 0.85). There were no significant or differentiated correlations among measures, but these yielded a collinear construct as measured by the same sources.
Table 1. Mean, standard deviations, skewness, kurtosis and correlations of employee level variables-disaggregated data

(), Parenthesis is Cronbach's α.
Table 2. Mean, standard deviations, skewness, kurtosis, intraclass correlation and intermember reliability of aggregated organization-level variables
ICC1, intraclass correlation coefficient, ICC2, intermember reliability, ***p < 0.001.
Table 3. Mean, standard deviations, skewness, kurtosis and correlations table of employee level variables-weighted data
Aggregation tests
As reported in Table 2, in which estimates of the ICC1 and intermember reliability (ICC2) separately appear, significant variability average scores differed significantly across organizations (indicated by an F-test from an ANOVA, contrasting organization means on each variable). Previous research has reported ICC values equal to or greater than 0.05 as supporting consensus (Heck & Thomas, Reference Heck and Thomas2009).
For organizational performance, we obtained good support for aggregation – (ICC1_0.07; ICC2_0.98), F(36, 26,462) = 50.13, p < 0.001 – which was expected because organizational performance was measured by overall agency impact rather than by individual employee. The ICCs for organizational collaboration also sustain a good level of aggregation – (ICC1 = 0.05, ICC2 = 0.96), F(36, 26,998) = 34.16, p < 0.001 – which is indicative of substantial within-organization (i.e., individual-level) variability, relative to between-organization variability, in organizational collaboration. We thus concluded that aggregation was justified for this variable. The aggregation statistics obtained were also lower for innovation relative to organizational level – (ICC1 = 0.03, ICC2 = 0.97), F(36, 26,932) = 23, p < 0.001 – as well as for organization customer services – (ICC1 = 0.03, ICC2 = 0.95), F(36, 26,898) = 20.41, p < 0.001. Although organizational innovation and customer services did not support the aggregation at the organizational level, we still examined these two variables among federal employees to help answer our research questions.
Regression diagnosis and model fit
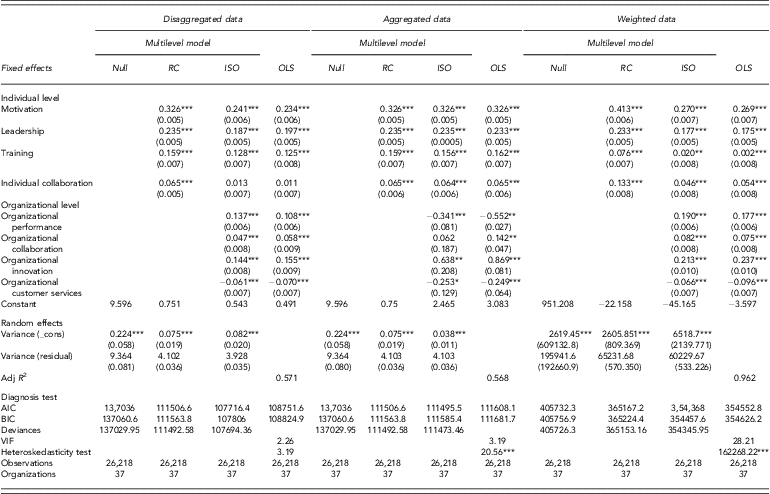
The following section will be unfolded with disaggregated data, aggregated data, and weighted data separately estimated by the OLS model and the multilevel model. We will then compare the regression diagnosis and model fit criteria employed to determine the adequacy of the model. Before running the procedures of the multilevel models, the null models for each data formation indicated the organizational level exists significant variances as shown in Table 4, justifying we run the multilevel models to estimate within-organization and between-organization variances. Then we compare the efficiency of three nested multilevel models (i.e., null model, random coefficient model, intercept and slope model), AIC, BIC, and deviances, which inform that intercept and slope model is better than other two, as shown in Table 4. Thus, the following discussions will focus on the intercept and slope model in different data arrangements.
Table 4. The comparison between disaggregated, aggregated, and weighted data comparing multilevel model and OLS
Null, null model; RC, random coefficient model; ISO, intercept and slope as outcome model; ***p < 0.001, **p < 0.01, *p < 0.05.
Disaggregated data
For the disaggregation data models shown in Table 4, the VIF test indicate that no serious multicollinearity problem exists in disaggregation data in the OLS model (i.e., VIF = 2.26 < 10), which indicates no bias in this model. In addition, the Breusch–Pagan/Cook–Weisberg test for heteroskedasticity indicated no heteroskedasticity problem, implying that the OLS had efficient standard errors (i.e., χ 2(1) = 3.19 p > 0.05).
Using AIC and BIC, the differences between the OLS model and the multilevel model are obviously greater than 10. The difference in AIC and BIC provides very strong evidence for favoring the multilevel model over the OLS model. We therefore conclude that the multilevel model provided a better fit to the data than the OLS model in the disaggregated data arrangement.
Aggregated data
For the aggregation data models shown in Table 4, the VIF test indicated no serious multicollinearity problem estimated in aggregation data with OLS model (i.e., VIF = 3.19 < 10). However, according to the Breusch–Pagan/Cook–Weisberg test for heteroskedasticity, heteroskedasticity problems exist, indicating that the standard errors in the OLS model were underestimated (i.e., χ 2(1) = 20.56 p < 0.001). In terms of model fit, the information criteria of AIC and BIC also revealed that the multilevel model provides a better fit than the OLS model. We compared the differences of the multilevel models between the disaggregation data and the aggregation data. AIC and BIC values are significantly smaller in the disaggregation data than in the aggregation data (i.e., AICdiff > 10, BICdiff > 10). We concluded that the multilevel model with the disaggregation data provides a consistently better fit than the model with the aggregation data. When results and reality diverge, the researcher must make a difficult choice between model parsimony and model complexity. In this situation, researchers must use their substantive knowledge and judgment to reach a conclusion about the ‘best model’ (McCoach & Black, Reference McCoach and Black2008).
Weighted data
For the weighted data models (Table 4), the VIF test showed a serious multicollinearity problem in weighted data with the OLS model (i.e., VIF = 28.21 > 10), which indicates a bias in this model. However, the Breusch–Pagan/Cook–Weisberg test for heteroskedasticity identified a heteroskedasticity problem, implying that the OLS had inefficient standard errors (i.e., χ 2(1) = 162268.22 p < 0.001). Using AIC and BIC, the differences between the OLS model and the multilevel model are obviously greater than 10. According to Raftery's (Reference Raftery1995) rule of thumb, the difference in AIC and BIC provides very strong evidence in favor of the multilevel model over the OLS model. Thus, we concluded that the multilevel model provided a better fit to the data than the OLS model for the weighted data.
Regression coefficient
The standard errors for the organizational variables in disaggregated data are all smaller than those for the corresponding variables in aggregated data resulting from the OLS analysis and multilevel analysis. The smaller standard errors associated with the disaggregated analysis can affect the corresponding hypothesis tests regarding individual parameters. For example, the unstandardized β for individual collaboration on job satisfaction in disaggregated data is 0.011 while the standard error is 0.007. The resulting t-ratio (0.011/0.007) is 1.571, which is insignificant at p > 0.05. However, the corresponding variables in weighted data and aggregated data have significant impacts on job satisfaction.
The unstandardized β for organizational collaboration in aggregated data with the multilevel model is 0.062 while the standard error is 0.187. The resulting t-ratio (0.062/0.187) is 0.333, which is insignificant at p > 0.05. The resulting estimate for organization performance between the disaggregated, aggregated, and weighted data presents the reverse direction [i.e., 0.137, 0.108 (disaggregated data); −0.341, 0.552 (disaggregated data); 0.190, 0.177 (weighted data)]. Thus, the effects of aggregation can considerably change the significant direction associated with a hypothesis test.
Discussion
The results suggested that acknowledging the existence of an ICC is important because it changes the error variance in single-level regression analyses. Where clusters and nontrivial ICCs are present, the OLS assumption of independent errors is likely violated, resulting in downward bias in estimated standard errors. Single-level analyses such as OLS ignore the structure of the data and therefore cannot correct for similarities among individuals within an organization (Heck & Thomas, Reference Heck and Thomas2009). Ignoring the clustered structure inherent within the data offers no distinction for between- and within-group variance. Thus, when clustering is ignored, the variances of estimates derived from that sample tend to be much smaller than what would realistically be expected if the clustered structure of the data had been incorporated into the calculation. The amount of variance inflation is directly related to the ICC: as ICC increases, VIF increases. Therefore, treating cluster-sampled data as if they had been obtained from random sampling will result in variance estimates (and standard errors) that are too low (Snijders & Bosker, Reference Snijders and Bosker1999).
As indicated in Table 4, the significant variance in federal employees’ job satisfaction both within and between individual employees (leadership, motivation, training, and individual collaboration) and organizations (organizational collaboration, organizational innovation, organizational performance, and organizational customer services) specified in this study explained a moderate amount of this variance. However, significant differences emerged regarding whether or not to adopt aggregation. Interestingly, when the results of the ICCs indicated that disaggregation is not a better choice, the results exerted a pronounced change (i.e., direction, significance) on organizational collaboration and organizational performance between disaggregation and aggregation data arrangement.
According to Table 4, the standard error of the individual- and organization-level variables did not change much between the OLS and the multilevel model with the same data arrangement. Nor did the strength and the direction of the coefficients for individual- and organization-level variables significantly increase or decrease. However, the disaggregated OLS regression model produced several analytical difficulties. The researcher would have to conduct the analysis on the total number of individuals in the sample without regard for the higher-level organizational structure. The OLS does not address possible clustering effects among individuals in the sample (e.g., resulting from individuals being nested within similar agency; Heck & Thomas, Reference Heck and Thomas2009). This method violates the required assumption of independence of errors among individuals in the sample.
Disaggregated analyses also faced the problem of whether organizational factors should be defined as an aggregated or a disaggregated measure. If we define organization on the individual level, we miss the likelihood that there is also considerable agreement among members in each organization about its normative structure. In other words, disaggregated analyses require the researcher to assume incorrectly that individuals within similar organizations share no characteristics or perceptions. This assumption leads to the possibility of biased regression coefficients and their associated standard errors. For example, if organizational features (e.g., size) are considered, too many independent degrees of freedom are utilized in the model. The degrees of freedom for organizational size would correspond to the number of individuals rather than the number of organizations. Because hypothesis tests for parameters depend on the ratio of the parameter to its standard error, organizational features will be tested on the number of individuals in the study instead of the number of organizations (Heck & Thomas, Reference Heck and Thomas2009).
If there were significant variations to be explained at the organizational level, and these variations were not incorporated into the analysis, the standard errors for individual parameters in the model would be underestimated. An underestimated error can increase the probability of making Type I errors (i.e., a false rejection of the null hypothesis; Heck & Thomas, Reference Heck and Thomas2009). Thus, it is important to recognize that, if the researcher uses an individual-level analysis, it implies that no systematic influence of higher-level variables is expected and, therefore, all organizational influence is incorporated into the error term of the model (Kreft & De Leeus, Reference Kreft and De Leeus1998). In addition to violating this assumption, the assignment of organization-level variables down to the individual-level results in statistical tests that are based on the number of individuals instead of the number of organizations. Thus, the standard errors associated with the tests of the organization-level variables may be underestimated (Hofmann & Gavin, Reference Hofmann and Gavin1998).
Table 4 shows no significant change in the OLS and multilevel models in terms of individual-level variables using aggregated data. Although the standard errors for the OLS model are smaller than those for the multilevel model, there are potential underestimated standard errors in results from the heteroskedasticity test. In addition to the information of model fit, the multilevel model is obviously a better choice that the OLS model in this case. The OLS estimated with the aggregation data ignores the hierarchical structure of the data by using the means of all employees within an organization.
When aggregating the construct using an organization-level mean variable, we fail to acknowledge that the within-organization variability present in the data can potentially distort relationships among such individuals (Draper, Reference Draper1995; Heck & Thomas, Reference Heck and Thomas2009). In theoretical validity, we may miss the likelihood that considerable variation exists within organizations regarding how their members perceive important beliefs, values, traditions, and norms (Heck & Thomas, Reference Heck and Thomas2009). A danger exists for an aggregation or ecological fallacy (Robinson, Reference Robinson1950) in which a relationship found at the organizational level may not exist among the individuals (employees in this case) from which the data have been aggregated. For example, the average organization performance for a federal agency may be no different from the whole federal agency average. However, this may disguise the possibility that organizational performance depends on where employees work within this agency. In addition, the failure to account for aggregating results in the underestimation of standard errors undermines significance tests (Haucka & Street, Reference Haucka and Street2006). In short, when considering variance from data obtained through grouped or clustered designs, the hierarchical sources of variability cannot be ignored without seriously contributing to errors of inference, compromising the validity of results and research conclusions.
As discussed herein, by considering the relationships among variables at different levels of analysis, we can improve our understanding of organizational behaviors and avoid misspecifications and other forms of aggregation biases (Meade & Eby, Reference Meade and Eby2007). Multilevel modeling allows the researcher to avoid aggregation (assigning the same organizational mean to each member) or disaggregation (treating subjects without reference to their organizations) problems. In multilevel formulations, we have the option of defining the organization as a within-unit construct (i.e., as an individual perception), a between-unit construct (i.e., an aggregate property of organizations), or as an individual and group construct simultaneously.
Conclusion
This study sought to compare the strengths and weakness of different data arrangements in which employee job satisfaction was examined as a joint function of individual characteristics and organizational characteristics. Although there are numerous ways to adjust the single-level analysis for multilevel effects, these statistical techniques do not allow the researcher to specify presumed effects at different levels of data hierarchy. As a result, if the importance of the organization effect is overlooked, we may also render invalid solutions. In order to better understand the implications of multilevel governance for this study, we suggest that researchers interested in individual and organizational levels need to use the intraclass group variance analysis. This will direct the researchers to decide between traditional OLS analysis and multilevel analysis, even if disaggregation may yield positive evidence in the research.
Taken together, this research bridges the gap between the individual and organizational approach. In theory, we provide empirical evidence for the viability of a contextual interaction between individuals and organizations. Although our findings did not offer a more detailed account of the multilevel mechanisms by which job behaviors affect individual job satisfaction, this research indeed accounts for between- and within-organizational variance, hinging on the research concerns. In addition, our findings should encourage future researchers to include both individual- and organization-level constructs in their models to construct more complete and accurate pictures of individual and organizational behaviors. Furthermore, researchers tend to prefer a multilevel approach, which allows them to investigate the impact of predictors at different levels on the outcome while maintaining the appropriate level of analysis for these predictors based on sample representation and organization characteristics. The current research confirms that, by considering the relationships among variables at varying levels of multilevel analysis, we can arrive at an enhanced understanding of organizational behaviors while avoiding misspecifications and other forms of weighting, disaggregation, and aggregation biases.
Limitations and research directions
This study has several limitations, which highlight important avenues for future research. The job satisfaction variable shows significant relationships with most of the theoretically related variables, including variables obtained from self-reports’ common source. This bias may produce more opportunity for measurement errors. We cannot rule out its potential effect; however, the due sampling process diminished this possibility (e.g., the employees surveyed confidentially). Some quantitative studies of individuals within organizations have appeared as such designs make heavy demands of one data set. Future research would be strengthened by relying on different sources to measure these constructs at different levels. The cross-sectional nature of this study precludes us from making causal inferences. Future research would clearly strengthen the inferences drawn from the longitudinal study through which emergence occurs.
Another limitation of the current study concerns potential generalizability. While restricting our sample to a single group from the same federal level ruled out superfluous factors associated with different backgrounds and organizations from the employees of other sectors and other countries, the generalizability of our results to situation might be limited. However, the results were largely consistent with our research concerns, suggesting that this research usually provides solutions to the problems in the previous research, of which replication and extension of the multilevel investigation are warranted. Such research is necessary for researchers to identify and test causal relationships. This research is important for simulating different approaches of data arrangements with analytical methods that direct future research and truly advance our knowledge. This research recognizes that the multilevel structure allows the analysts to test for interactions between individual- and characteristics of higher-level units. However, future research really needs to be a theoretical model to identify suitable interactions to be examined.
Appendix
Conceptual definition, operational definition for each variable