


Introduction
The Paleoindian period of North America is known for bifacial, lanceolate points, and for many of these point forms, flutes are considered key diagnostic characteristics. Clovis points are the earliest, best-documented fluted-point technology. At sites across North America dated approximately 13,050–12,750 cal yr BP (Waters et al. Reference Waters, Stafford and Carlson2020), Clovis hunter-gatherers left behind lanceolate points with flutes—shallow flake scars that originate at the base and travel parallel to the long axis toward the tip. Current evidence suggests that this technique (following Callahan Reference Callahan1979) was a technological innovation that emerged in North America south of the continental ice sheets (Smith and Goebel Reference Smith and Goebel2018). Once adopted, fluted points of various forms—for example, Folsom, Barnes, Cumberland—remained diagnostic components of Paleoindian tool kits for centuries (Frison Reference Frison, Soffer and Praslov1993; Morrow and Morrow Reference Morrow and Morrow1999; Smith and Goebel Reference Smith and Goebel2018). In the Eastern Woodlands, fluting persisted into the Late Paleoindian period with Dalton point technology—recovered from contexts dating to 12,475–11,275 cal yr BP (Anderson et al. Reference Anderson, Smallwood and Miller2015; Thulman Reference Thulman2019). Many studies have addressed questions of how and why Paleoindian populations made fluted points (e.g., Bradley et al. Reference Bradley, Collins and Hemmings2010; Jodry Reference Jodry1999; Sellet Reference Sellet2004; Smallwood Reference Smallwood2010; Tune Reference Tune2015; Waters et al. Reference Waters, Pevny, Carlson, Dickens, Smallwood, Minchak and Bartelink2011). However, few have addressed why fluting was abandoned as a key morphological trait of finished points. The goal here is to study variation in the fluting of Paleoindian points to explore the changing role of this technique.
Describing and Explaining Fluting
Many researchers recognize that the shared characteristic of fluting across North America, in addition to other attributes, is evidence of an evolutionary or cultural relatedness between Paleoindian populations (e.g., Frison Reference Frison, Soffer and Praslov1993; O'Brien et al. Reference O'Brien, Boulanger, Buchanan, Collard, Lee Lyman and Darwent2014; Smallwood et al. Reference Smallwood, Jennings, Pevny and Anderson2019; Smith and Goebel Reference Smith and Goebel2018). Yet, the process of channel flake removal and the role of fluting in Paleoindian technologies varied geographically and through time (Smith and Goebel Reference Smith and Goebel2018). Multiple hypotheses have been proposed to explain fluting, largely focusing on Clovis and Folsom point technologies. Fluting results in high breakage rates during point production (Sellet Reference Sellet2004; but see Ellis and Payne Reference Ellis and Payne1995). Why attempt these risky removals? For Clovis, some researchers emphasize the high skill level required for fluting and the symbolic aspect of Clovis point manufacture as a basis for suggesting that fluting was a part of ritual behavior (Bradley and Collins Reference Bradley, Collins, Graf, Ketron and Waters2013:254; for Folsom symbolic fluting, see MacDonald Reference MacDonald2010; as a form of play, see Pelton et al. Reference Pelton, Boyd, Rockwell and Newton2016). Utilitarian explanations focus on the flute's role in thinning the point, securing it to the haft (Cook Reference Cook1928:40; Frison Reference Frison, Soffer and Praslov1993:241), and protecting it from bending breaks (Titmus and Woods Reference Titmus and Woods1991). Some suggest that flutes may have increased animal bloodletting after penetration (Cook Reference Cook1928:40). Recent experimental studies have tested durability hypotheses (for review, see Jennings et al. Reference Jennings, Smallwood and Pevny2021). Snyder (Reference Snyder2017) shows that partially fluted Clovis points are more durable than fully fluted Folsom and unfluted Midland points, although more work is needed to determine the role of other factors such as point size and shape differences. Others show that flute design offered shock-absorbing properties that channeled impact forces and improved Clovis point resilience (Story et al. Reference Story, Eren, Thomas, Buchanan and Meltzer2019; Thomas et al. Reference Thomas, Story, Eren, Buchanan, Andrews, O'Brien and Meltzer2017). Hypotheses for fluting in Folsom often highlight the utilitarian role of the prominent flutes that extend nearly up to the tip. Early accounts suggest that flutes made points fragile but likely helped secure the point to the haft (Robert Reference Roberts1935:18). More recent hypotheses suggest that the design actually minimized the risk of breakage for Folsom hunter-gatherers conserving stone (Ahler and Geib Reference Ahler and Geib2000:817). Fully fluted Folsom points could have been deeply hafted with shafts protecting much of the point against bending fractures (Bement Reference Bement, Clark and Collins2002), leaving a penetrating tip and sharp blade margins exposed. Isometric analysis suggests that Folsom points were fixed in the haft during resharpening episodes (Buchanan Reference Buchanan2006:196). Hunzicker (Reference Hunzicker2008) shows that full fluting concentrates damage at the tip, allowing for multiple-use resharpening events, and Snyder (Reference Snyder2017) suggests that the transition to full fluting aided in point recovery at the expense of some degree of point durability.
Although more attention has been given to explaining why Paleoindians fluted points, some have considered why fluting was abandoned. Newby and colleagues (Reference Newby, Bradley, Spiess, Shuman and Leduc2005; also see Williams and Niquette Reference Williams and Niquette2019) link point chronologies to environmental changes, suggesting that fluting was tied to hunting large game at the end of the Pleistocene. However, Buchanan and colleagues (Reference Buchanan, Collard, Hamilton and O'Brien2011) have since questioned the proposed link between point form and prey size. If fluting in Clovis was used to increase point durability, Thomas et alia (Reference Thomas, Story, Eren, Buchanan, Andrews, O'Brien and Meltzer2017) propose that later unfluted points may reflect the opposite strategy of increasing point breakage on impact to cause more target damage. Alternatively, MacDonald (Reference MacDonald2010), who envisions fluting in Folsom as an example of prestige or success bias (cf. Lycett Reference Lycett2015), proposes that fluting ended due to a shift in perception to viewing fluting as costly. Finally, Eren and colleagues (Reference Eren, Bebber, Knell, Story and Buchanan2022) propose that fluting ended due to knowledge loss as populations became disconnected from one another during regionalization.
Fluting in Clovis and Dalton
To explore fluting variation and consider how the role of fluting changed over time, we compare assemblages of Clovis and Dalton points—point forms representing the emergence and spread of fluting and the eventual decline of the production technique in eastern North America. Clovis sites are identified by a suite of diagnostic technological characteristics (Bradley et al. Reference Bradley, Collins and Hemmings2010; Eren and Buchanan Reference Eren and Buchanan2016; Eren et al. Reference Eren, Patten, O'Brien and Meltzer2013; Jennings and Smallwood Reference Jennings and Smallwood2019; Jennings and Waters Reference Jennings and Waters2014; Meltzer Reference Meltzer2009; Morrow et al. Reference Morrow, Fiedel, Johnson, Kornfeld, Rutledge and Raymond Wood2012; Smallwood Reference Smallwood2010, Reference Smallwood2012; Waters et al. Reference Waters, Pevny, Carlson, Dickens, Smallwood, Minchak and Bartelink2011; but for debate about Clovis diagnostics, see Eren et al. Reference Eren, Meltzer and Andrews2018, Reference Eren, Meltzer and Andrews2021; Huckell et al. Reference Huckell, Vance Haynes and Holliday2019). Clovis points are bifacial, lanceolate, and fluted—most commonly on both faces (Figure 1). Flutes run a third to halfway up the point from the basal edge (Wormington Reference Wormington1957). Clovis points were used predominantly as projectiles, but some were also used as knives (Kay Reference Kay and Odell1996; Mackie et al. Reference Mackie, Surovell, O'Brien, Kelly, Pelton, Vance Haynes and Frison2020; Miller Reference Miller2013; Shoberg Reference Shoberg, Bradley, Collins and Hemmings2010; Smallwood Reference Smallwood2015).
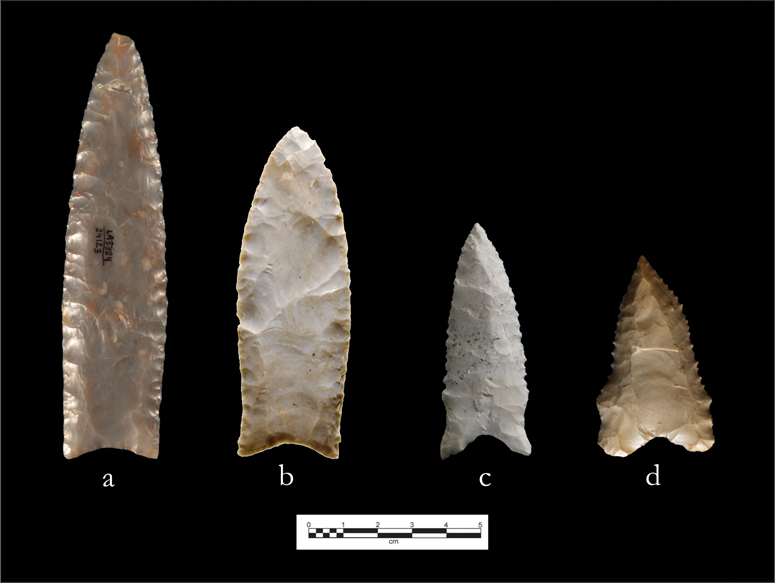
Figure 1. Examples of Clovis and Dalton points analyzed in this study: (a) Clovis point from Blackwater Draw Locality 1, NM; (b) Clovis point from Hogeye, TX; (c) Dalton point from 11MS128 B, IL; (d) Dalton point from 15HK7/49, KY. (Point photos courtesy of Heather L. Smith, Michael Waters, and Ashley Smallwood. Image by Ashley M. Smallwood.) (Color online)
Dalton is best known from the archaeological record in the Central Mississippi Valley “Heartland” (Gillam Reference Gillam1996; Koldehoff and Loebel Reference Koldehoff, Loebel, Adams and Blades2009; Koldehoff and Walthall Reference Koldehoff, Walthall, Emerson, McElrath and Fortier2009:138), but Dalton and Dalton-related points occur from the Atlantic Coast, south along the Gulf Coastal Plain, and west into the Plains (Anderson et al. Reference Anderson, Smallwood and Miller2015; Bousman et al. Reference Bousman, Baker, Kerr and Perttula2004; Daniel Reference Daniel1998; Jennings Reference Jennings2008; O'Brien and Wood Reference O'Brien and Wood1998). Points possessing “classic” Dalton morphological traits (Figure 1) are lanceolates with concave bases that often have longitudinal flake scars originating at the base, serrations along the lateral blade margins, and steeply alternately beveled blade edge angles (Bradley Reference Bradley and Morse1997; Morse Reference Morse1971:13). Dalton points were multifunctional throughout their use life, serving as both projectiles and knives, and many were even modified into drills/punches, scrapers, and burins (Goodyear Reference Goodyear1974; Shott and Ballenger Reference Shott and Ballenger2007; Smallwood et al. Reference Smallwood, Pevny, Jennings and Morrow2020; Yerkes and Gaertner Reference Yerkes, Gaertner and Morse1997). Records indicate that Dalton hunter-gatherers were settling in, relying more heavily on local resources—in some cases, lower-quality stone sources, which include smaller, more variable package sizes such as cobbles (Jennings Reference Jennings, Hurst and Hofman2010) that present unique knapping challenges (Morgan et al. Reference Morgan, Eren, Khreisheh, Hill, Bradley, Smallwood and Jennings2015), and materials such as quartzites that require more force to flake (Key et al. Reference Key, Proffitt and de la Torre2020).
Despite the apparent centuries of chronological separation, it has been suggested that Clovis and Dalton cultural complexes share morphological and technological affinities and are therefore culturally related. For Bradley (Reference Bradley and Morse1997:57), there is evidence for “in situ technological development of Dalton points directly out of a Clovis technology.” Smallwood and colleagues (Reference Smallwood, Jennings, Pevny and Anderson2019) showed that southeastern Paleoindian point technologies exhibit a pattern of mosaic evolutionary change. Point blades and bases changed at different rates in different regions. When compared to other Paleoindian point types, Clovis and Dalton share greater evolutionary closeness (Smallwood et al. Reference Smallwood, Jennings, Pevny and Anderson2019:8).
However, key differences in Clovis and Dalton biface technology have been described. In production, Clovis flintknappers detached blade-like flakes from the ends of a biface that traveled through the central portion of the biface, parallel to the long axis—a technique often referred to as “endthinning” (Bradley et al. Reference Bradley, Collins and Hemmings2010; Morrow Reference Morrow1995; Smallwood Reference Smallwood2012; Waters et al. Reference Waters, Pevny, Carlson, Dickens, Smallwood, Minchak and Bartelink2011). This technique helped to longitudinally thin the biface throughout the process of production. When longitudinal flakes were removed as one of the final steps of point production, the scars are called flutes (Bradley et al. Reference Bradley, Collins and Hemmings2010; Waters et al. Reference Waters, Pevny, Carlson, Dickens, Smallwood, Minchak and Bartelink2011). Clovis flutes were removed via percussion flaking of beveled basal platforms (Bradley et al. Reference Bradley, Collins and Hemmings2010; Morrow Reference Morrow1995; Waters et al. Reference Waters, Pevny, Carlson, Dickens, Smallwood, Minchak and Bartelink2011). Some Clovis point bases were also shaped around the thinning removals of earlier reduction stages; fluting was not always one of the final steps in point production (Bradley et al. Reference Bradley, Collins and Hemmings2010:65; Waters and Jennings Reference Waters and Jennings2015).
Longitudinal flaking was also used to produce Dalton points. Bradley (Reference Bradley and Morse1997) identified key differences between Dalton and Clovis point-thinning techniques and describes two forms of fluting: (1) technological fluting, the removal of one or more flakes to proportionally thin the biface, although these thinning scars may not be retained on finished points; and (2) morphological fluting, the removal of basal flake scars that extend beyond the haft and are present on the finished point (Bradley Reference Bradley and Morse1997:54). In Clovis, technological and morphological fluting are common, and morphological flutes are considered a diagnostic trait of finished Clovis points (Bradley Reference Bradley and Morse1997:57). For Dalton, points were commonly technologically fluted; morphological fluting occurs less frequently, and some flutes extend beyond the base into the blade (Goodyear Reference Goodyear1974:24; Ray Reference Ray2016:136). For O'Brien and colleagues (Reference O'Brien, Boulanger, Buchanan, Collard, Lee Lyman and Darwent2014:106; see also O'Brien Reference O'Brien2005; O'Brien and Lyman Reference O'Brien and Lyman2000), fluted Dalton points are “an obvious potential phylogenetic link between Clovis and Dalton.” In contrast to Clovis beveled platform fluting, Dalton points have deeper, narrower concavities, suggesting that points were fluted by pressure flaking (Goodyear Reference Goodyear1974:24). Consequently, fluting varied between Clovis and Dalton, and although fluting was still practiced in the Dalton period, retaining the flute on the point face may have been increasingly less prevalent.
In this article, we compare morphological and technological aspects of Clovis and Dalton points, and we consider how the use of this production technique varied through time—from the emergence of fluting in Clovis to one example of its decline in Dalton.
Materials
We analyzed 63 Paleoindian points (Figure 1, Table 1). Nine Clovis points were recovered at Blackwater Draw Locality 1, the Clovis type site, located on the edge of the Southern High Plains near Clovis, New Mexico (Hester Reference Hester1972). The variety of toolstone in the Clovis point assemblage and multiple discrete kill episodes suggests that the site was revisited multiple times by Clovis groups (Hester Reference Hester1972). The points analyzed here are from the collection curated at Eastern New Mexico University (Smith and Asher Reference Smith and Asher2019). Twelve Clovis points are from a cache recovered from the Hogeye site, Texas. Hogeye lies east of Edwards chert outcrops, and the Clovis artifacts are suggested to have been cached for insurance to support hunting away from stone source areas (Jennings Reference Jennings2013; Waters and Jennings Reference Waters and Jennings2015). All 52 bifaces are considered late-stage preforms, and these were further categorized into three substages. The 12 points used in this study are all classified as Stage C preforms. Although these points are not completely finished and/or used points, Waters and Jennings (Reference Waters and Jennings2015:38) note that the “only steps remaining before stage C preforms could be used as projectile points is final edge retouch to sharpen the blade, shaping the tip to a point, and grinding the basal edges.” Consequently, the bases—including flute scars—are in their final form.
Table 1. State and County Location Information for Points in the Study Sample.
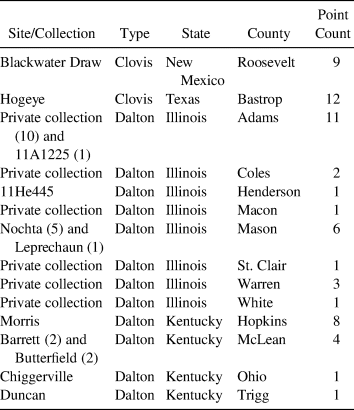
Note: For counties with points from multiple collections, collection counts are in parentheses.
Twenty-eight points of the Dalton sample were recovered at sites in Illinois, including the Nochta site—a multicomponent site located on a sandy ridge adjacent to the Mississippi River (Higgins et al. Reference Higgins, Fortier, Jackson, Parker and Simon1990). Nochta is interpreted as a residential base camp with evidence of “extended settlement” during the Dalton occupation (Higgins et al. Reference Higgins, Fortier, Jackson, Parker and Simon1990:55–56). We use five complete points from the Nochta site, which are available at the Illinois State Archaeological Survey. Fourteen Dalton points were recovered at sites in Kentucky, including eight Dalton points from the Morris site. Morris, repeatedly occupied by Dalton groups, is situated on a terrace above the swampy bottomlands of Sugar Creek in western Kentucky (Rollingson and Schwartz Reference Rollingson and Schwartz1966:64, 84; Tankersley Reference Tankersley and Lewis1996).
To ensure the point sample used here is representative of points from the region, we compare point lengths from the current study to point lengths recorded from across the Southeast by Smallwood et alia (Reference Smallwood, Jennings, Pevny and Anderson2019). Clovis point lengths in the current study do not significantly differ (Mann-Whitney U = 377.0, p = 0.122) from the Southeastern sample. Likewise, Dalton point lengths in the current study do not significantly differ (Mann-Whitney U = 482.5, p = 0.092) from the Southeastern sample. The Clovis and Dalton point samples used in this study are not size outliers.
Methods
Here, we use fluting to refer to Bradley's (Reference Bradley and Morse1997) technological and morphological fluting. We compare Clovis and Dalton point fluting using traditional linear and area measurements, and 2D and 3D geometric morphometrics (GM). The landmark-based method of GM comprehensively quantifies object geometry (Adams et al. Reference Adams, Rohlf and Slice2004; Bookstein Reference Bookstein1991; Rohlf and Marcus Reference Rohlf and Marcus1993), and it has become a useful tool for studying shape variation of 2D images of artifacts (Buchanan Reference Buchanan2006; Buchanan et al. Reference Buchanan, O'Brien and Collard2014; Lycett Reference Lycett2009; Lycett et al. Reference Lycett, von Cramon-Taubadel and Foley2006; MacLeod Reference MacLeod2018; Smith and Goebel Reference Smith and Goebel2018; Smith et al. Reference Smith, Smallwood, DeWitt, Smallwood and Jennings2015; Thulman Reference Thulman2012). More recently, archaeologists have explored using GM to analyze 3D models, which have proven useful for analyzing aspects of morphologies that are difficult to discern with 2D images and traditional measurements. Three-dimensional surface models can be used to explore variation in flake scar contours (Gingerich et al. Reference Gingerich, Sholts, Wärmländer and Stanford2014; Sholts et al. Reference Sholts, Stanford, Flores and Warmlander2012), 3D cloud data can help systematically capture measurements of cross-section areas of points (Davis et al. Reference Davis, Bean and Nyers2017), and 3D GM can help explore edge morphology and axial twisting related to beveling (Selden et al. Reference Selden, Dockall and Dubied2020). These studies highlight the potential for 3D digital models and 3D GM in systematically analyzing a wider array of point attributes in the study of shape variation.
Below, we describe a three-part analysis. First, we use 2D images to record traditional linear distance and area measurements, and we statistically compare differences in size and shape ratios. Second, using 3D models, we examine variation in shape within two datasets consisting of complete points and digitally sliced point bases with GM. Third, we use the sliced point base 3D models to analyze shape variation of 2D flute cross sections with GM.
Linear Distance and Area Measurements of 2D Images
We recorded traditional linear distance measurements and area on high-quality point images (i.e., image resolution ≥300 dpi) using ImageJ (Schneider et al. Reference Schneider, Rasband and Eliceiri2012). To quantify the contribution of fluting in point morphology and technology, 12 measurements were recorded (Figure 2; Supplemental Text 1). For this study, all removals that initiated at the base and between the point ears and that measured 0.5 cm or more were recorded to explore evidence of fluting (following Smallwood et al. Reference Smallwood, Jennings, Pevny and Anderson2019). Written descriptions of 2D measurements are provided in the Supplemental Text 1. Also see Supplemental Text 2 for additional references that influenced methodology and research design.
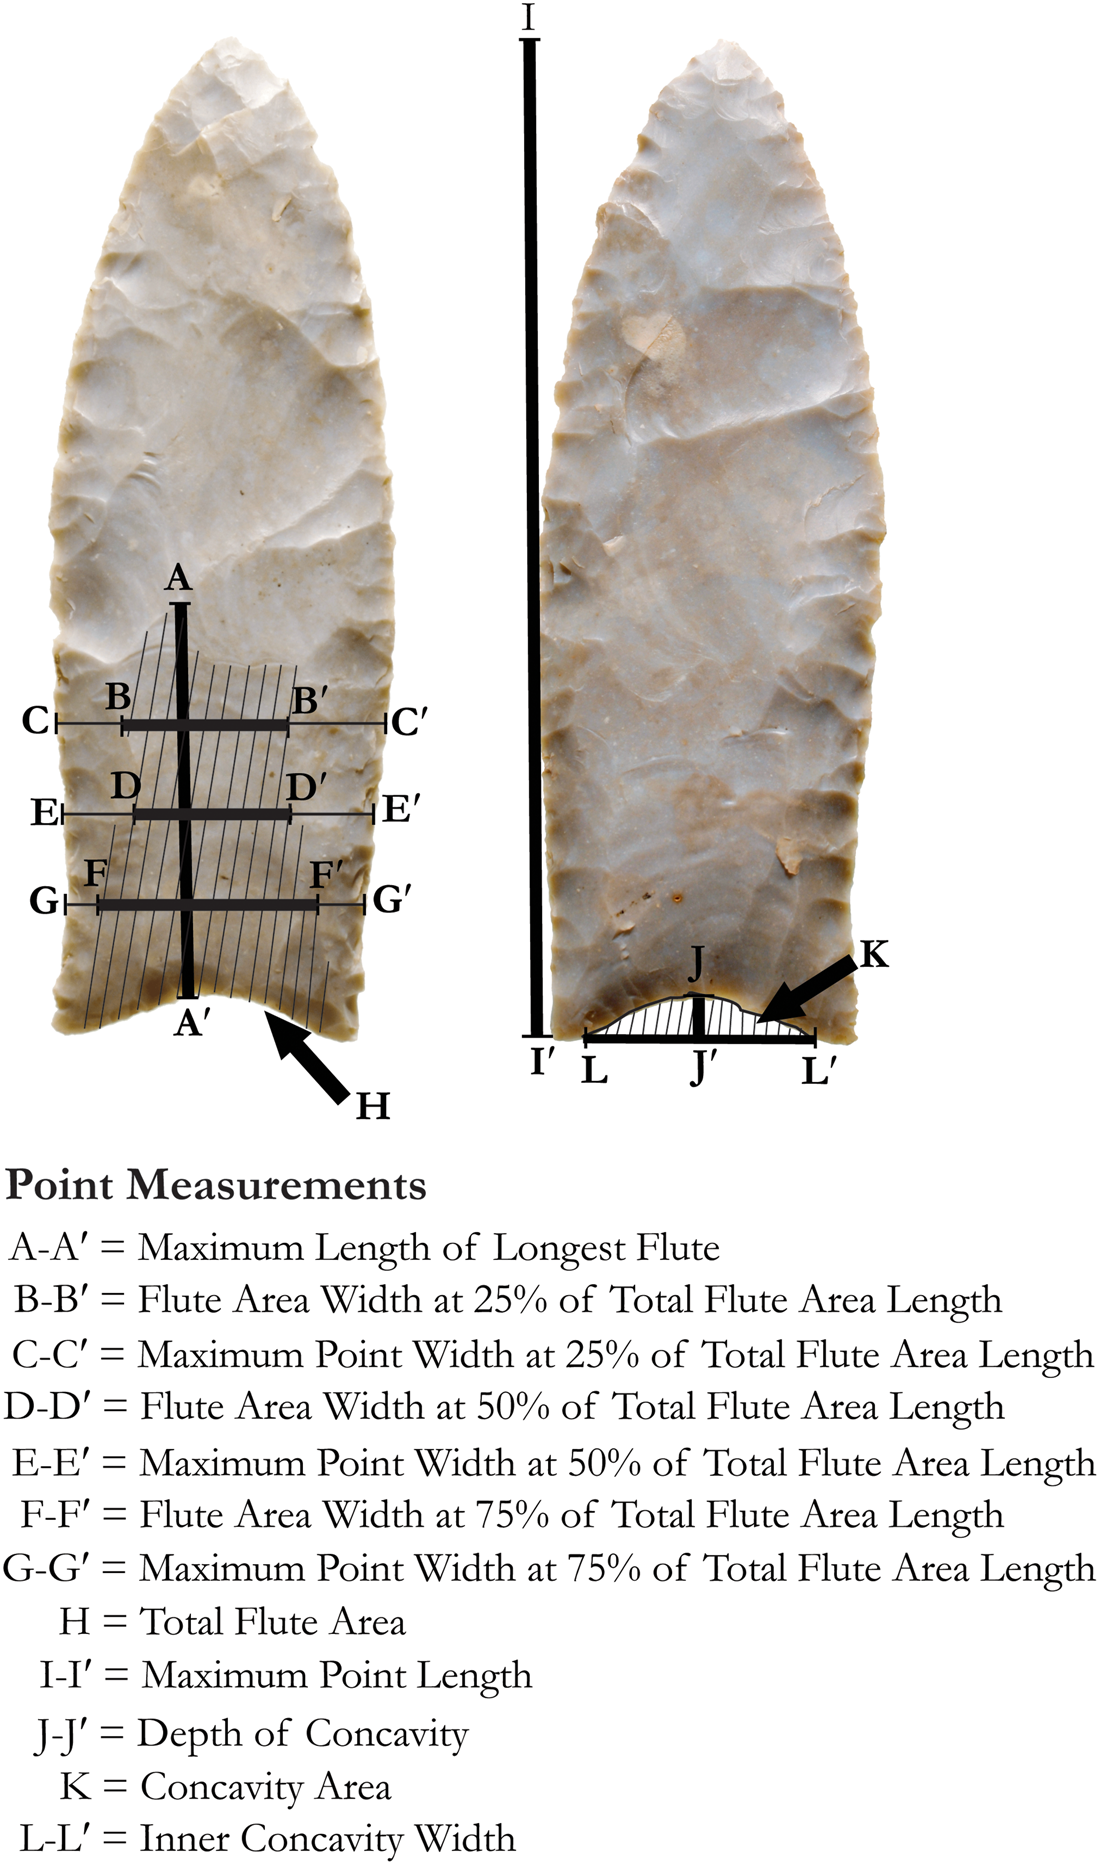
Figure 2. Schematic showing how 12 continuous measures (A–L) were recorded to document size and shape data. (Photo courtesy of Michael Waters. Image by Ashley M. Smallwood.) (Color online)
To assess if patterns of standardization (i.e., comparatively lower variation in an aspect [or aspects] of point design) are a product of sample bias, we compare Clovis and Dalton points from data analyzed in Smallwood et alia (Reference Smallwood, Jennings, Pevny and Anderson2019). The sample includes an additional 47 Clovis points and 30 Dalton points from across the American Southeast. Data was collected from 2D images uploaded to PIDBA (Anderson and Miller Reference Anderson and Miller2017).
Capturing 3D Models
To capture 3D models, points were scanned with the Einscan Pro 2X and David SLS-2 3D scanners (Note: this was a multi-institution project, and both scanners produced comparable 3D model resolution). Three-dimensional meshes were prepared for analysis in MeshLab (Cignoni et al. Reference Cignoni, Callieri, Corsini, Dellepiane, Ganovelli, Ranzuglia, Scarano, De Chiara and Erra2008). To slice points at the termination of the longest flute, each complete point file was imported into Autodesk Netfabb 2019.0 Build:1889 and sliced using the Cut function.
Geometric Morphometrics of 3D Models of Complete Points and Base Portions, and 2D Cross Sections of 3D Models
For the 3D GM analyses, we used AGMT3-D (Herzlinger and Goren-Inbar Reference Gadi and Goren-Inbar2020; Herzlinger and Grosman Reference Gadi and Grosman2018; Herzlinger et al. Reference Gadi, Goren-Inbar and Grosman2017). AGMT3-D overlays a grid of geometrically defined semilandmarks across each biface, indexed to preserve homology. We used a 50 × 50 grid for 2,500 landmarks across each face. We analyzed 3D models of complete points and base portions (i.e., base portions created after splitting 3D models horizontally, perpendicular to the long axis, at the termination of the longest flute).
Finally, flutes are often described as creating channel scars within the base. To explore potential differences in cross-section shapes, we sliced points perpendicular to the long axis across the midsection of the dominant flute. The cross-section image was captured in Netfabb. We then digitized 40 equidistant landmarks around the edge in tpsDig and conducted 2D GM analysis in MorphoJ (Klingenberg Reference Klingenberg2011).
For 2D and 3D GM, generalized Procrustes analysis (GPA) was performed to superimpose semilandmark constellations of each artifact onto the same centroid location and remove non-shape-related variability (Bookstein Reference Bookstein1991; Herzlinger and Grosman Reference Gadi and Grosman2018; Klingenberg Reference Klingenberg2011; Smith and Goebel Reference Smith and Goebel2018). Principal component analysis (PCA) is applied to the pooled covariance matrix to generate scores for each noncorrelated, perpendicular shape axis. Principal component (PC) scores describe the relative shape positions of each artifact relative to every other artifact in the sample, and PC scores are the primary data output for shape comparisons in GM analysis. Statistical analyses of PC scores are described below.
Statistical Analyses of 2D and 3D Data and Testing Allometry
Statistical analyses were conducted in SPSS Version 27 following standard practice (Van Pool and Leonard Reference VanPool and Leonard2011). Coefficent of variation (CV) is used to assess relative differences in standardization (Bamforth and Finlay Reference Bamforth and Finlay2008; Buchanan et al. Reference Buchanan, O'Brien, David Kilby, Huckell and Collard2012; Eerkens and Bettinger Reference Eerkens, Bettinger and O'Brien2008; Jennings Reference Jennings2016; Shott Reference Shott1986; Smith and De Witt Reference Smith and DeWitt2016). For CV of GM PC scores, we follow Wang and Marwick (Reference Wang and Marwick2020) by normalizing to 1–10 and testing for significant differences (Krishnamoorthy and Lee Reference Krishnamoorthy and Lee2014) using the R package cvequality (Version 0.2.0; Marwick and Krishnamoorthy Reference Marwick and Krishnamoorthy2019). We use Mann-Whitney U tests to compare measurements and PC scores for the 3D and 2D GM analyses. Next, PCA, in particular, does not balance between-group differences with within-group variation (MacLeod Reference MacLeod2018). Consequently, we use discriminant function analysis (DFA; Buchanan and Collard Reference Buchanan and Collard2010; Buchanan et al. Reference Buchanan, Collard and O'Brien2020; Klingenberg and Monteiro Reference Klingenberg and Monteiro2005; Rohlf et al. Reference Rohlf, Loy and Corti1996; Smith and Goebel Reference Smith and Goebel2018) with leave-one-out cross-validation (Gingerich et al. Reference Gingerich, Sholts, Wärmländer and Stanford2014). Because we have different sample sizes of Clovis and Dalton points, we use TAU (Kovarovic et al. Reference Kovarovic, Aiello, Cardini and Lockwood2011) and Press's Q (Maroco et al. Reference Maroco, Silva, Rodrigues, Guerreiro, Santana and de Mendonça2011) to evaluate DFA significance and predictive accuracy relative to chance.
Last, as Shott (Reference Shott2020), Buchanan (Reference Buchanan2006; Buchanan et al. Reference Buchanan, O'Brien, David Kilby, Huckell and Collard2012), and others have cautioned, stone tools are reductive, and size becomes smaller with each resharpening event. Because of this and because of design constraints related to utilitarian function, some attributes such as maximum linear measurements can scale allometrically. If fluting played an important role in Clovis point production and the utilitarian function of Clovis points, and if this role was changing in Dalton, the allometric relationships between flutes and point sizes may be stronger in Clovis than in Dalton. We test this hypothesis using 2D measurements. We follow Buchanan et alia (Reference Buchanan, David Kilby, Huckell, O'Brien and Collard2012) and Shott (Reference Shott2020) in using natural log transformations and regression to test for allometric scaling. The slopes of the regression lines approximate allometric constant k. As Goswami and Polly (Reference Goswami and Polly2010) note, Procrustes superimposition does not remove the portion of shape that is correlated with size. For the 2D image measurements and for the 3D whole point and base portions analyzed in AGMT3-D, we use volume as a size estimate. For the 2D cross-section slices analyzed in MorphoJ, we use centroid size.
Results
Linear Distance and Area Measurements of 2D Images
When comparing Maximum Length of the Longest Flute, Clovis points have significantly longer flutes (U = 649, p < 0.001), and flutes comprise a significantly greater percentage of total point length (U = 1071, p = 0.001)—roughly 30% compared to 20% in Dalton. Clovis-point total flute area is significantly larger than Dalton-flute area (U = 676, p < 0.001). Clovis-point flutes at 25% (U = 1029.5, p < 0.001) and 50% (U = 1171, p = 0.006) of the flute length area are significantly wider, and the ratio of flute width to point width at 25% differs significantly (U = 1194, p = 0.009). In other words, Clovis flute scars encompass a greater percentage of point width moving up from the basal edge and into the point midsection. Interestingly, closer to the base, at 75%, flute widths and width ratios do not significantly differ (U = 1463, p = 0.242). Consequently, although flute scars begin at similar widths, Clovis flintknappers maintained wide flute scars in the point midsection, but Dalton flute scars become increasingly narrower farther from the basal edge. Clovis points have significantly shallower basal concavities (U = 2090, p = 0.028) but larger inner concavity widths (U = 1000, p < 0.001). However, Clovis and Dalton point concavity areas do not differ significantly (U = 2044, p = 0.052). CV values for flute variable measurements are very similar between Clovis and Dalton (Figure 3), whereas Clovis point CVs for length ratio and width ratios are lower than Dalton. We used these flute measurements and ratios from the 119 Clovis and Dalton point faces (i.e., both sides of each point; [e.g., Andrefsky Reference Andrefsky2005:22]) in a DFA to determine how well they distinguish between Clovis and Dalton (Figure 4). Total point length was not included. Cross-validated DFA successfully classifies 89.4% of point faces. Chance-corrected TAU is 65.7%, and this result is significantly better than chance alone (Press's Q = 57.89, p < 0.001).
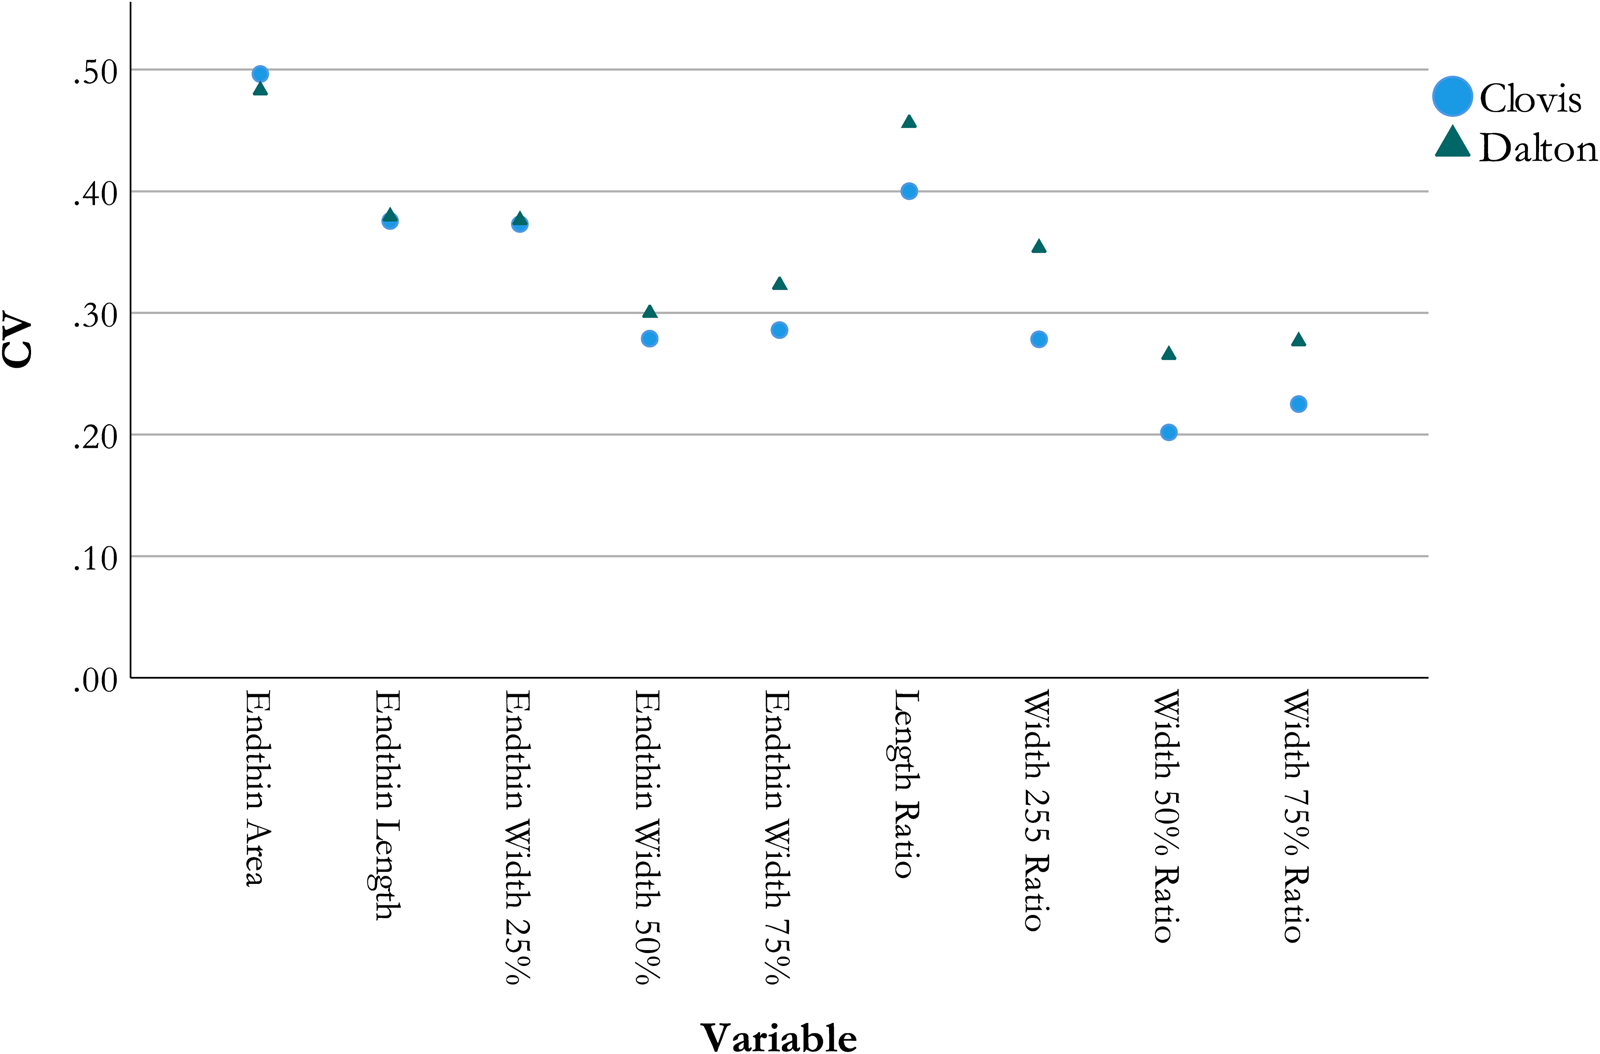
Figure 3. Scatter plot comparison of Clovis and Dalton coefficients of variation (CV) for traditional linear and area measurements. (Image by Thomas A. Jennings.)

Figure 4. Scatter plot of Clovis and Dalton DFA scores generated from 2D measurements and ratios. Lines connect to group centroids. (Image by Thomas A. Jennings.) (Color online)
Testing for allometry by regressing flute area against 2/3-point volume (Figure 5), based on the geometric relationships described in Buchanan and Hamilton (Reference Buchanan and Hamilton2020), shows that Clovis-point flute areas have a significant negative allometric relationship with point volume (p < 0.001, slope = 0.35, standard error = 0.087, r 2 = 0.291). For Dalton points, although the result is barely significant (p = 0.050), the slope (slope = 0.23, standard error = 0.117) and the variance explained are much smaller (r 2 = 0.047). Clovis flute lengths (Figure 6) show significant negative allometric scaling with total point length (p < 0.001, slope = 0.66, standard error = 0.156, r 2 = 0.314), whereas Dalton flute lengths do not (p = 0.455, slope = 0.11, standard error = 0.153, r 2 = 0.007). Clovis flute area widths measured at 50% of the flute length area (Figure 7) also show significant negative allometric scaling with point length (p < 0.001, slope = 0.51, standard error = 0.095, r 2 = 0.43), whereas Dalton 50% flute widths do not (p = 0.666, slope = 0.06, standard error = 0.127, r 2 = 0.002).

Figure 5. Allometric linear regressions of natural log 2/3 Volume and ln Flute Area for Clovis and Dalton samples. (Image by Thomas A. Jennings.)

Figure 6. Allometric linear regressions of natural log Total Point Length and ln Flute Length for Clovis and Dalton samples. (Image by Thomas A. Jennings.)

Figure 7. Allometric linear regressions of natural log Total Point Length and ln Width at 50% of Total Flute Area for Clovis and Dalton samples. (Image by Thomas A. Jennings.)
Geometric Morphometrics of 3D Models of Complete Points
For the 3D complete point GM, the first four principal components (PCs) explain 82% of the variation in point shape, and these were used in DFA. PC1, although not significantly different (U = 419, p = 0.748), recognized variation in the point blades. PC 3 (U = 196, p < 0.001) and PC4 (U = 79, p < 0.001) differ significantly, and they capture differences in ear morphologies and lateral basal margin curvature. Cross-validated DFA correctly classified 90.5% of points. Chance-corrected TAU is 78.6%, and these results are significantly better than chance alone (Press's Q = 41.29, p < 0.001). The DFA score scatter (Supplemental Figure 1) and the scatter of PC3 versus PC4 (Figure 8) show how 3D GM distinguishes Clovis and Dalton point morphologies.
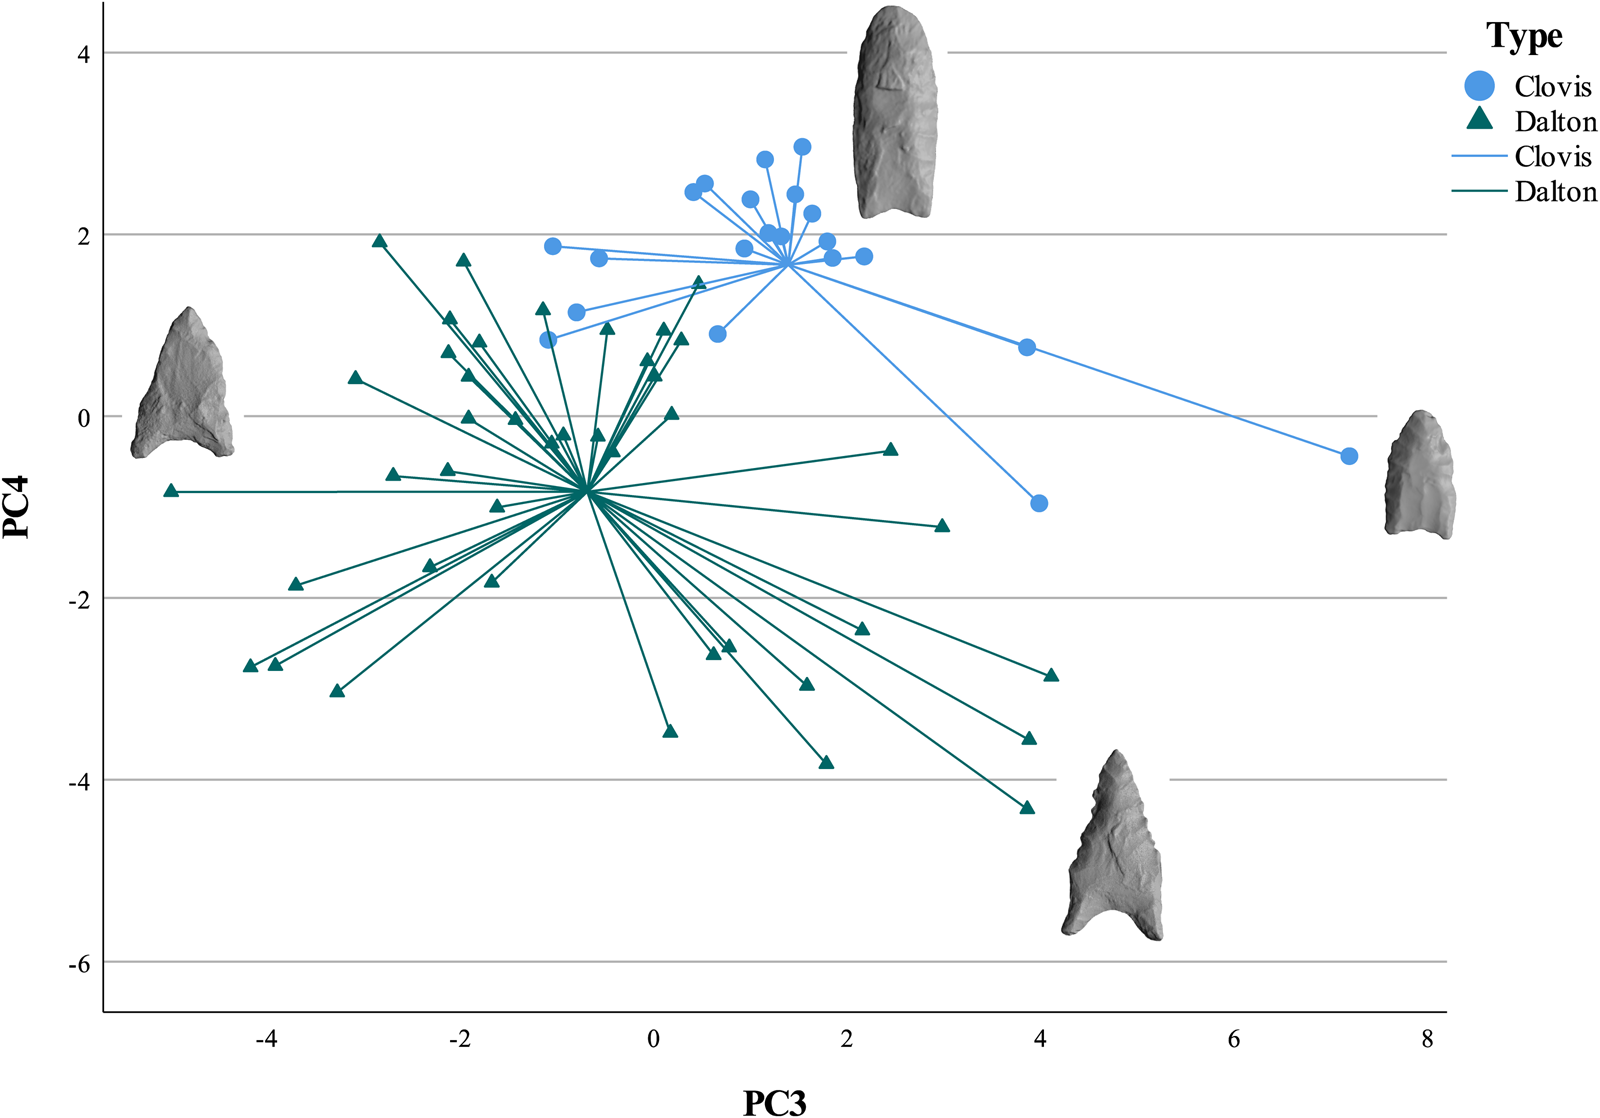
Figure 8. Scatter plot of Clovis and Dalton PC3 and PC4 scores from 3D GM analyses of complete points. Point images represent high and low values of each PC. (Image by Thomas A. Jennings.) (Color online)
Geometric Morphometrics of 3D Models of Point Base
For the 3D GM point base comparisons, the first six PCs explain 82% of the variation in shape. The six PCs were analyzed using DFA to determine how well they distinguish between Clovis and Dalton. PCs 4 (U = 278, p = 0.001) and 5 (U = 78, p = 0.008) differ significantly, and they capture differences in ear morphologies and the shapes of the inner basal concavity related to the robustness of basal ears. Dalton points have narrower and deeper basal concavities, and some have more robust basal ears than Clovis. Cross-validated DFA correctly classified 72.5% of points. Chance-corrected TAU is 34.5%, and these results are significantly better than chance (Press's Q = 8.1, p = 0.004). The DFA score scatter (Supplemental Figure 2) and the scatter of PC4 versus PC5 (Figure 9) also show how 3D GM distinguishes between Clovis and Dalton point morphologies. Furthermore, 3D GM demonstrated that Clovis point base forms are significantly more bifacially symmetrical (U = 173, p = 0.03), whereas Dalton point bases deviate farther from bifacial symmetry.
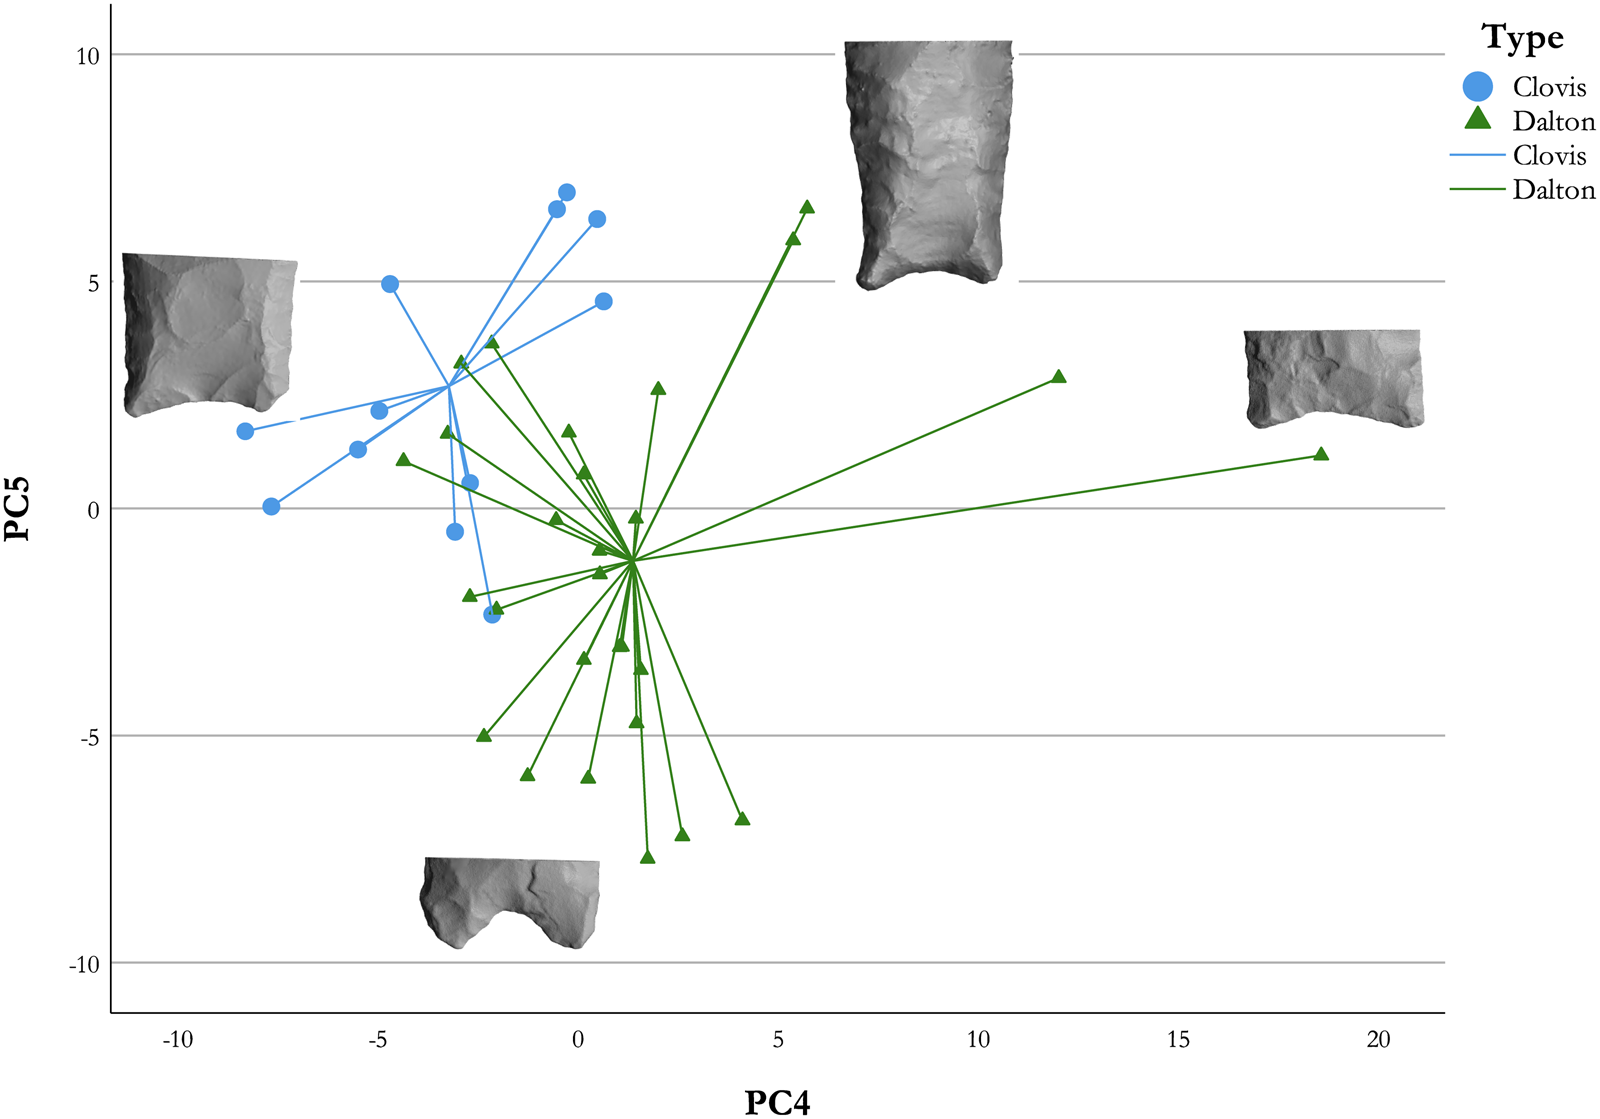
Figure 9. Scatter plot of Clovis and Dalton PC4 and PC5 scores from 3D GM analyses of point bases. Point images represent high and low values of each PC. (Image by Thomas A. Jennings.) (Color online)
Geometric Morphometrics of 2D Cross Sections of 3D Models
For the 2D cross-section GM, the first three PCs account for 84% of the variability. PC1 scores differ significantly (U = 605, p = 0.017), but PC2 and PC3 scores do not. Clovis PC1 scores group in the middle and have hexagonal cross-sectional shapes. Dalton points with high PC1 scores have biconcave cross sections, and Dalton points with low PC1 scores have plano-convex cross sections. Graphing PC1 against PC2 (Figure 10) shows the tighter clustering of Clovis cross sections. Using these three PCs, cross-validated DFA correctly classified only 63.5% of points. Chance-corrected TAU is only 17.8%. Although this result is significantly better than chance alone (Press's Q = 4.59, p = 0.032), we note that Dalton and Clovis flute cross-section morphologies overlap considerably (Supplemental Figure 3). After normalizing PC1 scores to 1–10, the Clovis CV is 17.01%, and the Dalton CV is 32.00%. The modified signed-likelihood ratio test shows that these CVs differ significantly (p = 0.005).
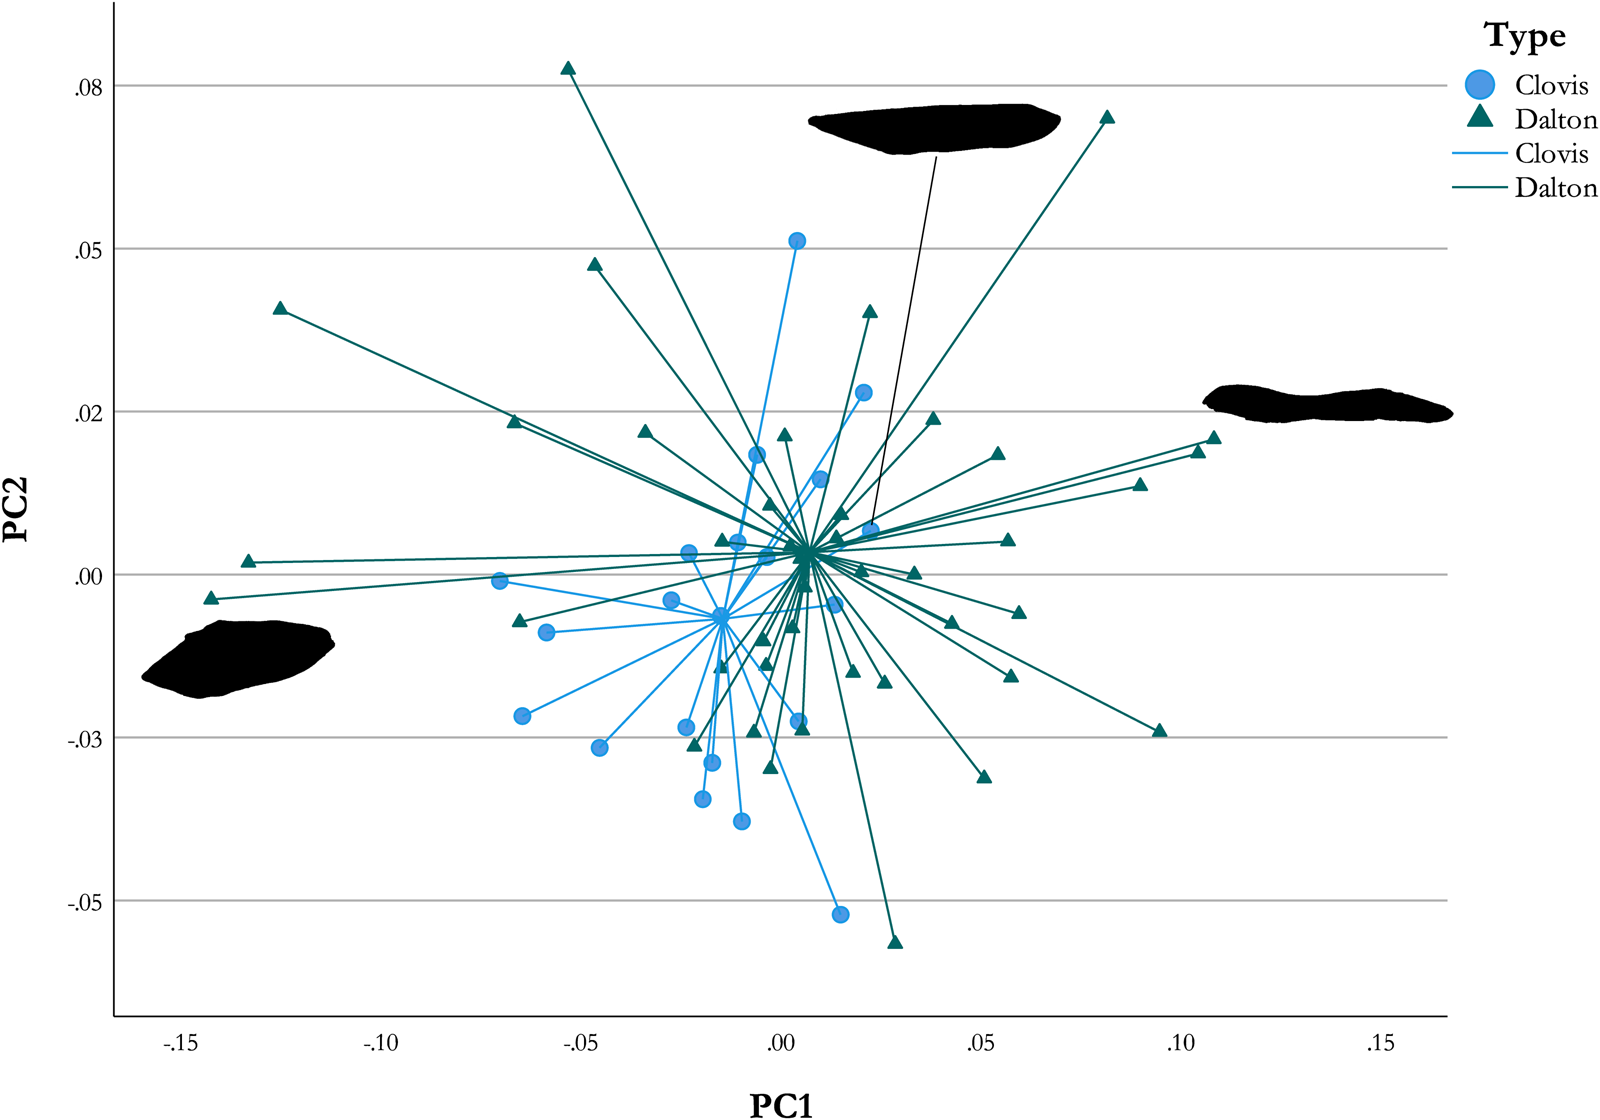
Figure 10. Scatter plot of Clovis and Dalton PC1 and PC2 scores from 2D GM analyses of point base cross sections. Cross-section images represent high and low values of each PC. (Image by Thomas A. Jennings.) (Color online)
Discussion
Defining Fluting Differences in Clovis and Dalton Point Production
Analyses of linear distance and area measurements from 2D images show that Clovis and Dalton point flutes are significantly morphologically different and support previous descriptions of technological differences in how each was fluted. Clovis flutes are longer, comprise a higher proportion of total point length, encompass a greater area, and are wider as they extend into the point midsection, reaffirming that flutes were prominent attributes of Clovis point design. Significant differences in the basal concavity depth and inner concavity width may also reflect differences in how points were fluted. The shallow, wide Clovis concavity supports hypothesized Clovis fluting via percussion flaking of beveled basal platforms and/or shaping some bases around previous flute removals (Bradley et al. Reference Bradley, Collins and Hemmings2010; Waters and Jennings Reference Waters and Jennings2015; Waters et al. Reference Waters, Pevny, Carlson, Dickens, Smallwood, Minchak and Bartelink2011). Dalton points have deeper, narrower concavities, which support hypothesized fluting via pressure flaking (Goodyear Reference Goodyear1974:24).
CV comparisons hint at important differences in fluting standardization. In absolute size, Clovis and Dalton flutes have similar CVs, suggesting a similar degree of size variation within each sample. However, CVs generated for flute length ratio and width ratios suggest a higher degree of morphological standardization in Clovis fluting.
Allometric comparisons reveal significant differences. Clovis-point flute sizes have a negative allometric relationship with point size. Larger Clovis points do not have proportionally larger flute scars; likewise, smaller Clovis points do not have smaller flutes. Dalton flute sizes do not scale allometrically, and they are more proportional to point size. Compared to Dalton points, Clovis flutes appear to have been crafted to meet specific size goals regardless of point size. Coupled with the CV standardization results, this suggests that the functional role of fluting differed in Clovis and Dalton.
Three-dimensional analyses of complete points show that Clovis and Dalton points, although similar in outline and size, can be statistically differentiated using 3D GM. Clovis points have straighter lateral basal margins, and Dalton points have more incurvate lateral margins with slightly flared basal ears, and these shapes are quantified in 3D PC scores. Three-dimensional GM of point bases encompassing the flute area also significantly distinguishes Clovis and Dalton points. Dalton point bases have narrow and relatively deep basal concavities, whereas concavities of Clovis points are typically shallower and wider. Dalton points often have more robust ears.
These results offer new insight for classification beyond type trait lists. Typological descriptions of Dalton often focus on using blade margin characteristics, including beveling and serrations, to distinguish Dalton points (Anderson et al. Reference Anderson, Smallwood and Miller2015; Goodyear Reference Goodyear1974). However, these results show that basal characteristics alone can be used to distinguish Clovis and Dalton. Dalton points recovered at various stages in the use-life continuum—with or without beveled and serrated blade margins—can still be classified and distinguished from Clovis using 3D GM analysis, making this approach useful for distinguishing between proximal fragments or complete points. Notably, the PC scores generated in GM analyses are sample specific, and the score values themselves cannot be used in type descriptions. GM is not a substitute for technological analysis (Lycett et al. Reference Lycett, von Cramon-Taubadel and Foley2006). We view 3D GM as a useful complement to explore how typological schemes align with and diverge from 3D point shapes.
Significant differences in 3D bifacial symmetry and 2D cross sections of the point bases show that clear morphological differences exist and may indicate technological differences in the process of Clovis and Dalton point production. Clovis bases are more bifacially symmetrical than Dalton bases. 2D GM comparisons of the 3D cross sections of the flute channel show that Dalton flute cross-section shapes are more varied, but many overlap with the more homogenous Clovis cross-section shapes. Our Clovis sample includes newly made, unused, cached points and variously used and nearly exhausted points. Yet, in terms of flute and basal morphologies, the Clovis points display remarkable standardization.
To assess if this pattern of greater standardization in Clovis—seen through 2D flute ratios, allometric relationships, and 2D cross-section shapes—is a product of the relatively small Clovis sample used in this study, we include comparisons of Clovis and Dalton points from data analyzed in Smallwood et alia (Reference Smallwood, Jennings, Pevny and Anderson2019). Clovis points recovered across the Southeast have significantly longer flutes (H = 42.195, p < 0.001), larger flutes as a proportion of total point length (H = 20.013, p < 0.001), and flute areas greater than those of Dalton points (H = 39.14, p < 0.001). Clovis flute lengths again show significant negative allometric scaling with total point length (p < 0.001, slope = 0.29, standard error = 0.039, r 2 = 0.466), whereas Dalton flute lengths do not (p = 0.84, slope = 0.07, standard error = 0.039, r 2 = 0.043). Regionally, Dalton flute lengths show no allometric scaling with point length. CV values for Clovis-point flute area and flute length relative to overall point length are much smaller than for Dalton (Table 2). Consequently, although Clovis flutes are significantly larger, they are also substantially less varied. Dalton flute-scar area and length of flute relative to maximum point length are more variable. However, CV values for maximum flute length are similar in Clovis and Dalton, which means that the length of the longest flutes on Clovis and Dalton points vary to a similar degree. These regional results mirror the results of the study sample.
Table 2. Coefficient of Variation Values of Clovis and Dalton Points, Including the Current Study Sample and Points from the Greater American Southeast from Smallwood et alia (Reference Smallwood, Jennings, Pevny and Anderson2019).

In comparison to Dalton, Clovis flintknappers created point bases with greater standardization in design. They crafted bifacially symmetrical point bases and evenly fluted both faces to create long, wide flute channels. This result is in agreement with Sholts and colleagues’ (Reference Sholts, Stanford, Flores and Warmlander2012) analysis of Clovis flake scar contours and bifacial symmetry and their conclusion that Clovis points share remarkable technological uniformity in flaking patterns—in other words, standardization in design. Comparatively, Dalton flutes display greater variation and no allometric scaling with point size. Dalton point makers placed less emphasis on standardizing point-base design, allowing for more variation in overall bifacial symmetry of the base and in the channels created by fluting.
The Changing Role of Fluting and the De-emphasis of Fluting in Dalton
How do these morphological and technological differences relate to changes in the role of fluting from Clovis to Dalton? Standardization in base design could have been influenced solely by aesthetic bias (e.g., when cultural attitudes toward visual features of point design lead to a selection for or against morphological traits) or prestige bias (e.g., when a flintknapper's prestige influences other toolmakers to copy aspects of point design and manufacturing techniques; Lycett Reference Lycett2015:25; O'Brien et al. Reference O'Brien, Boulanger, Buchanan, Collard, Lee Lyman and Darwent2014). However, the comparatively high degree of standardization in Clovis versus Dalton fluting and basal morphology along with the allometry differences suggest to us that utilitarian functional constraints may have played a prominent role. The hypothesis that fluting helps secure the point in the haft implies that significant changes in flute size, area, and shape from Clovis to Dalton would be associated with significant changes in how points were hafted. If flute-scar size and shape are directly related to haft size and shape, then our results that Dalton displays greater variation in basal and flute morphologies could suggest that Dalton point makers also used haft elements that varied in design. However, given that some Dalton flute scars can be considerably shorter than the base length (Ray Reference Ray2016:136), a more likely hypothesis is that Dalton flute scars did not relate to hafting. In other words, the shape and size of a flute did not determine whether a Dalton point could be effectively hafted.
In another hypothesis, Eren and colleagues (Reference Eren, Bebber, Knell, Story and Buchanan2022) suggest that regionalization during the Late Paleoindian period may have resulted in decreased communication and a lower effective population size for communities of toolmakers, possibly resulting in the loss of complex knowledge such as fluting. Fluting certainly requires skill, as evidenced by high failure rates (Sellet Reference Sellet2004). If a hypothetical flintknapping community is no longer fluting points, one could reasonably expect fluting proficiency to decrease. However, although there is greater variation and deviation from Clovis when viewed at the artifact population scale, many individual Dalton point flutes are similar in size and shape to Clovis flutes. This suggests that there was not a sudden loss of fluting knowledge during Late Paleoindian regionalization. We view this reduction of fluting knowledge, if it occurred, as a product rather than a cause of the end of fluting.
Beyond thinning, the initial emphasis and later de-emphasis of fluting may relate to changes in design requirements for point durability. Clovis populations, the innovators of fluting, in the Southern Plains and throughout the South were mobile hunter-gatherers who relied on high-quality stone sources that outcropped at spatially dispersed locations across the landscape. Fluting—and its potential advantage of channeling impact forces to improve Clovis point resilience through shock absorption (Story et al. Reference Story, Eren, Thomas, Buchanan and Meltzer2019; Thomas et al. Reference Thomas, Story, Eren, Buchanan, Andrews, O'Brien and Meltzer2017)—would have prolonged a Clovis point's use life. Their descendants, Folsom hunter-gatherers, were even more residentially mobile and regularly occupied areas of the Plains where high-quality stone sources were limited to absent. Folsom populations took fluting to its morphological extreme, fully fluting points and hafting up to the tip. This design served to avoid catastrophic failure and maximize projectile-point reuse events (Bement Reference Bement, Clark and Collins2002; Buchanan Reference Buchanan2006; Hunzicker Reference Hunzicker2008).
Dalton populations, however, may have relied less on fluting for point durability because of two major technological changes: (1) Dalton populations became increasingly more settled into locations and therefore relied more heavily on local resources and (2) Dalton point makers diversified the utilitarian functionality of points. By the end of the Younger Dryas, Dalton populations were becoming increasingly concentrated within and more closely tied to smaller geographic ranges (Anderson et al. Reference Anderson, Smallwood and Miller2015; Koldehoff and Loebel Reference Koldehoff, Loebel, Adams and Blades2009; Morse Reference Morse1971; Schiffer Reference Schiffer1975). With this shift in landscape use, Dalton populations made increased use of locally available and often poorer-quality stone (Anderson Reference Anderson, Tankersley and Isaac1990:184; Jennings Reference Jennings2008; Smallwood et al. Reference Smallwood, Jennings, Anderson and Ledbetter2015). Although fluting to increase projectile durability may have been a stone-conservative, risk-minimizing strategy for Clovis knappers (Thomas et al. Reference Thomas, Story, Eren, Buchanan, Andrews, O'Brien and Meltzer2017), the significant differences in Dalton fluting may be the product of the adaptive shift toward locally available stone resources, including smaller, more variable package sizes such as cobbles (Jennings Reference Jennings, Hurst and Hofman2010) that may have required greater adaptability in how points were made. The stone blanks selected for point production could influence, but not necessarily constrain (see Eren et al. Reference Eren, Roos, Story, von Cramon-Taubadel and Lycett2014), final point form. If Dalton point makers used smaller flake blanks more often in the production of points (Goodyear Reference Goodyear1974:22), the end products may have retained the plano-convex cross-section shape of the original flake and/or may have required less flaking on one biface surface to achieve desired point thickness. Clovis point production, however, often involved the reduction of tabular or lenticular biface blanks—blank types that can be initially more symmetrical in cross section (Bradley et al. Reference Bradley, Collins and Hemmings2010). These production differences may explain the greater Dalton base asymmetry. Increased reliance on local toolstone supplies that could be more easily replenished (Koldehoff and Walthall Reference Koldehoff, Walthall, Cantwell, Conrad and Reyman2004) may have made point use life as a projectile—and by extension manufacturing techniques that increased durability and shock absorption—less important considerations for Dalton groups. Furthermore, the multifunctionality of Dalton points significantly increased beyond that of Clovis. Dalton point makers substantially altered their technology by crafting points with serrated, beveled, and tapered blade margins. These attributes may have improved projectile functionality, (O'Brien and Wood Reference O'Brien and Wood1998; Smallwood et al. Reference Smallwood, Pevny, Jennings and Morrow2020) but these edges were also used with equal intensity as knives (Smallwood et al. Reference Smallwood, Pevny, Jennings and Morrow2020; Yerkes and Gaertner Reference Yerkes, Gaertner and Morse1997). Dalton points were also shaped as endscrapers, burins, and perforators. The increased emphasis on multifunctionality in Dalton points resulted in decreased emphasis on the need for projectile shock absorption and durability—therefore, the need for fluting. These adaptive shifts led to a reorganization in Paleoindian point technology within an approximately 300- to 500-year period. Without functional constraints, the historical trajectory (O'Brien et al. Reference O'Brien, Boulanger, Buchanan, Collard, Lee Lyman and Darwent2014; Shott Reference Shott2013) of fluting persisted in Dalton but was deemphasized and became a vestigial attribute on the downward slope of its adaptive peak (cf. Brantingham and Kuhn Reference Brantingham and Kuhn2001; Lycett and Eren Reference Lycett and Eren2013; Norris et al. Reference Norris, Stephens and Eren2019).
Conclusion
In addressing the changing role of fluting in bifacial point production, we show that Clovis toolmakers standardized flute shape significantly more than their Dalton descendants. In comparison to Clovis, Dalton flute scars were significantly reduced in size. Dalton point makers not only crafted points with greater variation in flute-scar shapes but also in point-base morphology. As the importance of fluting decreased, fluting became a point production characteristic that lasted beyond its original functional use. We propose that Dalton fluting was a vestigial attribute of point technology. Methodologically, we demonstrated the utility of using 3D artifact models to gain a more geometrically complete perspective of point shape, but we also recognized several important patterns in variation by combining analyses of 2D and 3D data with traditional linear and area measurements.
Acknowledgments
Access to the Blackwater Draw points was provided by Brendon Asher, the Blackwater Draw Museum, and Eastern New Mexico University. Thanks to Taylor McCoy, Fanxiu Meng, Laura Evans, Don Purdon, and Erick Martinez for 3D scanning; and to Barbara Senn for access to the ENMU imaging lab. Lee and Cindy Jones and Mark Mullins and Dana Harper made the study of the Hogeye Clovis cache possible. Thanks to Dave Nolan, Larry Conrad, Paul Welton, Herb Mangold, and Kevin Coatney for allowing us to study their Dalton collections. Mary Hynes, Pat Durst, and Steve Boles assisted with Illinois State Archaeological Survey (ISAS) / Illinois Department of Transportation specimens. Jennifer Goldman and Adam Tufano offered space and equipment for photography at ISAS. Lisa Guerre and George Crothers of the William S. Webb Museum of Anthropology assisted with Kentucky Dalton collections. We are grateful for the helpful comments provided by Briggs Buchanan, Metin Eren, and two anonymous reviewers. We appreciate the helpful conversations about methods with Gadi Herzlinger, Norman MacLeod, Michael J. Shott, and Zac Selden. We thank Robert Bischoff who organized a symposium for the 2021 Society for American Archaeology meeting that encouraged this research. The Executive Vice President for Research and Innovation and College of Arts and Sciences at University of Louisville provided funding for this research.
Data Availability Statement
Additional methods for recording linear distance and area measurements are described in Supplemental Text 1. Scatter plots of Clovis and Dalton DFA scores generated from 3D GM PC scores of complete points, point bases, and point base cross sections are provided in Supplemental Figures 1–3. Clovis points from Blackwater Draw are curated at Eastern New Mexico University. Dalton points, from various collections throughout Illinois, are curated at and obtained by the Illinois State Archaeological Survey (ISAS). Dalton points from Kentucky are curated at the William S. Webb Museum at the University of Kentucky.
Competing Interests
The authors declare none.
Supplemental Material
For supplemental material accompanying this article, visit https://doi.org/10.1017/aaq.2022.19.
Supplemental Text 1. Description of Methods for Recording Linear Distance and Area Measurements of 2D Images.
Supplemental Text 2. Additional References Cited.
Supplemental Figure 1. Scatter Plot of Clovis and Dalton DFA Scores Generated from 3D GM PC Scores of Complete Points.
Supplemental Figure 2. Scatter Plot of Clovis and Dalton DFA Scores Generated from 3D GM PC Scores of Point Bases.
Supplemental Figure 3. Scatter Plot of Clovis and Dalton DFA Scores Generated from 2D GM PC Scores of Point Base Cross Sections.


