


Seasonal influenza epidemics present a significant public health challenge, and early detection is crucial for disease control. In the last few years, the availability of big data from novel sources has contributed substantially to influenza surveillance. Previous studies have proposed the use of big data analysis of online news reports,Reference Collier, Doan and Kawazoe 1 - Reference Tolentino, Kamadjeu and Fontelo 3 search engine queries,Reference Yuan, Nsoesie and Lv 4 - Reference Hulth and Rydevik 6 and social mediaReference Broniatowski, Paul and Dredze 7 - Reference Pawelek, Oeldorf-Hirsch and Rong 14 to detect influenza epidemics. The new media used to disseminate information from credible sources to the public and as a platform to share personal experiences and opinions has become an important source of health information as well as the new public sphere during health crises.Reference Gesser-Edelsburg, Shir-Raz and Walter 15 Although the predictive utility of big data have been debated in light of the recent errors in Google Flu Trends (GFT),Reference Lazer, Kennedy and King 16 , Reference Lazer, Kennedy and King 17 the majority of researchers agree that this novel data paradigm offers significant possibilities for infectious disease surveillance, in accordance with the development of more sophisticated methodologies.Reference Milinovich, Williams and Clements 18
Here, we propose an advanced method for the detection of influenza outbreaks by analyzing social media data. Our approach to identify influenza-related keywords from social media is distinct from that used for search engine query data, which are submitted with the sole purpose of obtaining information. Social media plays host to the expression of a wide variety of personal experiences pertaining to health, including disease symptoms, coping, and recovery.Reference Broniatowski, Paul and Dredze 7 , Reference Santos and Matos 8 Therefore, it represents a highly contextual data source, with a greater breadth compared with search engine query data, and can also be used to disseminate information.Reference Milinovich, Williams and Clements 18 , Reference Kass-Hout and Alhinnawi 19
Words that consistently appear with the word “influenza” in social media contexts can be used as keywords for the detection of an influenza outbreak. Previous studies have demonstrated that data from TwitterReference Broniatowski, Paul and Dredze 7 , Reference Santos and Matos 8 , Reference Paul, Dredze and Broniatowski 11 - Reference Pawelek, Oeldorf-Hirsch and Rong 14 and web blogsReference Corley, Cook, Mikler and Singh 9 , Reference Gu, Chen and Zhu 10 are in accordance with official surveillance data. In a recent study, the use of data from Twitter was not associated with outbreak overestimation, unlike GFT. Moreover, the rate of specific tweets was strongly correlated with Centers for Disease Control and Prevention (CDC) influenza-like illness (ILI) rates.Reference Broniatowski, Paul and Dredze 7 , Reference Broniatowski, Paul and Dredze 20 However, the use of social media data for influenza surveillance is a relatively novel approach, and several recent studies have relied solely on the keyword “influenza,” despite the rich source of available information associated with the various phases and manifestations of influenza epidemics. Moreover, in several countries such as Korea, Twitter use is not widespread although a number of people use social network services (SNS). In Korea, only 19.4% of SNS users use Twitter. 21 Thus, to represent a larger proportion of the Korean population, we focused on multiple data sources.
This study identified keywords detecting influenza epidemics, taken from both Twitter and blog data. Our method included the following steps: initial keyword selection to identify keywords in posts discussing influenza that serve as latent indicators; generation of a keyword time series using a preprocessing approach based on extract conditions; and optimal feature selection using algorithms that improve model performance.
METHODS
Data Sources
Social Media Data
The social media data were collected from daily NAVER blog posts and Twitter posts from September 1, 2010 to June 30, 2014 using the social big-data-mining system, SOCIALmetricsTM (Daumsoft, Seoul, Korea). The SOCIALmetricsTM system contains social media data crawlers that collect posts from Twitter and NAVER blog and processes texts using state-of-the-art natural language-processing and text-mining technologies. The Twitter crawler utilizes a streaming application programmer’s interface (http://dev.twitter.com/docs/streaming-apis) for data collection using so-called “track keywords.” We used a few thousand empirically selected and tuned track keywords that could maximize the coverage of the crawler operating in near-real-time fashion. We estimated that the daily coverage of the Twitter crawler was over 80%. The collected posts were fed into a spam-filtering module that checks for posts containing spam keywords and written by known spammers. The lists of spam keywords and spammers were semi-automatically monitored and managed. The NAVER blog is a weblog service offered by the biggest portal site in South Korea (http://www.section.blog.naver.com). The NAVER blog crawler resembles general-purpose web crawlers. The big difference is that we maintain a list of active bloggers for post collection. The active blogger list is automatically expanded. The estimated coverage of the NAVER blog crawler is also over 80%. We applied an extensive spam-filtering process similar to that of the Twitter crawler on the collected blog posts.
The authors and the data-mining company conducted the search according to Twitter’s and the blog-post website’s terms and conditions of use. All Twitter and NAVER blog posts were publicly available and the information collected did not reveal the identity of the social media users; thus, user confidentiality was preserved.
Epidemiological Surveillance Data
Traditional surveillance systems rely on formal medical and/or public health networks involving professionals such as physicians, laboratory staff, epidemiologists, and other health-care workers.Reference Milinovich, Williams and Clements 18 In general, official data for national influenza surveillance includes clinical data and virological data. We used clinical data in this study. Data were obtained from the Korea Centers for Disease Control and Prevention (KCDC), which routinely collects epidemiological data. The KCDC publishes statistical information from the national influenza surveillance system on a weekly basis, typically with a 1-week reporting lag. The clinical data were the rates of physician visits for ILI between September 1, 2010 and June 30, 2014. Data were obtained from the weekly reports on influenza surveillance from the KCDC infectious disease web statistics system (http://www.is.cdc.go.kr/nstat/index.jsp). The epidemiological surveillance data we obtained were publicly available and did not identify individual subjects.
Initial Keyword Selection
Keywords were obtained using the following steps.
Identification of Specific Keywords or Terms Associated With Influenza
Keywords were words associated with the presence of influenza, which appeared frequently with the word “influenza” in social media posts. Our database comprised words most likely to be associated with dokgam (the Korean word for influenza) and inpeulruenja (the Korean transliteration of the English word “influenza”) in the accumulated Twitter and NAVER blog posts over a 43-month tracking period (September 1, 2010 to March 31, 2014). Because the data were based on keyword priority according to the number of accumulated posts for each week, we combined the keyword data and converted them into time-series variables between September 1, 2010 and March 31, 2014. In this way, we identified 2065 associated keywords (AKW).
Keyword Filtering
Of the 2065 keywords associated with influenza, several were not related to influenza seasons; thus, it was necessary to filter the keywords. First, we excluded keywords that occurred infrequently during the influenza season and those that showed non-sequential patterns in the time series throughout the tracking period. Then, we selected keywords whose correlation with the epidemiology surveillance data was at least 0.4 with reference to an earlier study.Reference Yuan, Nsoesie and Lv 4 After filtering, 32 of the 2065 keywords associated with the word “influenza” remained.
Classifying Complex and Simple Keywords
Keywords that remained after filtering were classified as “complex keywords,” which represent a combination of the core keyword (CKW) and 32 AKW. The CKW was the synonym for influenza commonly used in Korea to describe influenza (dokgam, inpeulruenja, peulru [Korean transliteration of terms for flu], influenza [in English], and flu [in English]). In addition, of the 32 AKW, keywords related to flu symptoms and the 5 synonyms of influenza were classified as “simple keywords.” Thus, overall, we obtained 32 complex and 17 simple keywords associated with influenza epidemics.
Generating the Keyword Time Series
The keyword data were presented as a time series. On the basis of the 49 seed keywords, we generated a keyword time series—ie, the weekly volume of tweets and blog posts mentioning the keywords—which were obtained from Twitter and blog posts independently. Because the social media keyword data were available on a daily basis, whereas the KCDC official case-count data were reported weekly, we converted the keyword data to weekly counts for the analysis. Several extraction conditions were applied to generate the keyword time series according to keyword type.
Extraction Conditions for Complex Keywords (CKW+AKW)
First, dokgam, inpeulruenja (influenza), and the English words “influenza” and “flu” were treated as synonyms. A post with at least one of these synonyms was considered to contain the CKW. The volume of complex keywords was derived from the number of posts in which CKW and AKW occurred concurrently on a daily basis. Second, we excluded posts with words related to influenza vaccination to maximize the possibility of detecting an influenza epidemic. As the standard inoculation period for influenza is October to December, words related to influenza vaccination frequently appeared during this time period regardless of the influenza epidemic season. Common Korean synonyms for “influenza vaccine” are dokgam jeopjong, dokgam jusa, yebang jusa, yebang jeopjong, and baeksin (Korean transliteration of the term “vaccine”). Posts with CKW and AKW that contained any of these synonyms were excluded. The Korean film “The Flu, 2013” (Korean title, Gamgi) was released on August 14, 2013 during our tracking period. To control for the influence of discourse on this film, we excluded posts containing the word younghwa (the Korean word for film) after July 1, 2013.
Extraction Conditions for Simple Keywords
For simple keywords, the time-series volume was derived from the number of posts containing AKW regardless of whether CKW appeared. The conditions for exclusion were consistent with those used for complex keywords.
Feature Selection and Model Building
We divided the data into training and validation sets. Data from January 8, 2011 to August 31, 2013 were used as the training set for modeling, and data from September 1, 2013 to June 30, 2014 were used as the validation sets to test the model. Because our objective was to develop a method for identifying indicators of an influenza epidemic using social media data, we used a model that reflected the incidence of ILI with a 1-week lag.
To identify the best indicator-feature subset, we first used the least absolute shrinkage and selection operator (Lasso) algorithm to select the best data set and features following data normalization. The primary objectives of feature selection are to avoid overfitting caused by irrelevant features, improve model performance of the indicators, and identify faster and more cost-effective indicators.Reference Guyon and Elisseeff 22 , Reference Saeys, Inza and Larrañaga 23 Lasso is useful for efficient and simple feature selection because it tends to assign 0 weights to most irrelevant or redundant features.Reference Li, Yang and Xing 24 Feature selection processing was performed on the training set using 10-fold cross validation.
We used several machine-learning techniques to construct models that detected influenza epidemics using the best features. We built the candidate models using Lasso, support vector machine (SVM), and random forest regression (RFR) using the training set based on the features we selected. To find the model having the best performance, we evaluated the root mean square error (RMSE) of the estimated values and ILI incidence using the validation set. All statistical tests were carried out using R version 3.3.1 (R Development Core Team, Auckland, New Zealand).
Ethics Statement
The Institutional Review Board of Seoul National University exempted our research from ethical review.
RESULTS
We identified 2065 keywords that frequently appeared with the word “influenza” in Twitter and blog posts, accumulated during the 43-month tracking period. From these, we created 32 complex and 17 simple keywords associated with influenza epidemics in South Korea (Table 1). The keyword time series were more consistent with the ILI trends following the application of several extraction conditions (Figure 1).

Figure 1 Comparison of Trends in Social Media and Influenza-Like Illness Data Before and After Preprocessing to Eliminate Irrelevant Information. Blog_A and Twitter_A (blue) indicate trends based on keyword frequencies per 100,000 daily Twitter and web blog posts mentioning influenza (including all synonyms). Blog_B and Twitter_B (red) indicate trends after the elimination of noise created by irrelevant information from Blog_A and Twitter_A. The use of several extract conditions to remove irrelevant information smoothed the keyword time series and increased the correlation with ILI data. ILI, influenza-like illness.
Table 1 Keywords Associated with an Influenza Epidemic
Abbreviations: CKW, core keyword; AKW, associated keyword.
a CKW, “influenza” and synonym of the word “influenza” commonly used by Koreans.
The optimal data set was chosen by repeating the experiment 10 times in Lasso (Figure S1 in the online data supplement), and 147 variables were ultimately generated for analysis. The results of the feature selection processing are shown in Figure 2 and Table 2. Of the 147 variables, 15 principle features had the minimum λ value in the Lasso algorithm (Figure 2). The best features for influenza surveillance were derived using 5 variables from the Twitter or blog data sources and from a combination of both (Table 2).
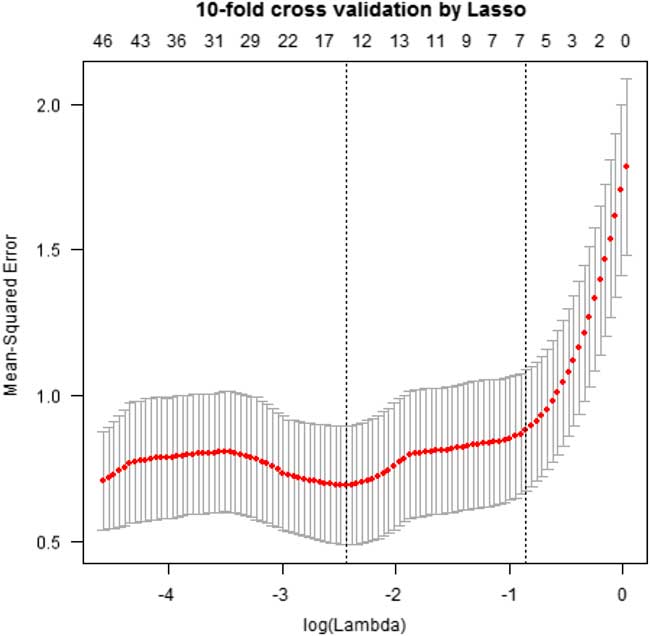
Figure 2 Optimal Feature Selection. This figure shows the results of feature selection processing. Of the 147 variables identified, 15 best features were chosen by repeating random sampling 10 times using the Lasso method.
Table 2 Best Features for Model Building

Abbreviations: 10CV, 10-fold cross validation; lasso, least absolute shrinkage and selection operator; coef, coefficient; CKW, core keyword.
a CKW, “influenza” and synonym of the word “influenza” commonly used by Koreans.
We compared the performance of candidate models using the validation set of KCDC surveillance data to detect the next observation. As a result, the SVM model (cost=2.7; γ=0.0002) performed well, having a minimum RMSE and a correlation between estimated values and observed cases of 0.92 (Figure 3). The RFR and Lasso models did not perform better than the SVM model (see Figures S2 and S3).

Figure 3 Detection and Error Based on the Support Vector Machine (SVM) Model. This figure shows the performance of the SVM model using the validation set of Korea Centers for Disease Control and Prevention surveillance data to detect the next observation. The SVM model (cost=2.7; γ=0.0002) performed well, the model estimates were highly correlated with the observed influenza-like illness (ILI) (0.92, P<0.001). Note: Log Error=log((Obs−Exp)2/abs(Exp)). RMSE, root mean square error.
DISCUSSION
We have developed an advanced method to enable detection of influenza epidemics through preprocessing of social media data. The best indicative features for detecting influenza epidemics in Korea included 15 keywords derived from Twitter and web blog posts. The model estimates based on best features were highly correlated with the incidence of influenza.
Our findings contribute to growing evidence suggesting that social media data are useful for detection of influenza outbreaks. Further, our approach has several significant implications in terms of methodology for influenza surveillance using social media data. First, to our knowledge, our study is the first to use data from both Twitter and web blogs for influenza surveillance. Most investigations of social media data intending to monitor influenza epidemics have examined either tweetsReference Broniatowski, Paul and Dredze 7 , Reference Santos and Matos 8 , Reference Paul, Dredze and Broniatowski 11 - Reference Pawelek, Oeldorf-Hirsch and Rong 14 or blog posts.Reference Corley, Cook, Mikler and Singh 9 , Reference Gu, Chen and Zhu 10 However, we found that the best features were evenly distributed between Twitter and blog posts. It may be that consideration of pertinent social media data will be required for influenza surveillance studies in the future. Second, our findings suggest that the rate of Twitter use, amount of traffic, and number of Twitter users in the population would not matter in developing the influenza surveillance model. Twitter is not widely used by Koreans; yet, a considerable body for our model was derived from Twitter or a combination of Twitter. Our study examined social media text collected from SNS in contrast with traditional surveillance studies based on individuals. The text content included information about family, friends, and the communities of social media users, as well as about the users themselves. Therefore, the aggregated texts including health-related conversations on the Internet may be representative of a large segment of the population. Thus, our findings provide a counterargument to the contention that Internet-driven data such as social media and search queries cannot be used to represent an entire population. Third, although the weight of various keywords is likely to deviate from one influenza season to another,Reference Yuan, Nsoesie and Lv 4 , Reference Lazer, Kennedy and King 16 our model based on a combination of best features from Twitter and blog posts performed well for the recent influenza season. Whether our indicators will be consistent in the future remains to be seen. However, we are reasonably confident that our approach to keyword selection through the preprocessing of social media data (ie, analyzing associations, generating keyword time series using several extraction conditions, and selecting optimal features from a supervised learning framework) can be used widely. Furthermore, our approach offers clues for understanding such indicators and their weight, which may be changeable over time. Online surveillance detects diseases by tracking the behavior of individuals through massive amounts of aggregated data on the Internet; however, individual behavior is constantly changing, and thus keywords change. Our approach can help reflect time-varying keywords as indicators.
Fourth, although our model was created to detect the incidence of influenza throughout the year including high- and low-incidence seasons, we found a strong correlation between the influenza surveillance data reported by the KCDC and our estimates using a model that included 15 keywords (r=0.92; P<0.001). Our estimates were more highly correlated with KCDC data than were those reported in previous studies. In the majority of previous studies, the correlations between prediction and observation were not as high as those reported for approaches based on search engine queries.Reference Milinovich, Williams and Clements 18 Although a recent investigation of a filtering algorithm developed to estimate an influenza epidemic using Twitter revealed a strong correlation between Twitter and US CDC surveillance data (r=0.93), the authors studied only the specific influenza season as defined by the US CDC.Reference Broniatowski, Paul and Dredze 7 The GFT was not able to provide an accurate prediction of non-seasonal influenza outbreaks during the 2009 influenza virus A/H1N1 pandemic. The original GFT model was not correlated with the US Outpatient Influenza-like Illness Surveillance Network data (r=0.290),Reference Cook, Conrad and Fowlkes 25 suggesting that the ability of a model to detect non-seasonal influenza outbreaks is necessary. Finally, our best features included 6 symptom-related and 4 health-care-related keywords, 2 nomenclature terms, and 3 other keywords. Our model was derived from contextual keywords such as “good,” “child,” “be sick,” “hospitalization,” and “patient” that are not commonly used in search engine queries. This finding suggests that social media incorporates a wide range of contextual health-related information not included in search engine queries that are submitted to gather information.
Most researchers agree that social media constitutes a highly informative data source for real-time monitoring of emerging epidemics. It is evident that approaches using these novel data sources for influenza surveillance are more immediate and efficient in terms of time and cost than traditional surveillance approaches, although it is difficult to conclude that they can or should replace traditional surveillance systems. Looking ahead to the future, there is no doubt that big data from social media might play a foundational role with respect to information sources regarding public health. Accordingly, online influenza surveillance based on social media data could potentially complement and augment traditional surveillance systems. In particular, it can result in the rapid and efficient detection of the occurrence of diseases and their proliferation, thereby allowing for a better identification of diseases and initiation of disease preventive measures. However, the conversion of these informative data into a novel and reliable body of information requires sophisticated methods. Noise from irrelevant information, uncertainty about the representativeness of the social media users, changing rates of Internet use over time, and changes of the social impact of the disease are several examples of the limitations of social media as a surveillance tool. Our study has several of these limitations; thus, parameters or optimal features of our model may need to be updated over time to consider these changes; nevertheless, the proposed method is useful for the preliminary detection of early signs of an influenza outbreak. Further, the basic principles of our approach can be applied to other countries, languages, infectious diseases, and types of social media.
Acknowledgments
This work was supported by the National Research Foundation of Korea (NRF) grant funded by the Korea government (No. NRF-21B20171213037, 2017R1C1B1004892).
Supplementary Material
To view supplementary material for this article, please visit https://doi.org/10.1017/dmp.2017.84


