


Introduction
Metamaterials are artificially designed materials whose properties at a certain range of frequencies differ from that of naturally existing materials. These properties are negative permittivity and permeability, backward wave propagation, inverse Doppler effect, Vavilov Cerenkov effect [Reference Veselago1] to name a few. Numerous applications have been reported in the literature exploiting these exotic properties of metamaterials. Cloaking [Reference Pendry2], perfect tunneling of electromagnetic waves, perfect lenses [Reference Pendry3–Reference Smith5], flat lenses, and metamaterial antennas are some of its promising applications. Metamaterial absorbers are a popular application of metamaterials and are classified as broadband metamaterial absorbers and resonant metamaterial absorbers. The two categories of absorbers can be differentiated by the bandwidth they offer. The resonant metamaterial absorbers are narrowband absorbers which may exhibit either single resonant or multi resonant characteristics. The practical use of resonant metamaterial absorbers is limited for EM absorbing applications due to its narrowband characteristics and polarization sensitiveness. On the other hand, the broadband metamaterial absorbers exhibit absorption characteristics over a wide range of frequencies. As far as metamaterial absorber-based sensors are concerned, the resonant structures are found to be suitable as they offer single and multiple resonant frequencies with narrow bandwidths. Narrow bandwidths depict high selectivity and quality factor [Reference Saadeldin, Hameed, Elkaramany and Obayya6], desirable for sensing applications. Some of the other applications of resonant metamaterials are cloaking, bending light, and wavefront shaping [Reference Min and Huang7]. One of the exciting applications of metamaterials is in the field of electromagnetic sensors which is based on the absorbing characteristic of metamaterials over a certain frequency band. The special features of these sensors are that they are of simple design, are easy to fabricate, are of low cost, offer high sensitivity and quality factor, are contactless, and are reliable. Incorporating simple modifications in the overall structure, the metamaterial absorbers could be used to sense temperature, pressure, and humidity; could be used to identify substances and to determine their electrical characteristics such as permittivity; could be used to sense biomolecules and gases; could be used to find the quality of agricultural products.
The basic working principle of these sensors is the interaction of the materials under test (MUT) with the confined electromagnetic waves in the metamaterial absorber at the resonant frequencies. Split-ring resonators (SRR) are the most commonly used metamaterial structures apart from other metamaterial structures. One of the criteria for the structures to have metamaterial properties is that their dimensions must be significantly lesser than the wavelength of the electromagnetic wave it is interacting with. Edge-coupled SRR (Fig. 1(a)), broadside-coupled split-ring resonators (BC-SRR) (Fig. 1(b)), complementary symmetry split-ring resonators (CSRR) (Fig. 2(b)), square split-ring resonators are some of the other popular metamaterial structures. Various techniques have been used for the interaction of the MUT with the resonant structures. Meandering channels in the substrates, air-gap between the substrate and the ground plane, passing the fluid through holes in the structures are few of the techniques used for the interaction of MUT with the resonating structure.

Fig. 1. (a) Edge-coupled SRR, (b) broadside-coupled SRR. Marqués et al. (2003) [Reference Marqués, Mesa, Martel and Medina12].

Fig. 2. (a) SRR, (b) complementary SRR. Salim et al. (2018) [Reference Salim and Lim13].
One of the desirable properties of the metamaterial sensors is that it should be non-responsive to the substances which are not intended to be tested; this is referred to as selectivity. High selectivity, sensitivity, and quality factor are the most desirable properties of a sensor. The sensitivity of a sensor is defined as the ratio of the output signal to the property or the attribute being measured. In a metamaterial sensor, the change in the resonant frequency resulting from the interaction with the MUT defines the sensitivity. A larger shift in the resonant frequency results in higher sensitivity. Depending upon the sensor application, the shift in resonant frequency occurs as a result of variation of permittivity of the analyte medium [Reference Huang, Xia, Xie, Guo, Li and Xie8], change of over-layer thickness [Reference Islam, Rahman, Samsuzzaman, Mansor and Misran9], the variation of refractive index (RI) [Reference Saadeldin, Hameed, Elkaramany and Obayya6], or any other physical parameter such as temperature, density, moisture [Reference Bakır, Karaaslan, Unal, Akgol and Sabah10] of the MUT that alters the dielectric property of the substrate or the region in close proximity of the resonator. Another desirable property is the quality factor. When the quality factor is high, the absorption bandwidth is narrow, which leads to high-frequency selectivity [Reference Saadeldin, Hameed, Elkaramany and Obayya6]. The figure of merit of the sensor is defined as a product of sensitivity and the resonance quality factor [Reference Saadeldin, Hameed, Elkaramany and Obayya6, Reference Cong, Tan, Yahiaoui, Yan, Zhang and Singh11]. High absorption and localization of electromagnetic fields near the structure give rise to high sensitivity.
Applications and sensing principle
The sensors discussed in this study are confined to metamaterial structures that resonate at a particular frequency, called the resonance frequency. The resonance frequency is decided by the dimensions and topology of the metamaterial structure. The structure is excited by an electromagnetic signal at the resonance frequency. When the MUT interacts with the structure electromagnetically, a shift in the resonance frequency occurs. The greater the shift, the higher is the sensitivity of the sensor. Depending upon the application, the MUT interacts with the resonating structure differently. The resonance frequency is depicted as equation (1):

where L UMS and C UMS are inductance and capacitance of the unloaded resonator, respectively.

Loading of the sensor with the MUT causes C LMS to appear in equation (1) as shown in equation (2) and shifts the resonance frequency from f 0 to f 1. The shift in the resonance frequency because of the MUT is given by equation (3).

In this study, the focus is on the sensors finding commercial applications in the field of agriculture, biosensing, identification and characterization of materials, testing adulteration and authenticity of fuels, and substances; measurement of temperature, pressure, and thickness.
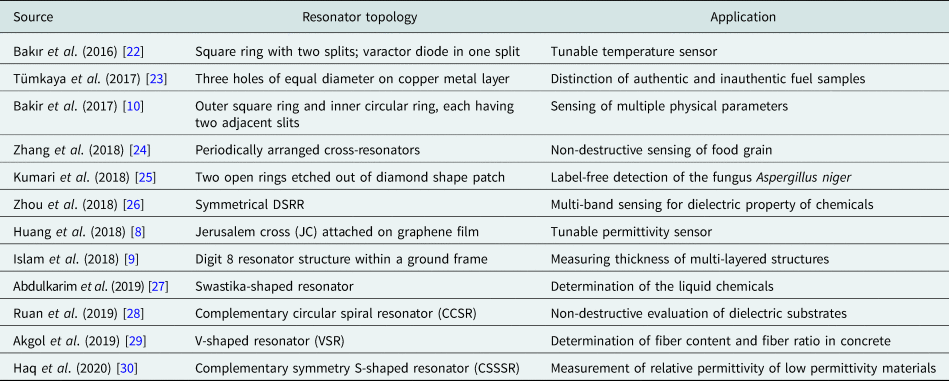
The type and topology of the resonator used in the metamaterial sensor depend upon the application. Various common shapes of the SRR are triangular, square, circular, etc. An SRR's dual is the CSRR. The CSRR is advantageous as it is a self-supporting all-metal structure that can be realized by etching the ground plane. It can be easily excited by a transmission line printed on the other side of the substrate to achieve compactness [Reference Boybay and Ramahi14]. In the case of sensors based on CSRRs, the effective area for sensing is large as the electric field is distributed throughout the ground plane and over the center etched ring area. For conventional SRRs, most of the electric field is localized only in the split region; therefore, the interaction with the MUT is less. Since CSRRs are realized by removing concentric rings from a conductive surface, producing slots, their sensitivity to the permittivity of the medium is larger as compared to the conventional SRRs (more sensitive to material permeability) [Reference Boybay and Ramahi14, Reference Albishi, El Badawe, Nayyeri and Ramahi15]. This makes the sensors based on CSRRs more suitable for sensing applications as different materials show a different response to electric signals depending upon their permittivity. The electrical size of BC-SRR is much smaller than the EC-SRR [Reference Marqués, Mesa, Martel and Medina12] and the region between the plane of SRRs is used as a sensing medium [Reference Ekmekci and Turhan-Sayan16]. When the transmission line is used for excitation, the square SRR achieves better coupling as the edge of the SRR runs parallel with the line [Reference Withayachumnankul, Jaruwongrungsee, Fumeaux and Abbott17]. Rectangular SRRs and CSRRs are simple structures that offer high sensitivity in various sensing applications [Reference Vivek, Shambavi and Alex18, Reference Withayachumnankul, Jaruwongrungsee, Tuantranont, Fumeaux and Abbott19]. In [Reference He, Hao, Yan, Wu and Jiang20], it is observed that the asymmetric SRRs produce greater confinement of electric fields in the splits as compared to symmetrical SRRs, thus producing a greater shift in resonant frequency. The double-sided split-ring resonator (DSRR) is the combination of conventional SRR, EC-SRR, and the BC-SRR. The electrical size of a resonator is proportional to the resonant frequency and dimension of the resonator [Reference Ekmekci and Turhan-Sayan21]. As investigated in [Reference Ekmekci and Turhan-Sayan21], it is found that among the three resonators, the DSRR achieves the lowest resonant frequency for the same size of the unit cell of the three resonators. Moreover, the increase in the number of degrees of freedom in DSSR increases its sensitiveness as the resonant frequency and bandwidth of the DSRR are now sensitive to the planar separation of resonator rings and also the substrate thickness. This increases its sensitivity in comparison to conventional SRR and BC-SRRs (Table 1).
Table 1. Resonator topologies and their applications in different sensors
The current is induced in the metal loop of the resonator upon excitation by a time-varying magnetic field along its axis [Reference Saha and Siddiqui31]. The inductance is created by the current carrying metal loop of the SRR and the split forms the capacitance. Since the value of inductance and capacitance depends upon the geometry of the SRR, the resonant frequency changes as the dimensions of SRR changes (equation (1)). In an EC-SRR, there is a coupling between the inner and outer rings and the equivalent series capacitance of the two halves of the ring produces the total capacitance [Reference Saha and Siddiqui31]. The total inductance is the inductance of the metal rings. Loading the resonator with the MUT changes the dielectric values around the region between the rings and the splits, giving rise to the capacitance which changes the resonant frequency.
Metamaterials operating at terahertz frequencies can be synthesized using photolithography [Reference Walia, Shah, Gutruf, Nili, Chowdhury, Withayachumnankul, Bhaskaran and Sriram32]. Electron beam lithography is used to realize nano-sized geometries, even though it is a slow process, it facilitates very high-resolution metamaterial patterns [Reference Walia, Shah, Gutruf, Nili, Chowdhury, Withayachumnankul, Bhaskaran and Sriram32]. Inkjet printing not only provides a cost-effective solution but is also environment friendly and reduces the fabrication time to a great extent [Reference Salim and Lim13, Reference Kim, Lee and Lim33, Reference Choi, Eom, Tentzeris and Lim34]. Now with the help of microfluidic technology, microfluid channels are incorporated in sensors to identify and characterize chemicals, liquids that are precious and not present in abundance (e.g., blood), as for sensing, the microfluidic channels require only microliter of the sample to be tested [Reference Salim and Lim13, Reference Zhou, Hu, Yang, Chen, Ji, Chen, Chen, Yang and Mu26, Reference Kim, Lee and Lim33]. In [Reference Zhou, Hu, Yang, Chen, Ji, Chen, Chen, Yang and Mu26], the microfluid channel is realized using craft cutting technology and used for ethanol concentration measurement. In [Reference Ebrahimi, Withayachumnankul, Al-Sarawi and Abbott35], for dielectric characterization of liquids, a square CSRR with a microfluidic channel is used. In [Reference Jaruwongrungsee, Waiwijit, Withayachumnankul, Maturos, Phokaratkul, Tuantranont, Wlodarski, Martucci and Wisitsoraat36], a biosensor is proposed which uses SRR and a microfluidic channel for real-time detection of immunoglobulin G. For early detection of cancer biomarker, [Reference Geng, Zhang, Fan, Lv and Chen37] utilizes polydimethylsiloxane (PDMS) microfluidic channels and SRRs.
Agriculture and biosensing
In [Reference Sethi, Palai and Sarkar38], a 2D photonic structure is proposed to accurately sense the blood glucose level. In the structure, 3 × 3 air holes are etched to be infiltrated by blood with different glucose levels. The measurements are carried out with an input signal of 2 GHz frequency. Absorption and reflection (S 11) of the input signal are calculated and through these values, the permittivity corresponding to the glucose concentration is determined. An avalanche photodetector is used to detect the output power from the structure for different blood samples containing different concentrations of glucose. The variance in the output power resembles different blood samples.
Another application of metamaterial absorber is found in sensing the RI of the surrounding medium of the metamaterial structure [Reference Saadeldin, Hameed, Elkaramany and Obayya6]. The structure is composed of three layers comprising of the upper SRR gold layer and another gold layer at the bottom. These two layers are separated by dielectric Teflon having a RI of 1.45. The resonant frequency of the structure is in the THz range. An analyte layer is coated on top of the structure whose thickness is fixed (1 μm) but its RI is changed (1.0–1.3). As the RI of the analyte layer changes, there is a corresponding resonance frequency shift. As reported in the paper, the majority of the biomedical samples are having a RI close to 1.3; therefore, the proposed model could act as biosensors. The structure offers a high-quality factor of 22.05 and high sensitivity of 300 GHz/RIU for RI change of the analyte layer.
For non-destructive and non-contact sensing of food grain quality, [Reference Zhang, Zhao, Cao and Mao24] proposes a metamaterial absorber comprising cross-resonators arranged over an ultrathin substrate in a periodic manner. The resonant frequency of the resonator changes as the stale rice's mass fraction is increased in the blend of stale rice and fresh rice. A technique to determine the variety of grains according to the resonant frequency of the grain sample used is also proposed. Here the food grain sample acts as a dielectric, the other two layers being the cross-resonator (build on FR4 substrate) and the metal ground plane. The absorber's unit cell consists of these three layers as shown in Figs 3(a); 3(b), and 3(c) depict the reflection characteristics for different fractions and for different varieties of samples, respectively.

Fig. 3. (a) Unit-cell structure of the sensor, (b) reflection characteristics for stale rice's different mass fractions in rice samples, (c) reflection characteristics for different varieties of rice samples filled in the sensor. Zhang et al. (2018) [Reference Zhang, Zhao, Cao and Mao24].
In the experimental setup, these layers are packaged in a polymethyl methacrylate box. The top absorber layer and the bottom metal plate form two interfaces with the middle dielectric layer building a cavity model where multiple forward and backward reflections take place. At the resonant frequency, destructive interference of these multiple reflected beams takes place resulting in a strong absorption. The resonant frequency is inversely proportional to the rice sample's dielectric constant.
Label-free biosensing does not require labels such as enzymes and radioactive molecules attached to the target biomolecule for facilitating measurements. Label-free biosensing exploits the physical properties of biomolecules such as dielectric constants, RI, weight, and size to sense them. A microwave sensor for label-free detection of the fungus Aspergillus niger which causes food contamination and spoilage is proposed in [Reference Kumari, Patel and Yadav25]. The fungus is also used for the synthesis of organic acids and affects human health too. A slow-wave effect is created because of the negative epsilon of the structure build on an FR4 substrate. This causes the electric fields to localize in a specific area and the interaction of electric fields with the biomolecular layer increases. The structure consists of two open rings etched out of a diamond shape patch on the FR4 substrate as shown in Fig. 4(a). The inner ring confines the electric fields near the gap and edges, and the outer ring inhibits the input RF signal. The RF signal is supplied by a voltage-controlled oscillator through a 10 dB coupler. The unit cell is excited by the 50 ohm transmission line. The output signal of the sensor is detected by the RF power detector which converts the sensor signal into an appropriate DC level as shown in Fig. 4(b). The values of S 11 and S 21 are used to find out the values of permittivity and permeability. A dry slide containing the fungus is placed over the sensor above the complimentary rings. The fringing fields in the air above the rings get altered, and as a result, the resonant frequency deviates. The sensor is characterized by the resonant frequency of the structure with and without the glass slide containing the fungus A. niger. The measured power from the power detector changes when the slide containing fungus is placed over the sensor.

Fig. 4. (a) Epsilon negative fabricated sensor, (b) system configuration for converting the RF response of the sensor in to equivalent DC signal. Kumari et al. (2018) [Reference Kumari, Patel and Yadav25].
Sensing adulteration and authenticity of materials
Another promising application of the metamaterial sensor is in the field of material sensing for adulteration detection. Adulteration indicates the deterioration of the quality of a product by adding some inferior substances for earning more profit. Adulteration in food is hazardous to health. In [Reference Tiwari, Singh and Akhtar39], a single port structure is used to determine adulteration in edible oils. Two CSRRs are etched on top of a flared transmission line. Being a single port compact structure, it can be easily used to measure the shift in resonant frequency by simply immersing it in the test liquid. The structure is open at one end generating standing waves in the transmission line. Strong electric field localization is observed near the top CSRR end, offering high sensitivity. Due to high sensitivity, closely spaced dielectrics could be identified. The proposed sensor could be used to check the quality of other liquids as well.
To distinguish between authentic and inauthentic fuel samples, [Reference Tümkaya, Dinçer, Karaaslan and Sabah23] proposes a sensor in the microwave frequency region. Authenticity is a measure of originality/purity which confirms the confidence in any product, as it is claimed to be. Authentic and inauthentic fuels differ in terms of loss tangent and dielectric values. In the study, the electromagnetic properties of authentic and inauthentic fuel samples are depicted experimentally. The resonant frequencies are different for authentic and inauthentic fuel samples as the resonant frequency is sensitive to the dielectric property of the fuels. The transmission properties of the proposed design are susceptible to the electromagnetic property of the fuel sample being tested as the resonance frequency deviates upon interacting with it. The structure is composed of three holes of equal diameter on the copper metal on an FR4 substrate as shown in Fig. 5(a). The diameter of the holes could be changed to change the resonant frequency of the structure. In the substrate, behind the holes, there is a cavity in which the fuel to be tested is filled. The dielectric constant and loss tangent values are measured with the help of VNA and dielectric probes, for both authentic and inauthentic fuel samples. These values are used to design the proposed sensor. For the measurements, the sensor filled with the fuel is placed in a waveguide. A vector network analyzer (VNA) is used for the signal generation and S-parameter measurement. The values of S 22 and resonant frequency are different for authentic and inauthentic fuel samples as shown in Fig. 5(b). A difference of 13 dB in S 22 and 16 MHz deviation in resonant frequency is observed for authentic and inauthentic samples, which could be used to detect the fuel sample. Increasing the radius of the holes reduces the resonant frequency and the reflection coefficient decreases to lower values with the increasing hole radius.

Fig. 5. (a) Sensor structure, (b) authentic and inauthentic diesel sample's measured S 22 (dB) values. Tümkaya et al. (2017) [Reference Tümkaya, Dinçer, Karaaslan and Sabah23].
Identification of materials and their dielectric properties, concentration measurement
To detect the concentration of ethanol in [Reference Kim, Lee and Lim33], a flexible metamaterial absorber is proposed. Here the metasurface is a split-ring cross-resonator (SRCR) which is inkjet printed through silver nanoparticle ink on a photo paper. Since the substrate is a paper, it is cheap and flexible but due to losses, the quality factor is less which might be improved by using PCB substrates and chemical etching. The unit cell is composed of three layers. PDMS is used to build the top layer which acts as a microfluidic channel, the middle layer is inkjet printed SRCR pattern on a photo paper and an additional PDMS layer is added below it to minimize transmission, the bottom layer is a copper sheet. The 15 × 15 matrix of unit cells is used to test the efficacy of the sensor. The microfluidic channel also has flexibility as it is realized on a PDMS substrate, using laser etching. By measuring the shift in the resonant frequency, the absorber can be used to find ethanol concentration. Ethanol with different concentrations flowing in the microfluidic channel changes the effective dielectric constant, and hence the resonant frequency of the SRCR. The S parameters are measured using a VNA and two horn antennas placed at a distance of 1 m from the sample. The absorber is used as a wireless sensor as the frequency response is measured wirelessly by using the antennas. The sensor sensitivity is 7.65 MHz/percentage. The resonant frequency decreases from 10.04 to 8.95 GHz as the concentration of ethanol is varied from 5 to 100%.
For the determination of chemical liquids and their proportions in water, [Reference Abdulkarim, Deng, Altıntaş, Ünal and Karaaslan27] proposes a swastika-shaped resonator. The resonator structure is designed on top of an FR4 substrate, below which there is an air gap, as shown in Fig. 6(a), and the bottom most layer is a copper plate whose thickness is greater than skin depth to prevent any transmission. The chemical liquids are placed in the air gap for sensing applications. Two resonance peaks are observed for the structure, one at 10.12 GHz and another at 10.5 GHz. The absorption values for the two resonant frequencies are different for different chemicals and these values also change for different ratios of the same sample in water. The absorption values for different samples correspond to their electrical properties as shown in Fig. 6(b). The relative permittivity and the loss tangents for different samples are found out by different absorption values. The frequency range of the measurements is 8–12 GHz. The structure offers high sensitivity to the liquid samples taken.

Fig. 6. (a) Structure of the proposed sensor, (b) absorption curves for different chemical liquids. Abdulkarim et al. (2019) [Reference Abdulkarim, Deng, Altıntaş, Ünal and Karaaslan27].
For determining dielectric properties of chemicals, [Reference Zhou, Hu, Yang, Chen, Ji, Chen, Chen, Yang and Mu26] proposes a metamaterial multiband sensor. The reliability of the measurement is limited if a single resonant frequency is used for measurements as different chemicals could give the same shift in the resonant frequency which makes their identification difficult. Using two or multiple resonant frequency structures, reliability of the measurements is increased and the system becomes efficient as more than one chemical could be sensed at a time. In the proposed technique, at close vicinity and opposite sides of the microstrip transmission line, two pairs of split-ring resonators having double splits (DSRR) are placed which are different in size and offer different resonant frequencies as shown in Fig. 7(a). Microfluidic channels are placed below each pair of DSRR and the chemical to be sensed flows through this channel as shown in Fig. 7(b). Beneath the substrate (Rogers 40003c, thickness 0.203 mm) a metal plate is added which acts as a ground plane and confines the electric fields. For resonances to occur, the microstrip line is excited with a microwave signal. Chemical fluids to be sensed are pumped into the microfluidic channels. The complex permittivity of the chemical fluids is determined indirectly by the resonant frequency shifts, as depicted in Figs 7(c) and 7(d). A pair of symmetrical DSRRs give a high concentration of electromagnetic fields in their vicinity and thus increase the sensitivity of the sensor. Sensitivity is also enhanced by using substrates having lower permittivity. To investigate the sensor performance, water–ethanol mixtures of different concentrations are selected. Practicality, efficiency, and reliability could be increased by adding resonators of different sizes. Dielectric properties of chemicals are used for their identification. The quality factor and the resonant frequency are a function of the permittivity of the sample to be tested. An empirical dielectric model is developed for the determination of complex permittivity from quality factor and resonant frequency shifts. The experimental setup is constituted by the sensor, a pump, and a VNA. The MUT is pumped into the microfluidic channel which causes the resonant frequency to shift as it alters the permittivity around the resonator. A VNA is used to provide the input signal to the transmission line used for excitation, through its one end and the other end is connected back to the VNA to measure the transmission (S 21). The shift in resonant frequency (S 21) is observed on the VNA. The curves in the graph of S 21(dB) versus frequency at different ethanol concentrations give “butterfly-like” shape (Fig. 7(c)), and the graph of resonant frequency versus the ethanol concentration gives the fitting curve. The fitting curve is different for distinct chemicals and could be used for their identification.

Fig. 7. (a) DSRR resonators, transmission line, and the equivalent circuit; (b) microfluid flow channels under both resonators; (c) measured values of the transmission coefficient for various concentrations of ethanol in the first channel; (d) measured values of the transmission coefficient for various concentrations of ethanol in the second channel. Zhou et al. (2018) [Reference Zhou, Hu, Yang, Chen, Ji, Chen, Chen, Yang and Mu26].
For analysis of dielectric substrates using a non-destructive technique, a metamaterial sensor is proposed in [Reference Ruan, Zhang and Ullah28]. The structure of the sensor is composed of the complementary circular spiral resonator (CCSR) etched out of a copper plate 35 μm thick. The FR4 substrate of thickness 1 mm is used to design the sensor as shown in Fig. 8(a). On one side of the substrate, there is a microstrip line for excitation, and on the other side, the CCSR is etched. By using the transcendental equation formed for the sensor, the relative permittivity of the MUTs could be obtained just by knowing the resonant frequency of the sensor with the MUT. By using CSRRs instead of SRRs, the dielectric properties of samples with bigger dimensions could be determined as the fringing electric fields in case of CSRRs are broader and it also offers higher sensitivity for sensors. The transmission coefficient S 21is measured, after placing different MUTs over the fabricated sensor as shown in Fig. 8(b), to calculate the permittivity and permeability of the MUT. The MUT interacts with the CCSR to bring about a change in the resonant frequency of the resonator. Notch depth and fundamental frequency of the proposed sensor are −16.54 dB and 2.32 GHz, respectively. Notch depth increases by increasing the number of CCSR but the resonant frequency remains unchanged. The electric fields are mostly concentrated inside the inner rings. The structure is simulated with one to four CCSRs and the maximum negative magnitude of S 21 and maximum bandwidth is achieved in the case of four CCSRs, the resonant frequency remains the same in all cases. The highest sensitivity is achieved in the case of four CCSRs. A VNA is used to measure the S 21. Air, Teflon, quartz, FR4, and silicon nitrate are used as MUTs and resonant frequencies of the fabricated sensor are measured through its interaction with each of these MUTs. The measured resonance frequency decreases with the rise in the relative permittivity of the MUT as shown in Fig. 8(d). Improved design of the sensor could be used for security applications and biosensing.

Fig. 8. (a) Sensor with four CCSR, (b) MUT placed on the bottom side, (c) sensor fabricated prototype, (d) transmission coefficient S 21 curve for different MUTs placed on the fabricated sensor. Ruan et al. (2019) [Reference Ruan, Zhang and Ullah28].
To find out the relative permittivity of low permittivity materials, [Reference Haq, Ruan, Zhang, Ullah, Fahad and He30] proposes a highly sensitive sensor operating at microwave frequency. The sensor is composed of a complementary symmetry S-shaped resonator which is excited by a microstrip line as depicted in Fig. 9(a). The resonator and the microstrip line are placed on opposite sides of an FR4 substrate of height 1.6 mm. The resonating frequency of the sensor is 15.12 GHz and is used to measure relative permittivity in the range of 2.1–3. It is noticed that higher resonating frequency leads to higher sensitivity for the sensor. The relative sensitivity offered by the sensor is 6.7% and the unloaded quality factor is 501. The resonant frequency of the structure shifts downwards as the sensor interacts with the MUT. The MUT with fixed dimensions is placed above the S-shaped resonator with an air gap of 35 μm as shown in Figs 9(b) and 9(c). The permittivity (ɛr), permeability (μ r), and loss tangent values of the MUT are used to examine the sensor's sensitivity. ɛr, μ r, and loss tangent values of MUT are varied, and shift in resonant frequencies is observed. With an increase in ɛr, the resonant frequency decreases and similar results are observed while increasing the μ r of MUT. The magnitude of the transmission coefficient S 21 decreases substantially while increasing the loss tangent value of the MUT. From the transcendental equation and the resonant frequencies of different MUTs, the relative permittivity of a particular MUT is calculated. The chosen MUTs are Rogers RT5880, HDPE Plastic, Teflon, Neltec NX9240, Glass PTFEreinf, Rubber Hard, PVC Plastic, Isola IS680-280, and Polystyrene. The sensor has different resonating frequencies for all the MUTs when placed individually over the resonator.

Fig. 9. (a) Diametric view of the sensor, (b) MUT placed over bottom side resonator, (c) MUT (glass) placed over fabricated sensor with connectors to feed the transmission line. Haq et al. (2020) [Reference Haq, Ruan, Zhang, Ullah, Fahad and He30].
Tunable sensors
Tunability in metamaterials [Reference Turpin, Bossard, Morgan, Werner and Werner40] could be achieved through circuit tuning, which involves the placement of discrete impedances at specific sites in the unit cell. Incorporation of varactor diodes in the unit cell and controlling their bias voltage is a popular mechanism for tuning the resonant frequency of resonators [Reference Bakır, Karaaslan, Dincer, Delihacioglu and Sabah22]; geometric tuning in which perturbation of unit cells is done mechanically, like changing the location or orientation of unit cell's fractions; and material tuning which involves changes in the parameter of substrate material or portion of the unit cell, like in [Reference Huang, Xia, Xie, Guo, Li and Xie8], application of external gate voltage changes the surface conductivity of the top graphene layer giving tunability to the structure.
Multiband response of the sensor upon interaction with the MUT leads to greater observations over multiple resonant frequencies, improving the accuracy of the sensor [Reference Zhao, Fan, Zhang, Keiser, Duan, Averitt and Zhang41, Reference Hanna, Bteich, Tawk, Ramadan, Dia, Asadallah, Eid, Kanj, Costantine and Eid42]. The applications requiring the tuning of the sensor over a large frequency band would involve changes in metamaterial structure, its composition, and the properties of the constituent material [Reference Turpin, Bossard, Morgan, Werner and Werner40]. This would limit the sensor's reliability due to the fabrication and design inconsistencies. The reliability of the sensor is also limited when measurements are taken with a single resonant frequency as distinct materials may produce the same deviation in resonant frequency, giving false positives [Reference Zhou, Hu, Yang, Chen, Ji, Chen, Chen, Yang and Mu26, Reference Zhao, Fan, Zhang, Keiser, Duan, Averitt and Zhang41]. The tunability of resonant frequencies over a broader range to achieve multiband response thus increases reliability and facilitates measurements with the available test setup [Reference Bakır, Karaaslan, Dincer, Delihacioglu and Sabah22].
Permittivity sensor with the added advantage of tunability is demonstrated in [Reference Huang, Xia, Xie, Guo, Li and Xie8]. Here the structure is comprised of a graphene film on top of a dielectric spacer with a dielectric constant of 3.5. A Jerusalem cross (JC) is attached in the photo-etched slot on the graphene film as shown in Fig. 10(a). The bottom layer is a gold plate, attached to the backside of the substrate. The bottom layer along with gold electrodes placed on the graphene film is used for biasing. External gate voltage applied through the electrodes changes the Fermi energy of Graphene and hence its surface conductivity. Change in surface conductivity changes the relative permittivity of the graphene layer; this gives tunability to the structure. The coupling among the JC and the graphene film gives rise to a broad absorption bandwidth of 11.7 THz. An analyte layer is placed on top of the graphene film whose thickness is fixed at 0.1 μm but its permittivity is varied from two to 10 to observe the corresponding shifts in resonant frequency as seen in Fig. 10(b). Resonance frequencies for different Fermi energies are shown in Table 2.

Fig. 10. (a) Perspective view of the proposed sensor, (b) absorption spectrum of the analyte medium having different permittivity. Huang et al. (2018) [Reference Huang, Xia, Xie, Guo, Li and Xie8].
Table 2. Sensor resonance frequencies, absorption nature, tunability, and shifts in resonance frequencies

Observation is plotted with 80% absorption frequency points and it increases linearly as the permittivity increases. The structure offers a high absorption range of 82.3–94.0 THz. The tunability of the resonant frequency is a much-desired feature in the metamaterial sensors as it increases the reliability, accuracy, and ease of measurements.
In [Reference Bakır, Karaaslan, Dincer, Delihacioglu and Sabah22], a tunable metamaterial absorber is proposed for sensing the temperature. The structure is a square ring with two splits placed over an FR4 substrate as shown in Fig. 11(a). In one of the splits, a varactor diode is placed which is reverse biased. Changing the bias voltage changes the structure's resonance frequency. The bottom layer is a metal plate that prevents any transmission of the input signal. For sensing purpose, a sensing layer is inserted between the SRR and the metal plate. As the dielectric constant is a function of temperature, when the sensing layer is exposed to any external object whose temperature is changing, the dielectric constant of the layer changes which in turn changes the resonance frequency. Thus, changes in the temperature of external objects could be sensed via shifts in the resonance frequency as depicted in Figs 11(b) and 11(c) for different applied reverse bias voltage and temperature, respectively. Resonance frequencies for different bias voltages are shown in Table 2. If a fixed frequency source is available, the SRR's resonance frequency could be tuned to that of the source through the biasing of the varactor diode. Thus, the design offers ease of measurement as it could be used with various fixed frequency sources.

Fig. 11. (a) Schematic of the sensor, (b) absorption curves at different applied reverse bias voltages, (c) simulated result showing shift in resonant frequency at different temperatures of the test sample and reverse bias voltages. Bakır et al. (2016) [Reference Bakır, Karaaslan, Dincer, Delihacioglu and Sabah22].
Multiple parameter sensing
A single metamaterial structure could be used to sense multiple parameters. In [Reference Bakır, Karaaslan, Unal, Akgol and Sabah10], a structure that could be used for sensing pressure, temperature, density, and moisture is proposed. The metamaterial structure is built on Rogerscorp Arlon DiClad 527 substrate. It has an outer resonator that is square in shape having two splits and within it, a ring resonator with two slits is placed as shown in Fig. 12(a). The splits are one beneath the other. For sensing application, a sensor layer is positioned between the substrate and the bottom layer which is again the Arlon DiClad 527 substrate. As the dielectric constant of the sensing layer changes, the resonant frequency of the structure changes. The use of two resonating structures offers two resonance peaks and high absorption, which helps in increasing the sensitivity. For pressure-sensing applications, air cushions are placed in the sensing layer. As pressure is applied, the width of this layer is altered and it changes the capacitance formed between the top and bottom substrates, changing the resonance frequency of the structure. For sensing change in temperature, marrowbone of thickness 1.6 mm is taken as a sensing layer. Marrowbone has different permittivity at different temperatures, and as its temperature changes, the resonant frequency shifts as permittivity of the sensing layer changes as depicted in Fig. 12(b). It is desirable to find out the absorptive properties of biological tissues which are a function of complex permittivity. Materials with different known density are used as a sensing layer. As the dielectric constant of these materials is different, the resonant frequency observed for the materials is different. This principle is used to sense the densities. Almond kernels having different moisture contents are placed in the sensing layer, and as their dielectric constants are different owing to different moisture proportions, they have different resonant frequencies for the structure. For moisture-sensing applications, this principle could be used.

Fig. 12. (a) Layers of the proposed sensor structure, (b) rapeseed and its absorption curve at different temperatures when the design is used as temperature sensor. Bakir et al. (2017) [Reference Bakır, Karaaslan, Unal, Akgol and Sabah10].
Another multifunctional metamaterial sensor is proposed in [Reference Ekmekci and Turhan-Sayan16]. Here the metamaterial unit cell is composed of BC-SRRs and the topology used is a DSRR. The sensing layer is inserted between the broadside-coupled resonators. The resonant frequency of the structure changes as the dielectric constant or the width of the sensing layer is varied in accordance with the environmental physical parameters such as pressure, temperature, concentration, humidity, and density. Given the same size, DSRRs offer higher sensitivity as compared to conventional SRRs. The DSRR topology is highly sensitive to the variations in substrate thickness and relative permittivity. The substrate used is Arlon AD300A for both the resonators. For application as a pressure sensor, air is filled in the sensing layer. One of the resonators slides through an axis when subject to external pressure while the other is kept fixed. This changes the thickness of the sensing medium and thus the resonant frequency shifts resembling the external pressure. For moisture-sensing application, the sensing medium is filled with sawdust, whose moisture content is to be determined. The complex permittivity of the sawdust depends upon its moisture content. As complex permittivity changes with moisture content, the resonant frequency also changes. With an increase in moisture content, the real part of complex permittivity increases and the resonant frequency decreases. Samples of silica aerogel with different densities are filled in the sensing layer to check the density sensor application. As the density of the aerogel increases, the real part of complex permittivity also increases, decreasing the resonant frequency. The complex permittivity of the aerogel is independent of frequency from 2 to 40 GHz. At a fixed salinity level, the structure is used to sense the temperature of seawater. The water samples whose temperature is to be determined are filled in the sensing layer. The complex permittivity of the sample is a function of temperature and salinity as shown by the Debye function. As the temperature of the sample increases, the real part of complex permittivity increases, and resonant frequency decreases. An average sensitivity of 7.9 MHz per degree change in temperature is observed.
Sensors for determining construction materials and thickness measurement
Another application of a metamaterial sensor is found for measuring the thickness of multi-layered structures. In [Reference Islam, Rahman, Samsuzzaman, Mansor and Misran9], a unit cell with excitation by a microstrip line in the bottom plane and a resonator (digit-8 in shape) within a ground metal frame on the opposite side of the substrate is designed to sense the thickness of overlayers placed on top of the structure as shown in Figs 13(a) and 13(b). Here FR4 and Rogers RO4350 are used as overlayers. As the thickness of the overlayers is increased, the resonant frequency shifts downwards as depicted in Fig. 13(c). The structure offers good sensitivity.
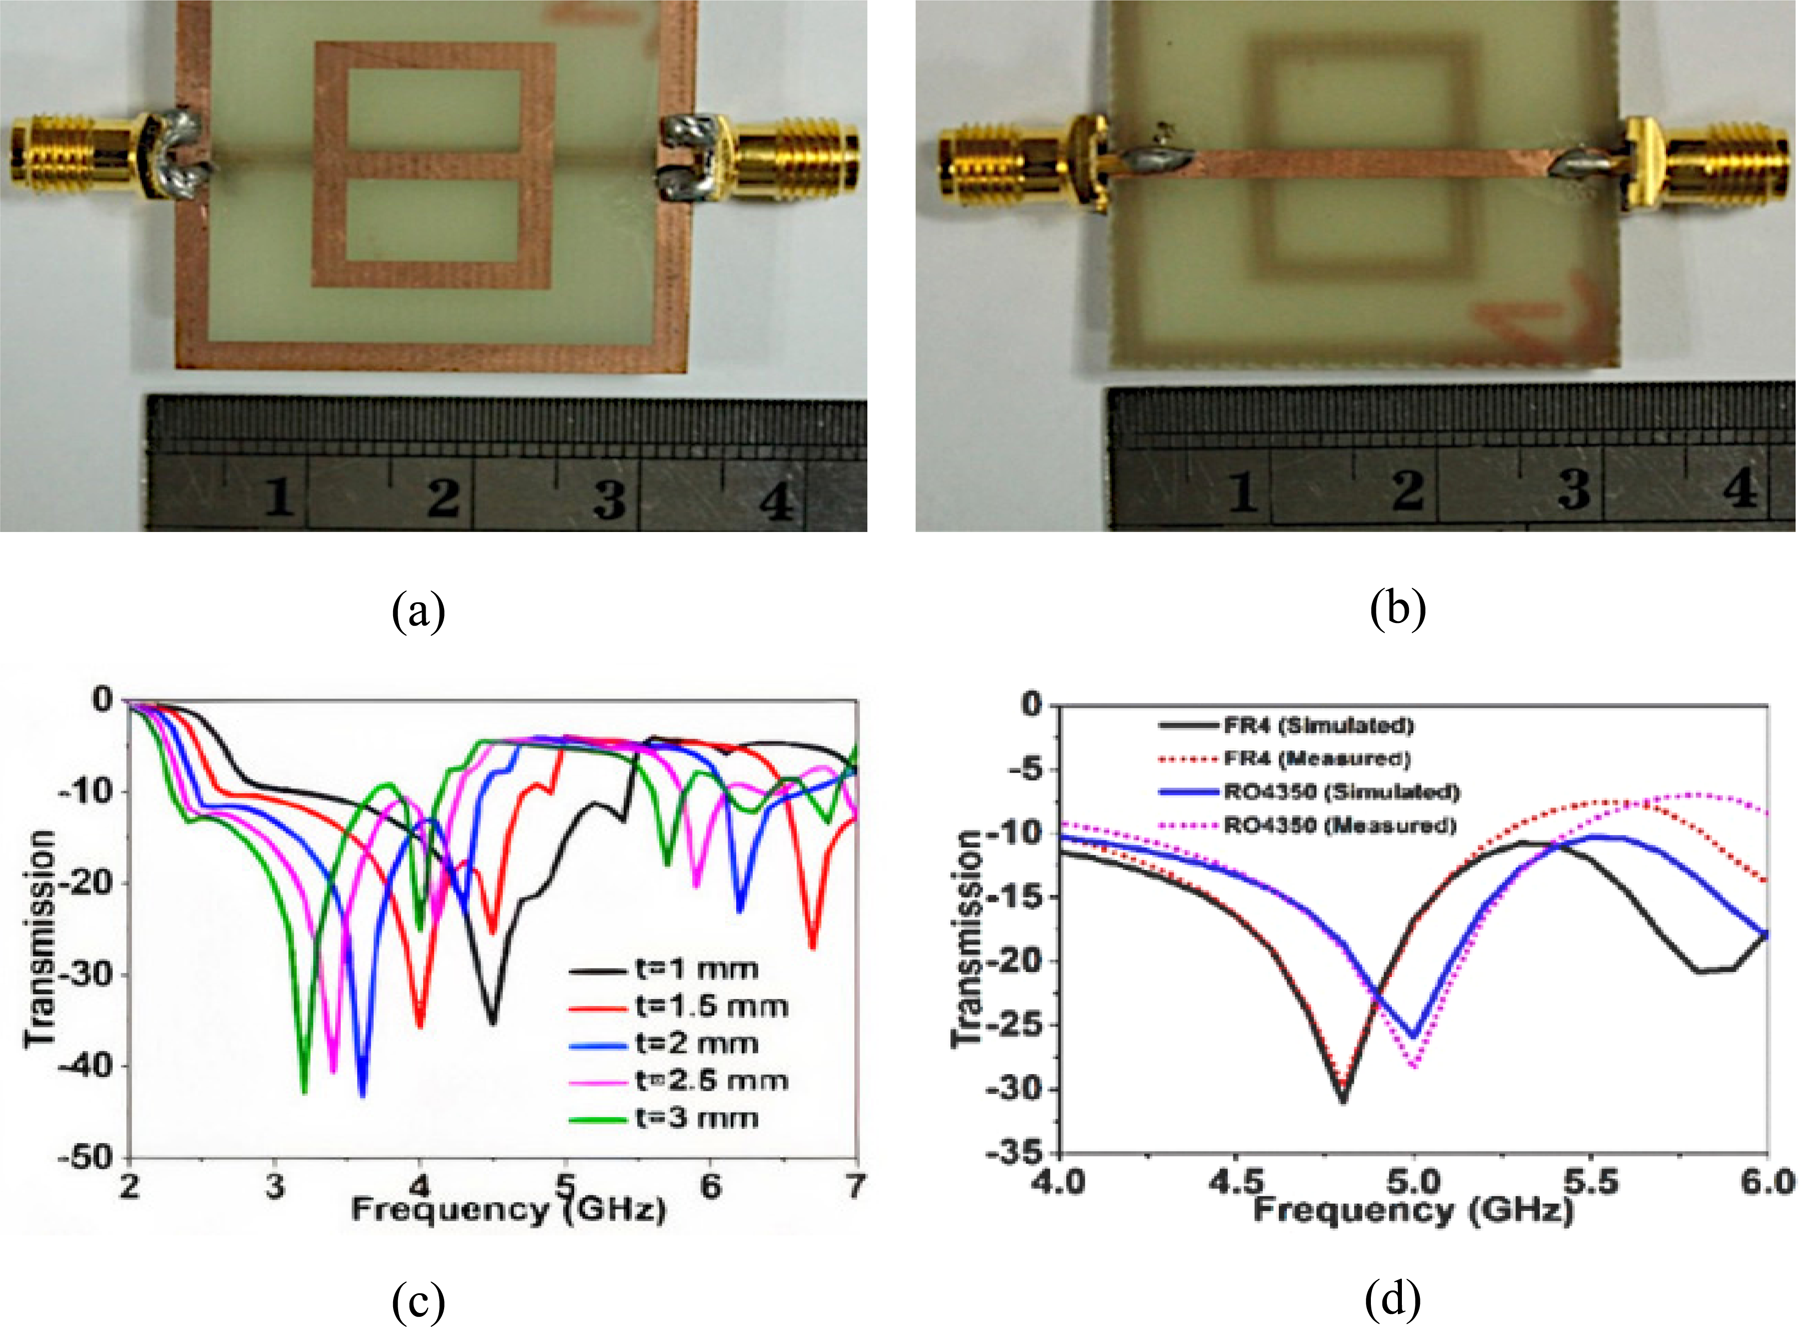
Fig. 13. (a) Top side of the prototype sensor, (b) bottom side of the prototype sensor, (c) different over-layer thickness gives different transmission curves and resonant frequencies, (d) transmission curves for FR4 and Rogers RO4350 over-layers. Islam et al. (2018) [Reference Islam, Rahman, Samsuzzaman, Mansor and Misran9].
For the determination of the type of fiber and their ratios in construction material such as concrete, [Reference Akgol, Unal, Bağmancı, Karaaslan, Sevim, Öztürk and Bhadauria29] proposes a V-shaped resonator (VSR) as shown in Fig. 14(a). For achieving maximum interaction of the construction material with the sensor, the resonating structure and a large length of the transmission line are designed in V-shape. The sensor offers non-destructive sensing of concrete samples and prevailing structures. Fibers are added to concrete to improve their flexural strength, shrinkage, flexibility, and post-cracking behavior. The fibers examined are carbon steel, Forta-Ferro, and propylene fiber. Prior to designing the sensor, the dielectric properties of fiber-reinforced concrete are found using a VNA and horn antennas. The measurements are carried out between the frequency range 3–18 GHz. A suitable frequency is determined, using microwave spectroscopy, at which the dielectric characteristics of different material types and concentration differ substantially. The microwave sensor is designed at this operating frequency. The sensor structure consists of a VSR and transmission line build on an FR4 substrate of thickness 1.6 mm. The magnetic field is created around the microstrip line as a result of current flowing through it. As the microstrip line and the resonator are in close proximity and run parallel, a current is induced in the resonator because of the magnetic fields. On the copper plate, at the backside of the substrate, as shown in Fig. 14(b), circular gaps are etched to minimize the surface currents.

Fig. 14. (a) V-shaped resonator, (b) back view and the MUT placed in the resonator for sensing, (c) transmission response curve for all the construction material samples. Akgol et al. (2019) [Reference Akgol, Unal, Bağmancı, Karaaslan, Sevim, Öztürk and Bhadauria29].
The narrow space separating the transmission line and the V-shape gives rise to capacitance. This narrow space could be altered to change the resonant frequency of the structure. The construction material (MUT) when placed in the V-shape changes the transmission coefficient (S 21) between the two ports of the transmission line as seen in Fig. 14(c). The change in S 21 values is used to detect material type and concentration. Different ratios of the fibers such as 0.5, 1, and 1.5% in the concrete are taken for measurements. At the frequency 16.2 GHz, the transmission magnitudes of samples are distinguishable and this specific frequency is used to detect both the material type and the concentrations. Transmission profiles of different materials and ratios have a difference of at least 0.5 dB at 16.2 GHz, which is adequate to differentiate between samples. By carrying out measurements at various locations of the construction material, the structure could be used as a homogeneity sensor too. The concentration of electric fields about the MUT is achieved by the designed V-shape and the copper plate with circular holes at the bottom of the substrate. Having a V-shaped constriction in the structure, the sensor could also be used to detect the material type of building columns non-destructively.
Various topologies of the resonator along with their applications are listed in Table 1 and the important characteristics of the sensor are tabulated in Table 2, which are self-explanatory.
Conclusion
In this paper, an important class of metamaterial sensors has been reviewed for sensing the material parameters used in several commercial applications. These metamaterial sensors are very much desirable as they are small in size, are low cost, simple in design, easy to manufacture; with the use of microfluidic technology, require less amount of the sample to be tested; and could perform sensing using a contactless mechanism without coming in direct contact with the MUT. Both single-band and multi-band approaches of sensing mechanisms have been discussed. Multi-band sensing increases the reliability of sensing and the sensors offer high sensitivity and quality factors as well. The tunability of the resonance frequencies helps in measurements as the resonance frequencies could be tuned according to the availability of test set up and the application. Sensors for sensing multiple parameters could be used for measuring different physical attributes through a single sensor. The design of low-cost sensors without compromising with the performance of the sensor is a great challenge which can be handled easily using metamaterial sensors employing inkjet printing mechanism. Physical and electromagnetic properties of substances could be measured as well as their identification and characterization are possible. The most common application is found to be fluid concentration measurements and material characterization.
 Divya Prakash received the Bachelor's degree in Electronics and Telecommunication Engineering from Savitribai Phule Pune University, Pune, India in 2010 and the Master's degree in Electronics and Communication Engineering from Birla Institute of Technology, Mesra, Ranchi, India in 2018 and joined the same institute to pursue the Ph.D. degree in 2019. His main research interests are high-frequency electronics, electromagnetics, metamaterials, and their applications. The ongoing research is focused on designing sensors using metamaterial absorbers.
 Nisha Gupta received the Bachelor's and Master's degrees in Electronics and Telecommunication and Electrical and Electronics Engineering from Birla Institute of Technology, Mesra, Ranchi, India and the Ph.D. degree from the Indian Institute of Technology, Kharagpur, India. She was a post-doctoral fellow at the University of Manitoba, Canada from 1997 to 1998 before joining the Department of Electronics and Communication Engineering, Birla Institute of Technology in 1999 as a Reader. Currently, she is a Professor in the same department. She has authored and co-authored more than 100 technical journal articles and conference papers. Her research interests are computational electromagnetics, antennas for wireless communication, AI techniques in wireless and mobile communication, and EMI/EMC.


