Introduction
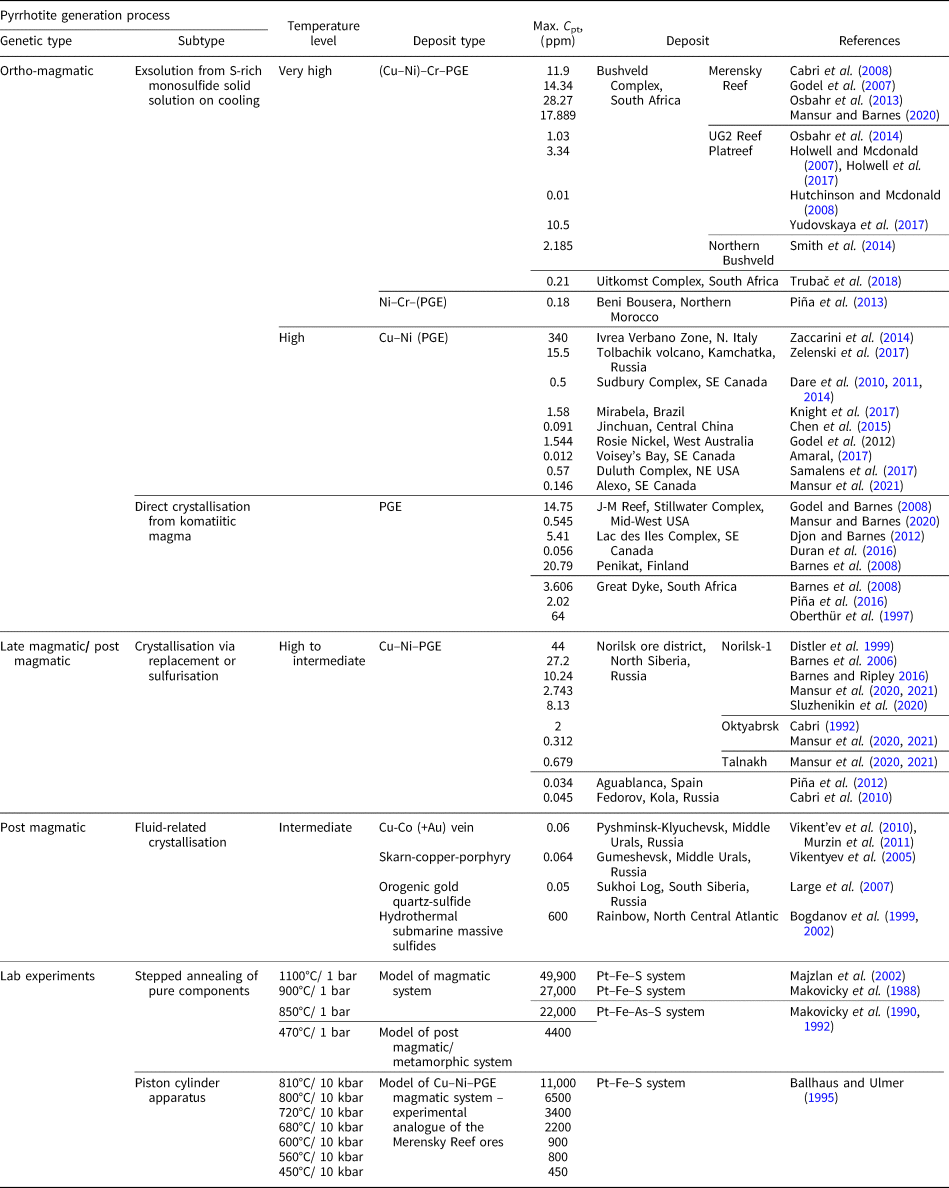
In ores containing platinum-group elements (PGE), these metals can exist as: (1) discrete minerals – natural alloys and solid solutions; (2) intermetallic compounds of various compositions; (3) compounds with chalcogens (S, Se and Te) and metalloids (As, Sb and Bi); and (4) in the ‘invisible’ state (by analogy with ‘invisible’ Au) being disseminated in the matrix of the main ore-forming sulfide minerals (Distler et al., Reference Distler, Malevsky and Laputina1977; Cabri, Reference Cabri1992; Barnes et al., Reference Barnes, Cox and Zientek2006). The latter form of occurrence is considered a solid solution of PGE and the base-metal sulfides and comprises an economically important (up to dominant) part of the total PGE budget (e.g. Distler et al., Reference Distler, Sluzhenikin, Cabri, Krivolutskaya, Turovtsev, Golovanova, Mokhov, Knauf and Oleshkevich1999; Cabri et al., Reference Cabri, Sylvestor, Tubrett, Peregoedova and Laflamme2003). Pyrrhotite Fe1–xS belongs to the main ore mineral assemblages in most magmatic sulfide PGE and nickel deposits, including the gigantic deposits of the Norilsk group, Russia; Bushveld Complex, South Africa; Great Dyke, Zimbabwe; Duluth, USA; Sudbury, Canada; Jinchuan, China; and Mt Keith, Australia, as well as a large Stillwater deposit, USA. In particular, the concentration of Pt in pyrrhotite in the ores of the Norilsk group deposits varies from ~0.1 to 40 ppm depending on the ore type and mineral assemblage (e.g. Sluzhenikin et al., Reference Sluzhenikin, Distler, Dyuzhikov, Kravtsov, Kunilov, Laputina and Turovtsev1994; Distler et al., Reference Distler, Sluzhenikin, Cabri, Krivolutskaya, Turovtsev, Golovanova, Mokhov, Knauf and Oleshkevich1999; Sluzhenikin et al., Reference Sluzhenikin, Distler and Grigor'eva2015; Sluzhenikin et al., Reference Sluzhenikin, Yudovskaya, Barnes, Abramova, Le Vaillant, Petrenko, Grigor'eva and Brovchenko2020). These values of Pt concentration are consistent with Pt content in pyrrhotites from various other PGE deposits worldwide (Table 1), where the measured Pt content in pyrrhotite commonly ranges from a few tenths of ppm to several dozen ppm. Experimental studies of the solubility of Pt in pyrrhotite (Malevsky et al., Reference Malevsky, Laputina and Distler1977; Majzlan et al., Reference Majzlan, Makovicky, Makovicky and Rose-Hansen2002; Makovicky et al., Reference Makovicky, Makovicky and Rose-Hansen1988, Reference Makovicky, Karup-Møller, Makovicky and Rose-Hansen1990, Reference Makovicky, Makovicky and Rose-Hansen1992; Ballhaus and Ulmer, Reference Ballhaus and Ulmer1995) showed that the Pt content increases sharply with temperature and can reach ca. 0.5 wt.% at 1100°C (Table 1). The form of Pt occurrence in pyrrhotite, however, is still under debate.
Table 1. Content of Pt in pyrrhotites and their approximate formation/synthesis temperatures for ore deposits of various types and for model systems.
The present study aims to determine the state (local atomic environment, position in the host mineral structure and valence state) of Pt in pyrrhotite using X-ray absorption spectroscopy (XAS) experiments combined with the theoretical spectra modelling. An X-ray absorption spectrum comprises an X-ray absorption near-edge structure part (XANES, to 50–80 eV from the absorption edge) that provides information about the electronic structure and coordination geometry (Mottana, Reference Mottana, Beran and Libowitzky2004), and an extended X-ray absorption fine structure part (EXAFS, to 1000 eV from the absorption edge), that enables the determination of the type of neighbouring atoms, coordination numbers and the radii of coordination spheres around the absorbing atom (Galoisy, Reference Galoisy, Beran and Libowitzky2004). In order to determine the crystal-chemical properties of Pt in pyrrhotite, we synthesised pyrrhotite crystals doped with Pt at 650–720°C in systems of varying sulfur fugacity (log $f_{{\rm S}_ 2}$ from –7 to –0.8 at 650°C, and equal to –0.1 at 720°C). The use of synthetic crystals with elevated concentrations of Pt enabled us to acquire XANES spectra and obtain good quality EXAFS spectra and, as a result, properly characterise the local atomic environment of the dopant. The experimental X-ray absorption spectra were compared to simulated spectra to confirm the results of the spectra treatment and evaluate the number of vacant cationic positions near the Pt atom. Our experiments show that Pt in pyrrhotite can form an isomorphous solid solution that partly decomposes upon cooling. The factors which promote the formation of Pt-rich pyrrhotite solid solution are analysed and applied to the interpretation of the state of Pt in natural ores.
Materials and methods
Synthesis of minerals in the Pt–Fe–S system
Platinum-doped pyrrhotite and co-existing pyrite crystals were synthesised using a salt flux technique at a steady-state temperature gradient (Chareev et al., Reference Chareev, Volkova, Geringer, Koshelev, Nekrasov, Osadchii, Osadchii and Filimonova2016); the scheme of the experiment is given in Fig. 1. The synthesis parameters and the charge compositions are given in Table 2. The initial reagents were pre-synthesised Fe0.9S and FeS2 powders, crystalline S, and Pt wire of 0.5 mm diameter. The starting materials were loaded into silica glass ampoules (8 mm ID, 11 mm OD and ~110 mm length). The length of Pt wire never exceeded half of the ampoule to prevent the growth of the crystals on the wire near the cold end. Then the eutectic salt mixtures listed in Table 2 were loaded to fill the maximum possible ampoule volume. The compositions of the salt mixtures were chosen according to the required synthesis temperature as described in Chareev (Reference Chareev2016). The ampoules were evacuated, sealed with an oxygen torch gas burner, and placed into horizontal tube furnaces, which were then heated to the synthesis temperature. The experimental temperatures were 790°C hot end /720°C cold end (No. 5602), 710/650°C (Nos. 5590, 5592, 5599 and 5601).
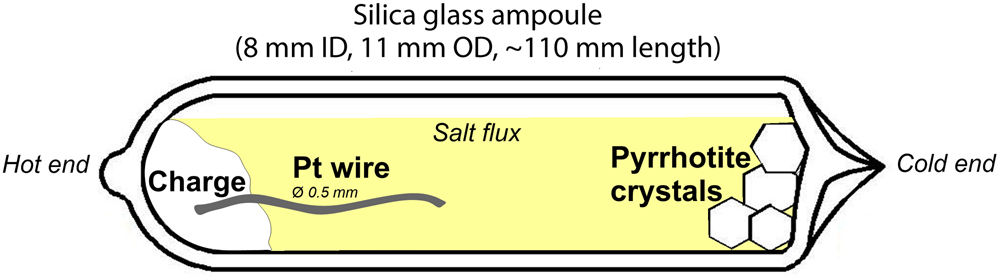
Fig. 1. Set-up of pyrrhotite synthesis: silica glass ampoule loaded with initial materials (charge) + salt flux. The Pt wire is at the hot side of the ampoule.
Table 2. Parameters of synthesis, starting materials, compositions and empirical formulae of synthetic pyrrhotite and co-existing pyrite crystals.
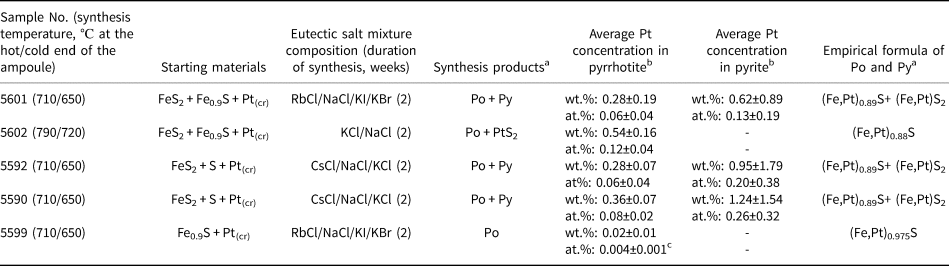
a Po – pyrhotite, Py – pyrite; baverage concentration is determined using EPMA, standard deviation corresponds to ± 2σ; cconcentration is determined via LA-ICP-MS analyses, standard error corresponds to ± 2σ.
Duration of the experiments varied from 2 to 8 weeks. During the experiment, the Pt-doped pyrrhotite and co-existing pyrite crystallised at the cold end of the ampoules. The ampoules were extracted from the furnaces and quenched in cold water at the end of the experiments. The cold ends of the ampoules were cut off, the synthesised crystals (~0.5 g) were washed in distilled water and then in acetone using an ultrasonic bath. To avoid oxidising, the rinsed crystals were dried at 70°C in a muffle furnace for a few minutes.
Analytical methods
The phase composition of the synthesised crystals was determined by X-ray diffraction (XRD) using an EMPYREAN X-ray diffractometer (CuKα, 45 kV, 40 mA and 0.033° step size) with subsequent comparison of the experimental diffraction patterns with database records. The measurements of pyrrhotite patterns were performed using a standard Bragg–Brentano (parafocusing) geometry, two wavelengths with a doublet intensity ratio of 2:1 were taken into account: λ = 1.5406 and λ = 1.5444 Å.
Several grains of pyrite and pyrrhotite from each sample were mounted in epoxy resin, polished and studied using reflected light optical microscopy (Olympus BX-51). Further analysis was undertaken using a JSM-5610LV scanning electron microscope (SEM) equipped with an X-Max 80 energy dispersive spectrometer (EDS). Crystals of pyrite and pyrrhotite were analysed for major elements (S and Fe) and minor element (Pt) using a JEOL JXA-8200 WD/ED combined electron probe microanalyser (EPMA) equipped with five wavelength dispersive X-ray spectrometers.
The Pt (195Pt isotope) concentration was determined using laser ablation inductively coupled plasma mass spectrometry (LA-ICP-MS) on a Thermo X Series2 quadrupole ICP-MS coupled with a New Wave 213 laser. The in-house pyrrhotite Fe0.9S and sufide reference material MASS-1 (Wilson et al., Reference Wilson, Ridley and Koenig2002) were used as external standards. The in-house reference of Fe0.9S containing ~20 ppm Pt was obtained using the Wohlgemuth-Ueberwasser et al. (Reference Wohlgemuth-Ueberwasser, Ballhaus and Berndt2007) experimental technique and calibrated with respect to the concentration of Pt against standards prepared by J.H.G. Laflamme and A. Peregoedova at the University of Québec at Chicoutimi. The 33S and 57Fe isotopes were used as internal standards. The EPMA and LA-ICP-MS operating conditions are given in Supplementary Table A.1 and Table A.2, respectively (see below for Supplementary material access).
X-ray absorption spectroscopy (XAS)
Several pyrrhotite crystals from each sample were selected for XAS experiments using a binocular microscope. The XRD patterns of these crystals correspond to pure pyrrhotite (PDF#24-0220, powder diffraction file from the International Centre for Diffraction Data, https://www.icdd.com/). The TFY-XAS (total fluorescence yield mode) experiments were performed at the Rossendorf Beamline BM20 at the European Synchrotron Radiation Facility (ESRF) in Grenoble, France. The storage-ring operating conditions were 6.0 GeV and 80–100 mA. The photon energy was scanned using the Si(111) monochromator. Rejection of higher harmonics was achieved by three Rh-coated mirrors working under total reflection. The 13-element high-throughput Ge-detector was used. All the spectra were recorded at ambient temperature. The spectra of Pt(cr), PtS(cr), and PtS2(cr) as reference substances were collected in transmission mode. The energy calibration was performed using a Pt foil (maximum of the first derivative, 11,564 eV). Energy scans from 11,250 to 12,600 eV were recorded and then averaged for each sample (the number of scans varied from 3 to 20). For the measurements, the pyrrhotite crystals and the reference materials (except Pt foil) were ground, and then powders were spread on an adhesive Kapton tape.
Analyses of X-ray absorption spectra
Data reduction and modelling of Pt L 3-edge absorption spectra were performed using the Athena (preliminary data processing, analysis of XANES spectra) and Artemis (EXAFS spectra fitting) programs of the IFEFFIT software package (Ravel and Newville, Reference Ravel and Newville2005).
XANES spectra analysis
Preliminary data processing included energy calibration, determination of the position of the absorption edge (e.j.) and the first intense feature (white line, WL), background subtraction and normalisation of the spectra. The position of the absorption edge is sensitive to the local atomic geometry and the oxidation state of the absorbing atom. Therefore, the experimental spectra of Pt-bearing pyrrhotites were compared to the spectra of reference materials with a known local atomic environment and ‘formal’ oxidation states of Pt: 0 (Pt), 2+ (PtS), 4+ (PtS2). The ‘formal’ charge concept assumes that the chemical bonding in a compound is purely ionic. In the case of Pt-bearing phases with the substantial covalent component of the chemical bonding, the real atomic charge is different from the ‘formal’ one (Evstigneeva et al., Reference Evstigneeva, Trigub, Chareev, Nickolsky and Tagirov2021). Even though purely ionic crystals do not exist, we use the ‘formal’ charges to discriminate between the Pt2+ in 4-fold coordination and Pt4+ in 6-fold coordination.
Linear Combination Fitting (LCF) analysis was carried out in the energy range between 11,550 and 11,625 eV using the Athena program.
EXAFS spectra analysis
The EXAFS spectra fitting provides information about the local atomic environment of the excited atom: the numbers of neighbouring atoms (Nij), interatomic distances (Rij), and Debye–Waller factors reflecting the static or thermal disorder (σij 2). These parameters were determined via the non-linear least-squares fitting of experimental data with the theoretical spectra described by the EXAFS equation:

The other parameters (λ(k) − photoelectron mean free path length, F ij(k) − amplitude, φij(k) − phase shift) necessary to simulate theoretical spectra were calculated ab initio using the FEFF6 program (Zabinsky et al., Reference Zabinsky, Rehr, Ankudinov, Albers and Eller1995).
Theoretical modelling using the ab initio finite difference method for near-edge structure (FDMNES) code
The objective of the simulations was to study the state of Pt in the ideal NiAs-type pyrrhotite structure. Simulations of Pt L 3-edge XANES spectra were performed via theoretical modelling using the ab initio finite difference method for near-edge structure (FDMNES) code (Joly, Reference Joly2001; Guda et al., Reference Guda, Guda, Soldatov, Lomachenko, Bugaev, Lamberti, Gawelda, Bressler, Smolentsev, Soldatov and Joly2015). In the FDMNES program, the molecular field is considered as a superposition of three fields: (1) atoms for which potentials are approximated as spherically symmetric, (2) an intersphere (muffin-tin) region, and (3) space with effective potential following Hedin and Lundqvist (Reference Hedin and Lundqvist1971) using the local density approximation (LDA). The cubic FeS2 crystal structure (space group Pa$\bar{3}$ and lattice parameter a = 5.4179 Å; Brostigen and Kjekshus, Reference Brostigen and Kjekshus1969) and the hexagonal Fe1–xS crystal structure (space group P63mc, lattice parameters a = 3.4300 Å, c = 5.6800 Å and a/c = 1.6560; Wyckoff, Reference Wyckoff1963) were used as initial structures in all calculations. Simulations were performed with a 6 Å cluster radius and a 3 × 3 × 3 supercell structure of pyrite (reference material), and a 6 Å cluster radius and a 3 × 3 × 2 supercell structure of pyrrhotite (samples). Convolution parameters obtained for simulated XANES spectrum of isomorphous Pt in pyrite were used for the convolution of simulated Pt-bearing pyrrhotite spectra (the spectrum and parameters for the local atomic environment of isomorphous Pt in pyrite were adopted from Filimonova et al., Reference Filimonova, Nickolsky, Trigub, Chareev, Kvashnina, Kovalchuk, Vikentyev and Tagirov2019). The interpretation was carried out via the comparison of XANES simulated spectra with those obtained in the experiment.
Results and discussion
The concentration and distribution of Pt in pyrite and pyrrhotite
The products of synthesis experiments consisted of crystals with a grain size of 0.5–5 mm. A few crystals of each sample were examined using SEM/EDS, EPMA and LA-ICP-MS methods. Phase and chemical compositions of synthesis products are given in Table 2 and Supplementary Table A.3. The content of Pt in pyrite co-existing with pyrrhotite varies between 0.13 and 0.26 at.% in samples synthesised at the temperature of 650°C, and in pyrrhotite from 0.004 to 0.12 at.% (temperature interval 650–720°C). The concentration of Pt in pyrrhotite drops with decreasing temperature.
Back-scattered electron (BSE) photomicrographs in Fig. 2 display selected synthesised crystals. Analysis of SEM images revealed the presence of microcrystals of Pt-bearing pyrrhotites in the pyrite crystals. At the same time, pyrrhotite crystals are free of inclusions of pyrite and Pt-bearing phases. The BSE images demonstrate the uniform Z contrast within the distinct zones of the pyrite crystals and within the single crystals of pyrrhotites. Time-resolved LA-ICP-MS spectra exhibit the smooth shape of the signal ablated within distinct crystal zones, which confirms the homogeneous character of synthesised Pt-doped pyrrhotite and co-existing pyrite crystals (Fig. 3 and Supplementary Fig. A.1).
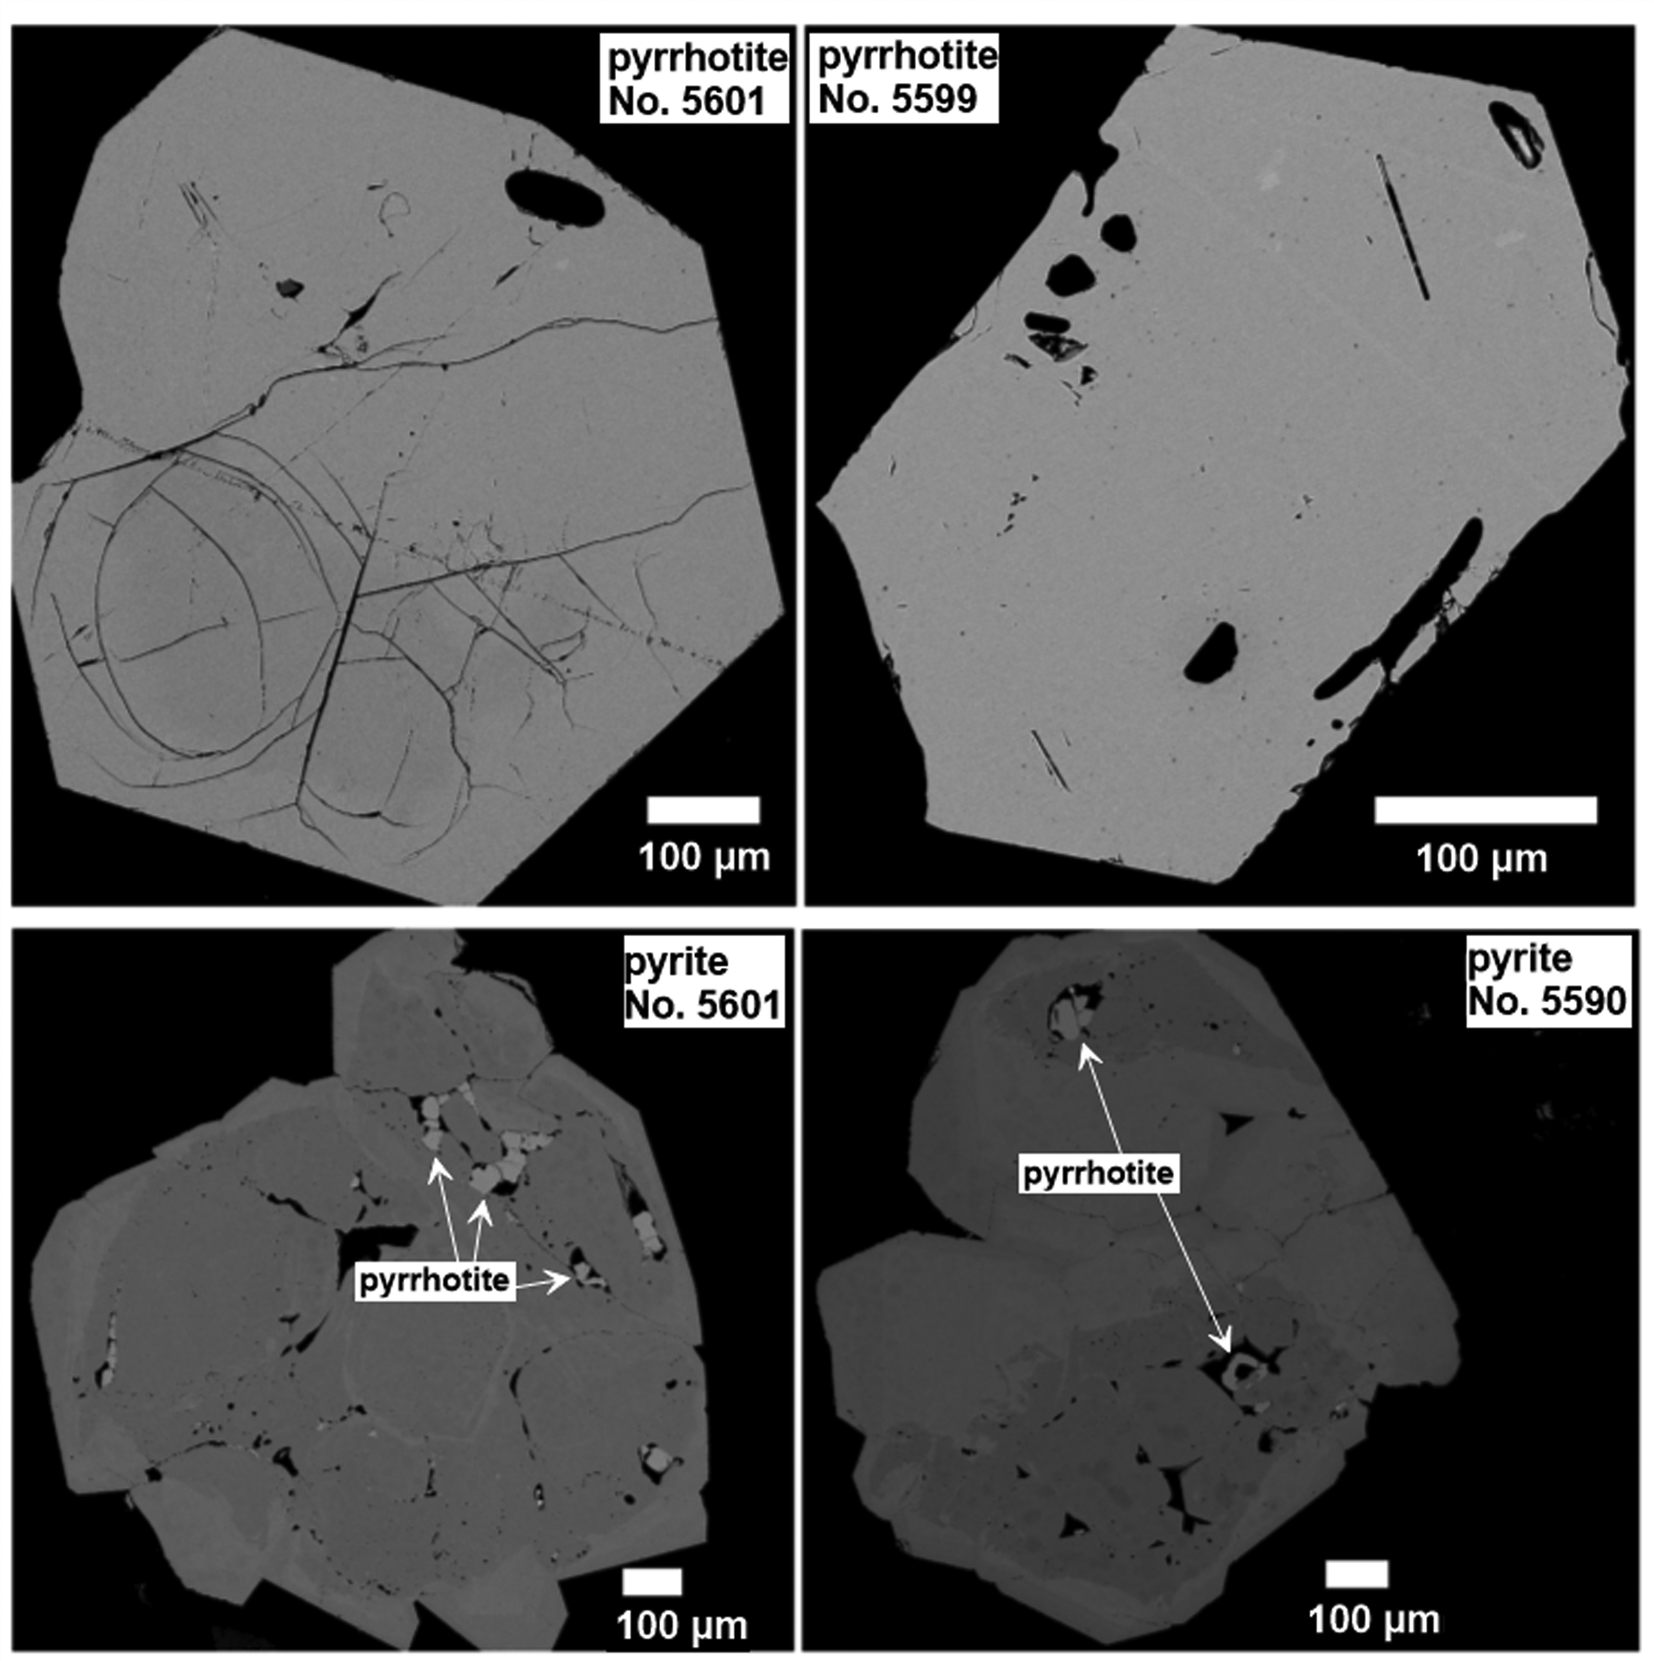
Fig. 2. Selected synthetic Pt-bearing pyrite and pyrrhotite crystals (Nos. 5590, 5601 and 5599). Back-scattered electron (BSE) images show (top) Pt-doped pyrites containing pyrrhotite inclusions (the distribution of Pt is uniform within growing zones of the crystals, the growing zones differ in the concentration of Pt), and (lower) a uniform Z-contrast distribution of Pt in pyrrhotites of low Pt content.
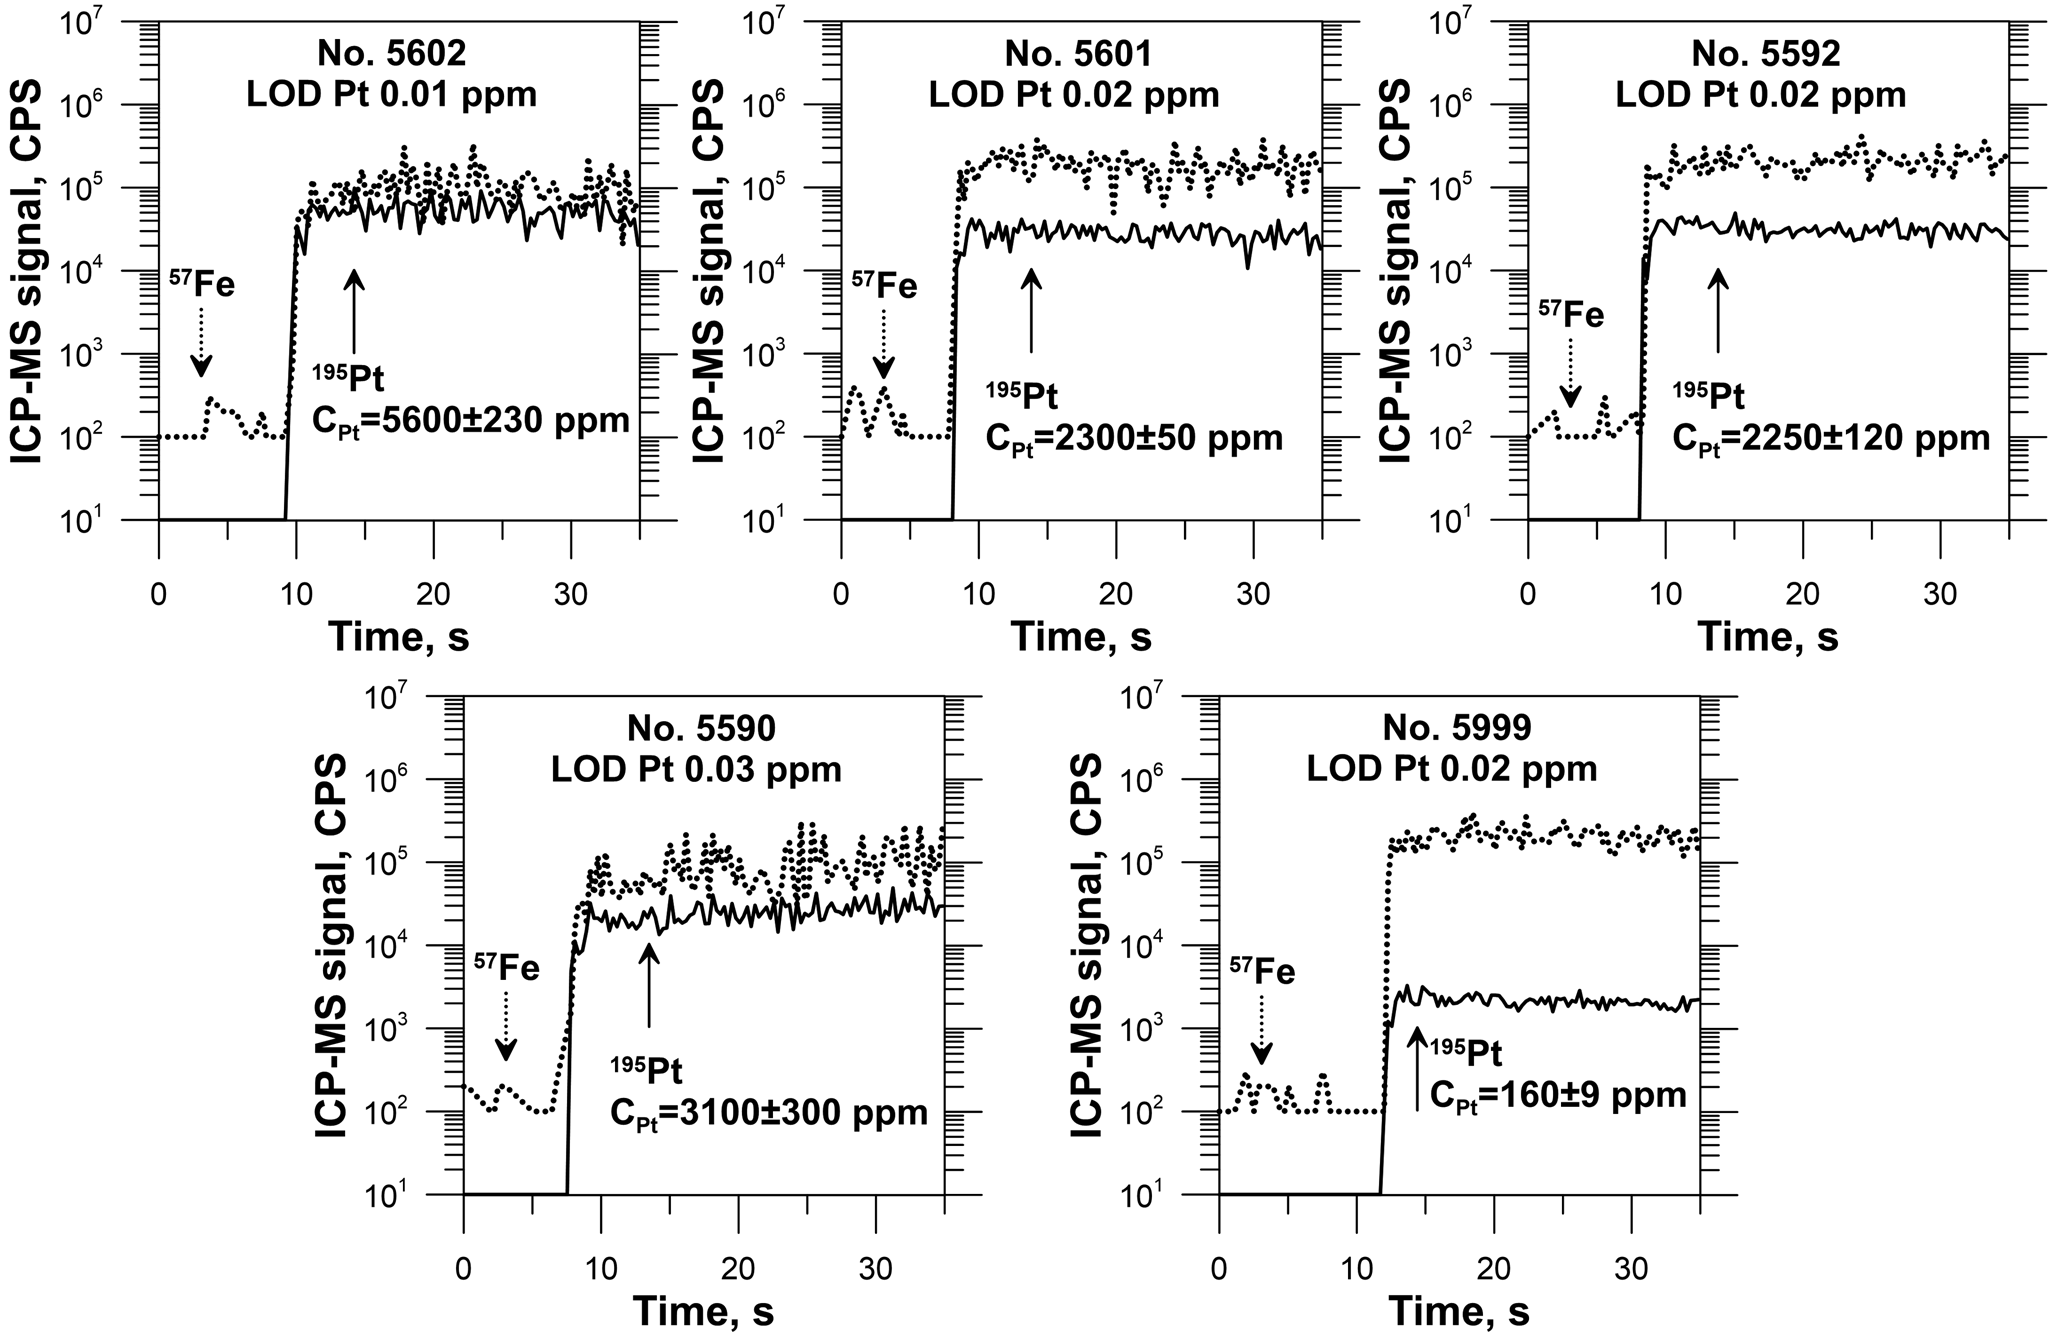
Fig. 3. Selected time-resolved laser ablation ICP-MS spectra of Pt-bearing pyrrhotites. Analyses were performed using a spot size of 60 μm. The Pt disseminated in the pyrrhotite matrix behaves similarly to the internal standard element, Fe. Uncertainty corresponds to ±2σ, limit of detection (LOD) is calculated using Iolite (Paton et al., Reference Paton, Hellstrom, Paul, Woodhead and Hergt2011) and corresponds to 2σ confidence interval.
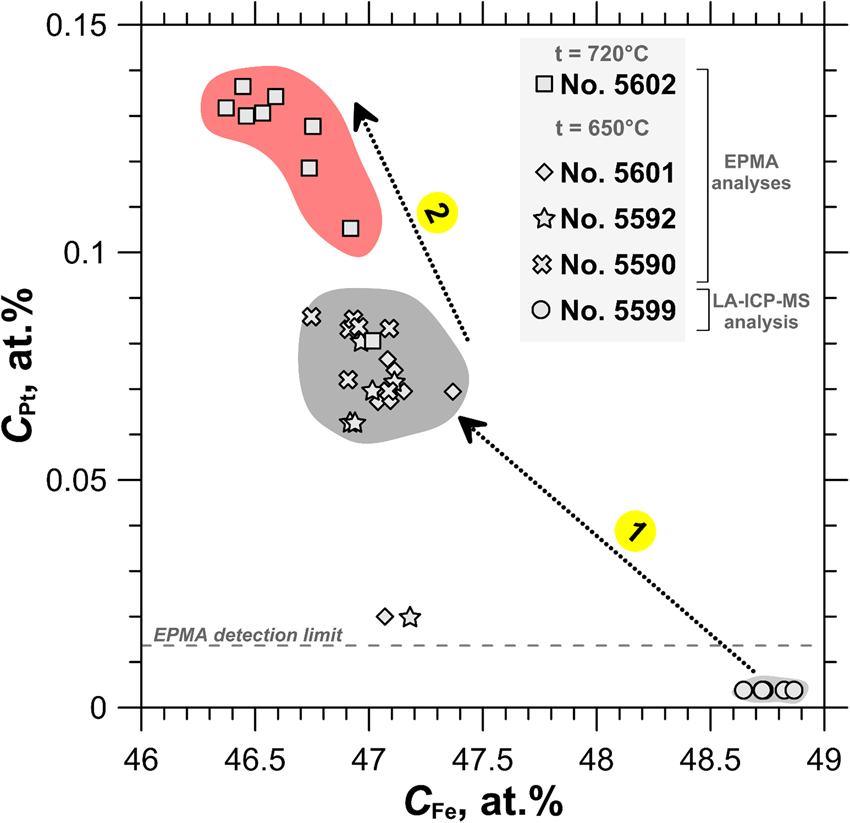
The compositions of the synthesised pyrrhotite samples are shown in the log $f_{{\rm S}_ 2}$ vs. 1000/T plot in Fig. 4. The binary plot shown in Fig. 5 demonstrates a negative dependence between the concentration of major (Fe) and trace (Pt) elements determined by EPMA of selected pyrrhotite samples. As follows from Fig. 4 and Fig. 5, the increase of sulfur fugacity and synthesis temperature increases Pt content in pyrrhotite. This behaviour of Pt – increase in solubility with increase of the S2 fugacity and temperature – is consistent with the solid-solution formation in the Pt–Fe–S system.
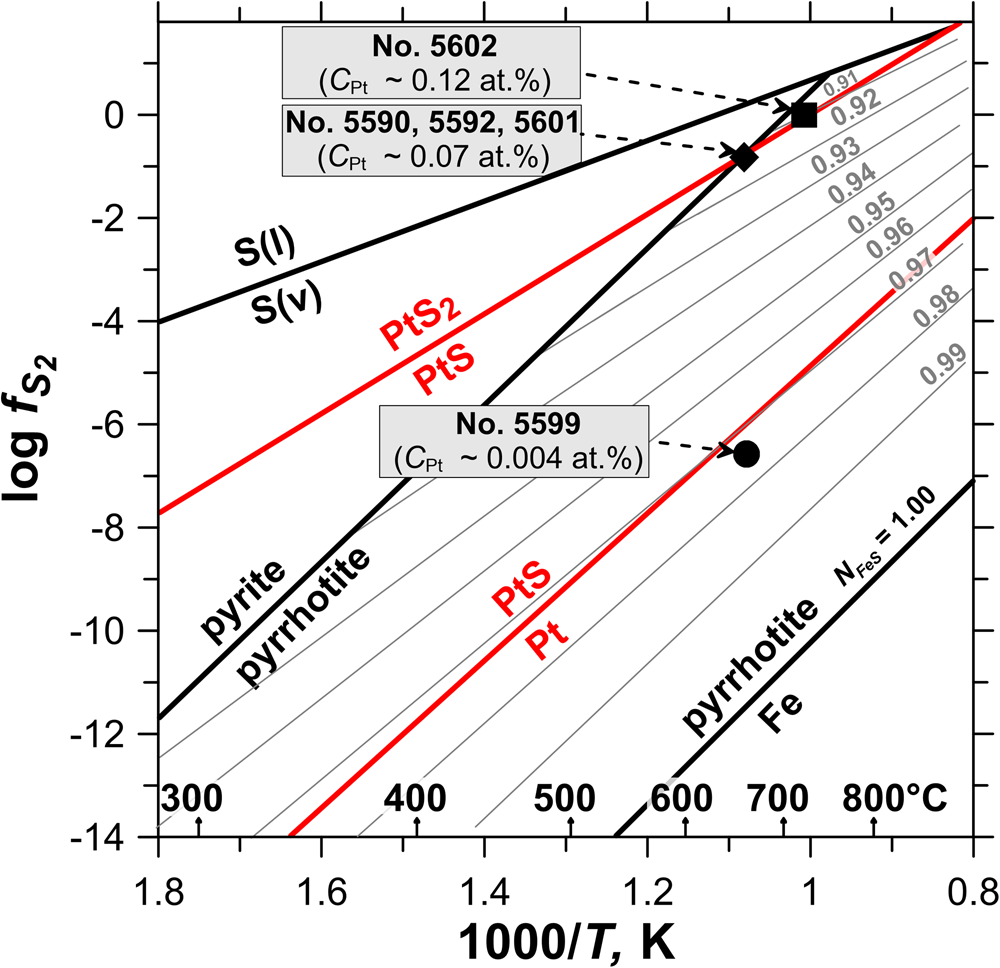
Fig. 4. The synthesis experiments parameters. Data are adopted from Toulmin and Barton (Reference Toulmin and Barton1964), Naumov et al. (Reference Naumov, Ryzhenko and Khodakovskiy1974) and Mills (Reference Mills1974) for FeS–S2, Pt and PtS, PtS2, respectively. The N FeS indicates composition isopleths of pyrrhotite. The black symbols indicate the calculated values of sulfur fugacity in the experimental systems determined from the pyrrhotite composition.

Fig. 5. The concentration of Pt as a function of Fe concentration determined by EPMA and LA-ICP-MS in the pyrrhotite samples used for the XAS experiments. Uncertainty of ±2σ for each point never exceeds the filled fields, which show the variation of pyrrhotite compositions. Arrow 1: C Pt increases up to 0.3 wt.% with increasing sulfur fugacity at constant temperature of 650°C. Arrow 2: C Pt increases up to 0.5 wt.% with increasing temperature from 650°C to 720°C.
The ‘formal’ oxidation state of Pt in pyrrhotite from qualitative analysis of XANES
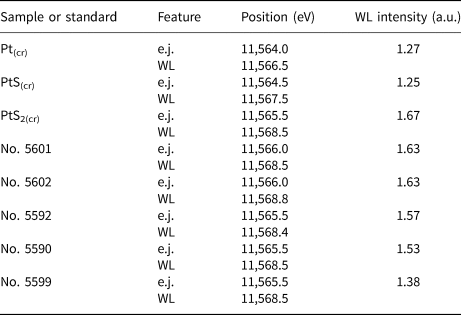
The Pt L 3-edge XANES spectra of Pt-bearing pyrrhotites are shown in Fig. 6a together with spectra of references: Pt(cr), PtS(cr), PtS2(cr). Positions of the absorption edge (e.j.), white line (WL), and the WL intensities are given in Table 3. The Pt L 3-edge absorption is related to 2p→5d transitions. Therefore, the WL intensity is sensitive to the number of empty states (holes) in the 5d valence orbitals. The increase of the WL intensity reflects the increase of the vacancies amount and can be attributed to the loss of electrons localised on the 5d orbitals. In general, the increase of the WL intensity for the related compounds means the increase of the positive charge of the absorbing atom (see Evstigneeva et al., Reference Evstigneeva, Trigub, Chareev, Nickolsky and Tagirov2021 for discussion of the effect of the Pt charge on the parameters of spectral features). In addition, for more oxidised species, the absorption edge shifts to higher energy.
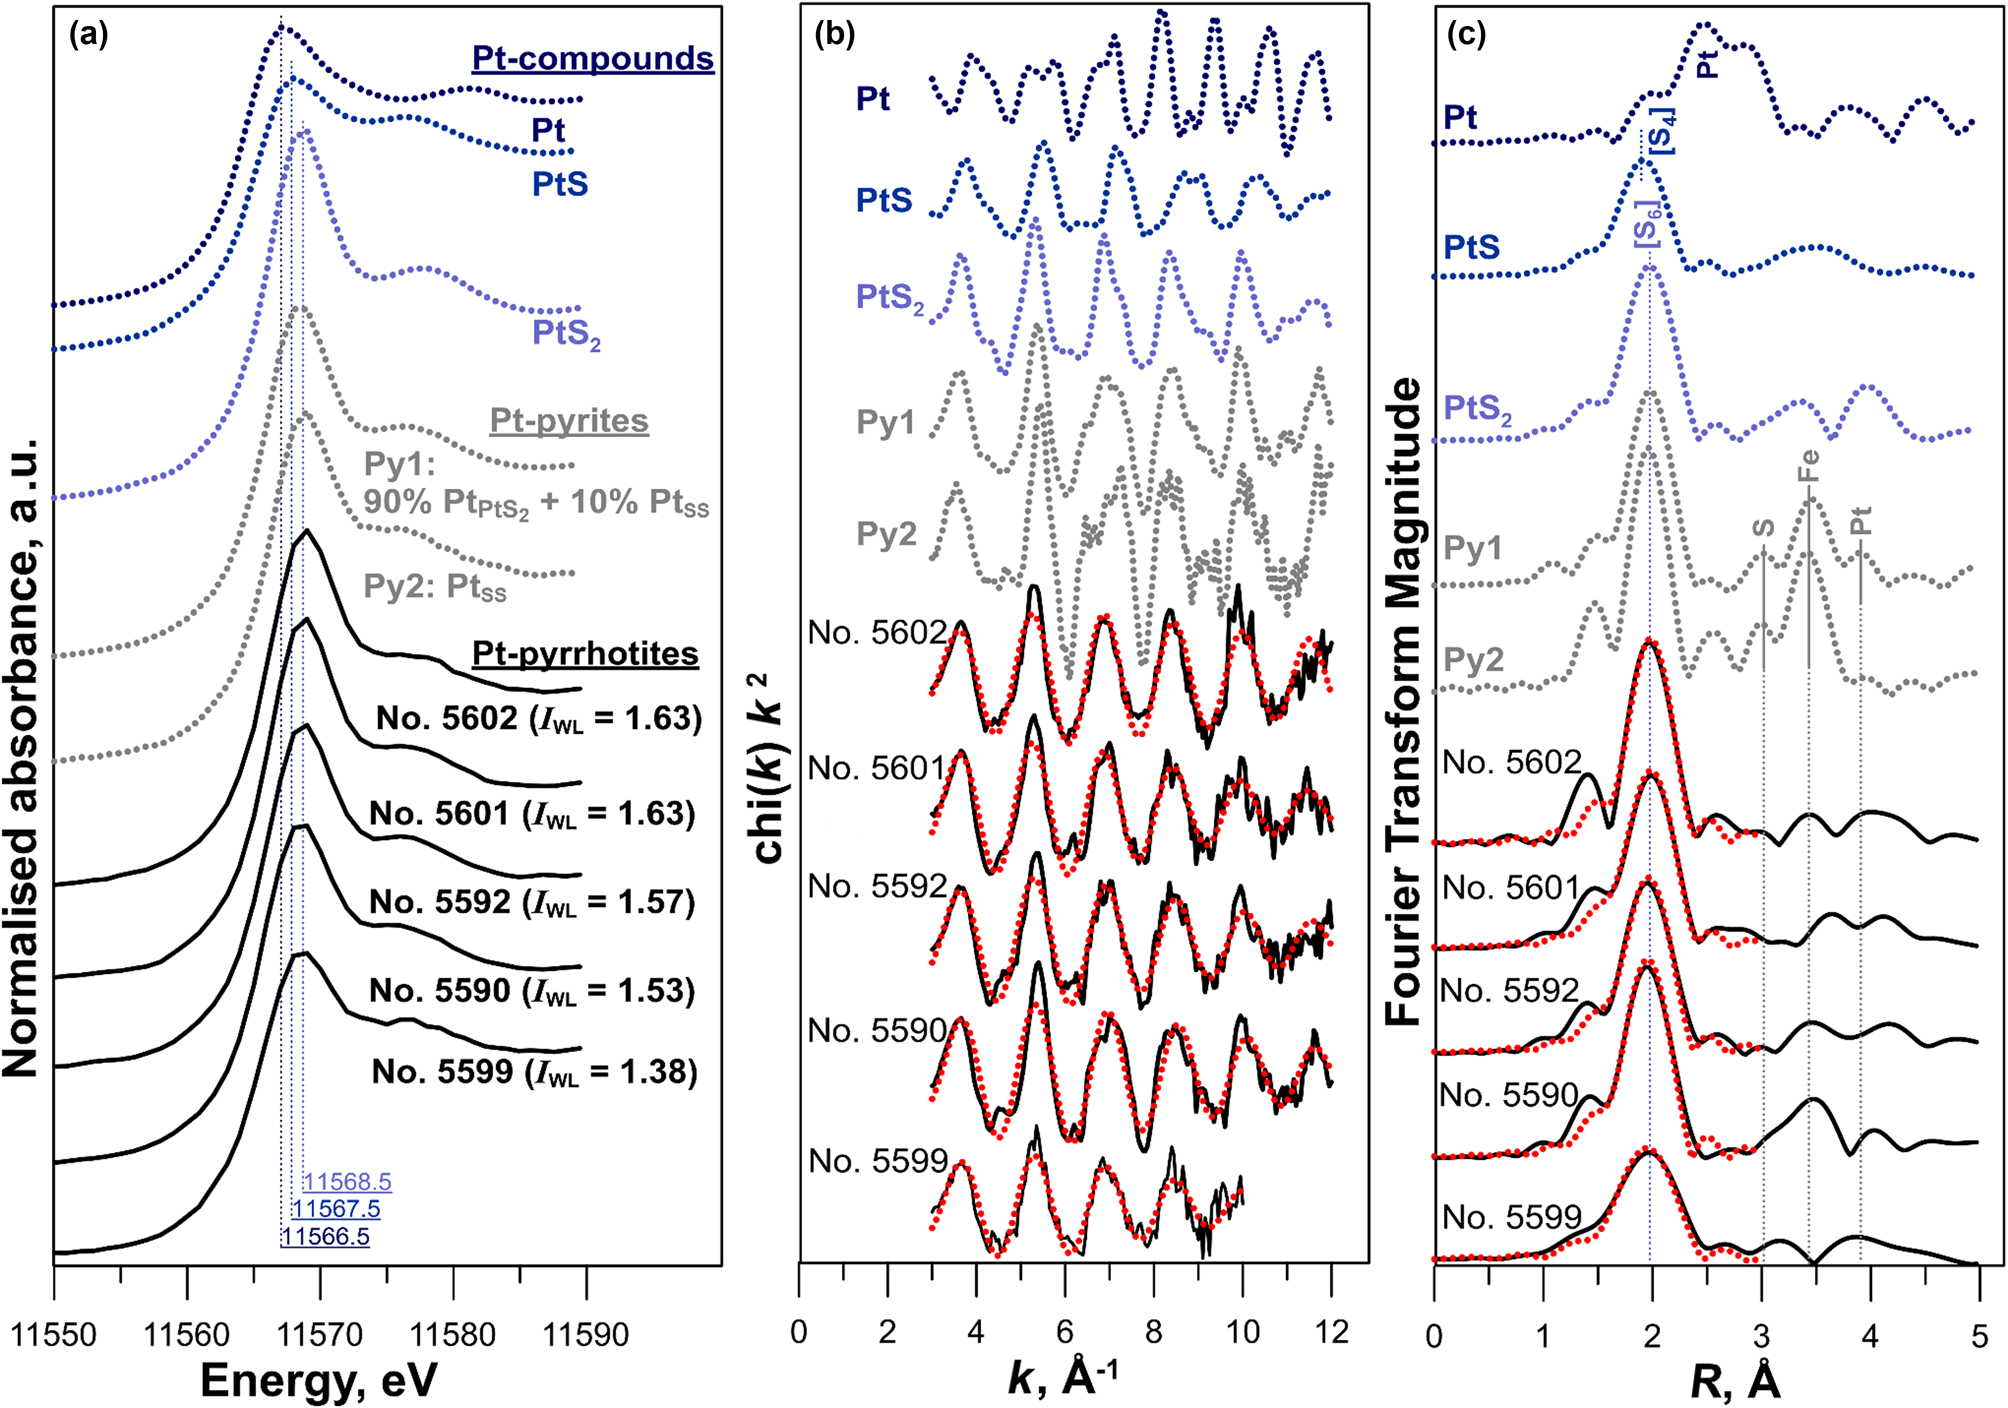
Fig. 6. (a) Normalised XANES spectra of Pt-bearing pyrite, pyrrhotite and reference materials. For Pt-bearing pyrites: PtPtS2 corresponds to nano-sized PtS2 inclusions, PtSS – the solid solution Pt in pyrite (the spectra are adopted from Filimonova et al., Reference Filimonova, Nickolsky, Trigub, Chareev, Kvashnina, Kovalchuk, Vikentyev and Tagirov2019). Vertical solid lines denote positions of the first intense feature (white line, WL) of pyrrhotites and references spectra. (b,c) the k 2-weighted background-subtracted EXAFS spectra together with their Fourier transforms (not corrected for phase shift, black lines – experiment, dotted red lines – fitted results). Vertical lines indicate the approximate position of atoms and atomic groups surrounding Pt.
Table 3. Positions of absorption edge (e.j.), white line (WL), and WL intensity of Pt L 3-edge normalised spectra of standards and synthetic Pt-bearing pyrrhotites as determined by the Athena program. The uncertainty of the energy values is ±0.5 eV.
Before interpretation of XANES spectra, it is necessary to prove the absence of the signal from pyrite, which can contain important (up to a few wt.%) concentrations of Pt in solid solution form (Filimonova et al., Reference Filimonova, Nickolsky, Trigub, Chareev, Kvashnina, Kovalchuk, Vikentyev and Tagirov2019). Optical microscopy, SEM and XRD analyses showed no contamination of the pyrrhotite samples studied with pyrite. However, the XRD method is not sensitive to the presence of low (<5% wt.%) concentrations of Pt-bearing pyrite. Comparison of the spectra of samples synthesised at different T–$f_{{\rm S}_ 2}$ conditions shows that the contribution of the signal from Pt-bearing pyrite is negligible. Indeed, XANES spectra of sample Nos. 5602 and 5601 are almost identical regardless of the fact that sample No. 5602 was synthesised in the pyrrhotite stability field (no pyrite present according to the log $f_{{\rm S}_ 2}$
 – 1000/T diagram in Fig. 4), whereas sample No. 5601 was synthesised at pyrite + pyrrhotite equilibrium. Accordingly, the spectra of the synthesised crystals correspond to the Pt-bearing pyrrhotite. Further evidence of the absence of pyrite contamination is provided by the analysis of EXAFS spectra in the following section.
Compared with the spectra of model substances − Pt°(cr) and Pt2+S(cr), the main features of the spectra of pyrrhotite samples Nos. 5590, 5592, 5601 and 5602 are significantly more intense, while their positions are shifted to higher energies. This means that the admixtures of Pt°(cr) and Pt2+S(cr) are absent in the samples. The charge of Pt exceeds the charge of the metal in the references. At the same time, the position of the e.j. and WL of Pt-bearing pyrrhotites and Pt4+S2(cr) are similar within the measurement error of ±0.5 eV. Moreover, the similarity of the spectra of Pt-bearing pyrrhotites and PtS2(cr) implies the local atomic geometry of Pt in the pyrrhotite samples to be close to Pt4+S2 where 6 S atoms surround the Pt atom. The intensities of WL (I WL) of pyrrhotite spectra are somewhat below that of PtS2, which contains Pt in the ‘formal’ oxidation state of 4+ (I WL(PtS2) = 1.67 arbitary units (a.u.), Table 3). Throughout the series of pyrrhotites studied, the WL intensity drops from 1.63 a.u. (sample Nos. 5601 and 5602) to 1.57–1.53 a.u. (sample Nos. 5590 and 5592). Hence, the positive charge of Pt decreases in the following sequence: PtS2 > Nos. 5601 and 5602 > Nos. 5590 and 5592. We suggest that the observed decrease of the WL intensity in the series of samples can result from an admixture of Pt2+.
Regardless of the fact that positions of the main spectral features of sample No. 5599 are similar to the other pyrrhotite spectra, the WL intensity of this spectrum decreases markedly in comparison with PtS2(cr) and other samples and increases significantly in comparison with PtS(cr) (I WL=1.38 a.u. for the sample vs. I WL=1.25 a.u. for PtS(cr)). This observation may be accounted for by the presence of Pt in 4+ and 2+ ‘formal’ oxidation states of commensurable quantities.
Given the above analysis, we suggest that the XANES spectra of Pt in pyrrhotite samples result from the superposition of signals from two forms of Pt: Pt4+ in the form of a solid solution or Pt4+S2, and Pt2+ in the form of Pt2+S-like clusters or inclusions, of which size prevents detection by SEM/EDS and LA-ICP-MS methods.
Local atomic environment of Pt in pyrrhotite from EXAFS
The experimental Pt L3-edge EXAFS spectra and their Fourier transforms together with the fitting results are shown in Fig. 6b,c (Pt-bearing pyrrhotites), and Supplementary Fig. A.2 (PtS2 reference). The results of the spectra fitting are given in Table 4.
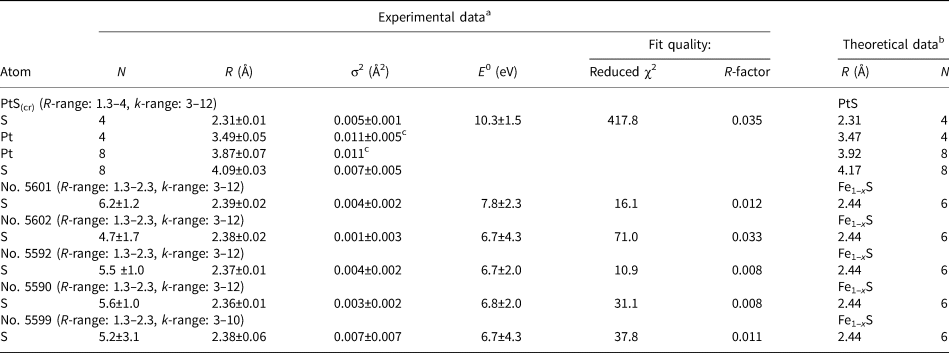
Table 4. The local atomic structure of Pt in PtS and Pt-bearing pyrrhotites determined by EXAFS k 2-weighting spectra fitting using IFEFFIT package (fit in R-space). Numbers without uncertainties were fixed during the fit. Uncertainties were determined by the Artemis program.

a Amplitude reduction factor S 02 = 0.90 adopted from Filimonova et al. (Reference Filimonova, Nickolsky, Trigub, Chareev, Kvashnina, Kovalchuk, Vikentyev and Tagirov2019); b PtS – Rozhdestvina et al. (Reference Rozhdestvina, Ivanov, Zaremba, Antsutkin and Forsling2008); pyrrhotite Fe1–xS – Wyckoff (Reference Wyckoff1963); cDebye–Waller factors are fixed to be equal.
Comparison of the Fourier transforms of the EXAFS signal from Pt-bearing pyrites and pyrrhotites provides further evidence of the absence of the pyrite contamination. The Fourier transforms of the spectra of Pt-bearing pyrites clearly have a second coordination shell consisting of S + Fe + Pt atoms (Fig. 6c). In contrast, the Fourier transforms of Pt-bearing pyrrhotites are different: no distinctive peaks typical for Pt in pyrite are present between 2.3–4.3 Å. This means that the contribution from Pt-bearing pyrite is certainly negligible.
Regardless of the Pt concentration, the best fit of the experimental pyrrhotite spectra is achieved when Pt atoms are octahedrally coordinated by S atoms in the first coordination sphere. Our attempts to fit the weak contribution from the distant coordination sphere atoms failed to produce a set of consistent data. The reasons for the failure can stem from the presence of several forms of Pt or the nonstoichiometric composition of pyrrhotite. The absence of a contribution of heavy Pt atom in the second coordination sphere means the absence of the admixtures of submicrometre or nano-sized Pt, PtS and PtS2 inclusions.
In the samples of Pt-bearing pyrrhotites, the Pt–S distance varies from 2.36 to 2.39 Å, and the number of atoms of S nearest to Pt from 4.7 to 6.2. The observed variations of interatomic distances and coordination numbers, as well as high fitting uncertainty of the values (see Table 4), can be explained by the presence of varying amounts of two forms of Pt: the Pt-bearing solid solution with coordination number N S = 6, and PtS-like clusters with N S = 4 and a smaller interatomic distance R Pt–S = 2.31 Å. This assumption will be verified by LCF analysis of XANES spectra. To make results of EXAFS spectroscopy consistent with the XANES spectra analysis, the results of the EXAFS spectra fittings are discussed below in the order of the decrease of Pt oxidation state (from 4+ to 2+), which is traced by the decrease of the WL intensity given in the last column of Table 3.
In sample No. 5601 the absorbing atom is 6-fold coordinated with S atoms (PtS6 octahedra), and the value of R Pt–S ≈ 2.39 Å is the maximum Pt–S distance among the pyrrhotite samples studied. Considering this, we suppose that Pt in this sample presents dominantly in the lattice-bound state as the isomorphous solid solution while the contribution of PtS-like clusters is negligible. In sample No. 5602 we observed a slight decrease of Pt–S interatomic distance and the first sphere coordination number relative to sample No. 5601. However, the similarity of XANES spectra of these two samples implies that in sample No. 5602 Pt also exists mainly in the solid-solution form.
Analysis of the EXAFS spectra of samples No. 5592 and 5590 reveals a slight decrease of coordination number and interatomic distances down to N S ≈ 5.5 and R Pt–S = 2.37–2.36 Å, respectively, relative to sample No. 5601 where the Pt-bearing solid solution predominates. The decrease can stem from the formation of the second form of Pt – the PtS-like clusters. The formation of the clusters where Pt occurs in 2+ ‘formal’ oxidation state is consistent with the XANES spectra analysis.
For sample No. 5599 the considerable increase of the Debye–Waller parameter (σ2 = 0.007 ± 0.007 Å2), together with large uncertainties of the calculated values of N S and R Pt–S, can be explained by the presence of two forms of Pt − isomorphous solid solution (Pt4+) and Pt2+S-like clusters – with concentrations are close to each other.
Theoretical FDMNES modelling of XANES spectra
To facilitate discussion of FDMNES calculation results, the Fe1–xS structure and the cation local atomic environment are shown in Fig. 7. The pyrrhotite structure is represented by layers of hexagonal close-packed S atoms normal to the c axis. Full layers in which octahedra are occupied by Fe atoms alternate with the vacancy (or defective) layers. In the second coordination shell, metal atoms are surrounded by six Fe atoms at 3.43 Å (within each Fe layer) and two Fe atoms at 2.84 Å (within neighbouring Fe layers).
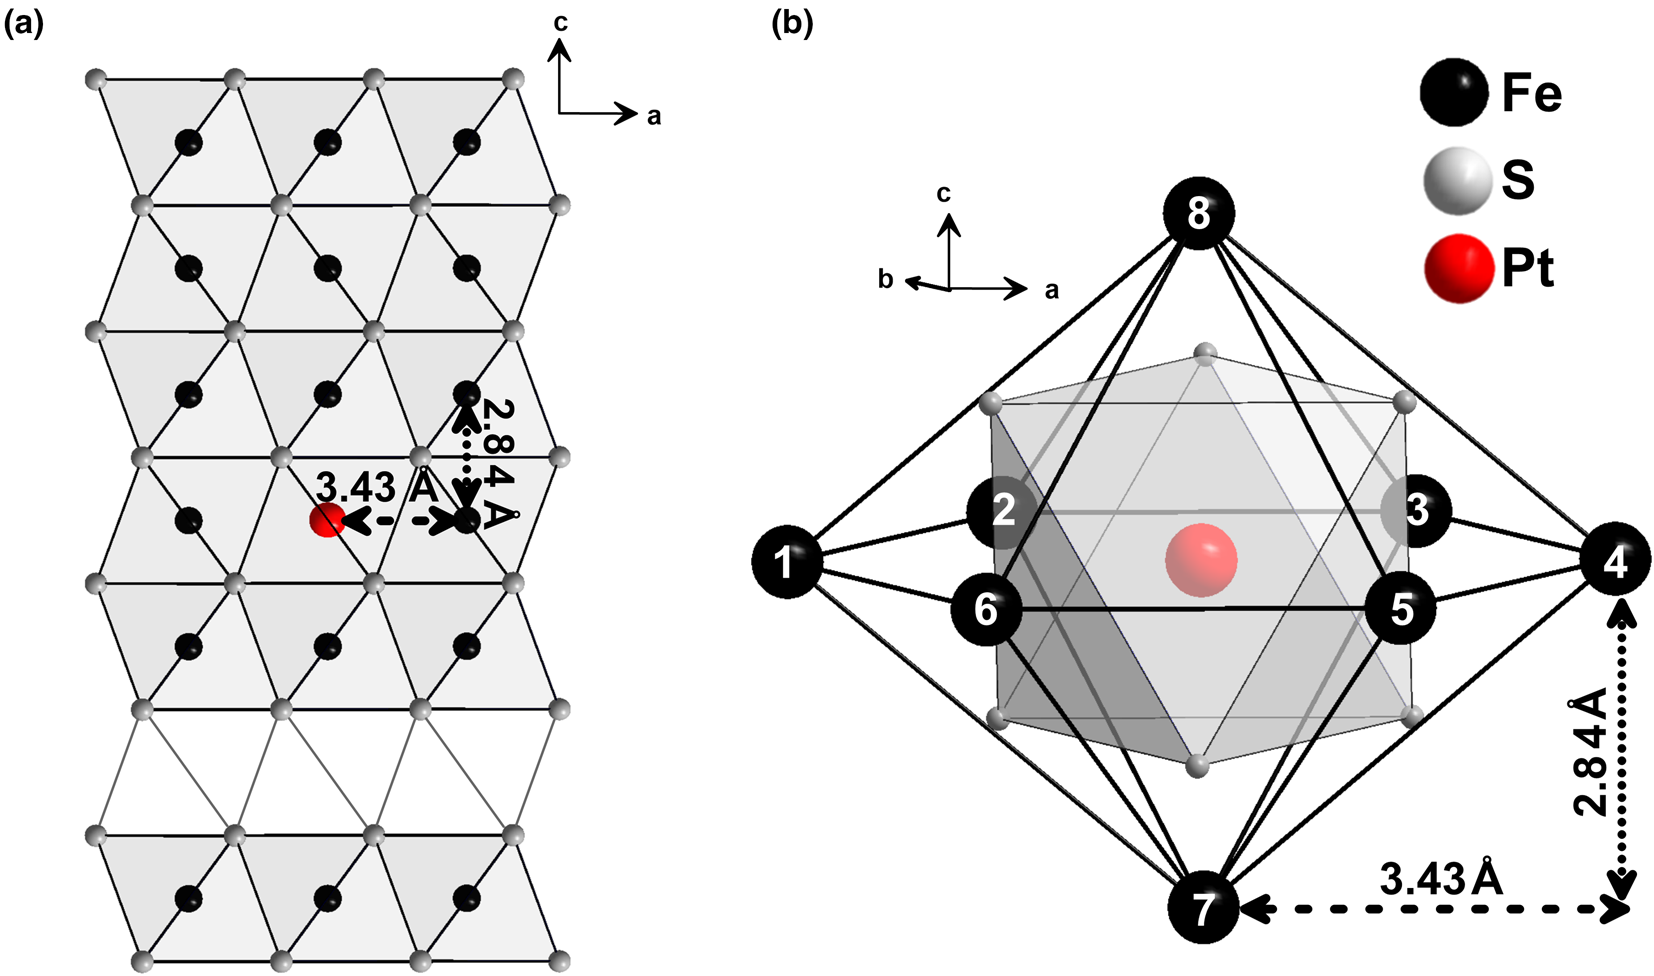
Fig. 7. (a) Crystal structure of Fe1–xS. (b) Cation local atomic environment. The vacancies in the Fe sites are ordered: the vacancy layer alternates with full layers normal to c. Metal atoms are surrounded by six Fe atoms at 3.43 Å (within each Fe layer) and two Fe atoms at 2.84 Å (within the neighbouring Fe layer). Crystallographic data are adopted from Wyckoff (Reference Wyckoff1963) and visualised using the program DIAMOND (Putz and Brandenburg, Reference Putz and Brandenburg2012).
The spectrum of Pt-bearing pyrite (Pt in the isomorphous solid-solution state, Filimonova et al., Reference Filimonova, Nickolsky, Trigub, Chareev, Kvashnina, Kovalchuk, Vikentyev and Tagirov2019) with EXAFS-determined parameters of a Pt local atomic environment up to ~4 Å was chosen as a reference. The calculated spectrum of the Pt-bearing pyrite is shown in Fig. 8a together with the experimental spectrum adopted from Filimonova et al. (Reference Filimonova, Nickolsky, Trigub, Chareev, Kvashnina, Kovalchuk, Vikentyev and Tagirov2019). The parameters of convolution, optimised for Pt-bearing pyrite, were then used to model the XANES spectra of Pt-bearing pyrrhotite.

Fig. 8. (a) Experimental Pt L 3-edge XANES spectrum of the solid solution Pt in pyrite (Fe,Pt)S2 (blue field, adopted from Filimonova et al., Reference Filimonova, Nickolsky, Trigub, Chareev, Kvashnina, Kovalchuk, Vikentyev and Tagirov2019) shown together with the spectrum calculated by FDMNES code (solid line). The energy origin is defined relative to the theoretical Fermi level. (b) Experimental Pt L 3-edge XANES spectrum of sample No. 5601 – the solid solution Pt in pyrrhotite (Fe,Pt)1–xS (blue field, this study) shown together with the spectra of models with different Pt–S interatomic distances (R Pt–S = 2.33, 2.36 and 2.39 Å) calculated by FDMNES code (solid lines). (c, d) Enlarged portions of spectra (b): WL and peak B region of Pt L 3-edge XANES, calculated and experimental spectra. E: The difference between peak B and WL (eV) as a function of the interatomic distance R Pt–S (Å), the dotted line corresponds to the regression through the experimental points. Circles - values obtained from calculated spectra, horizontal dashed line - value derived from the experimental spectrum No. 5601. The best fit of the experimental spectrum is obtained for Pt in the cation site surrounded by 6 S atoms at 2.36 Å.
The calculations aimed to study the effect of coordination number N s in the first coordination sphere, and the number of vacancies in cationic sublattice in the second coordination sphere on the shape of XANES spectra and positions of the spectral features. For these purposes, two series of calculations were performed. In the first, preliminary series, the interatomic distances varied from 2.33 to 2.39 Å, and the ‘best’ distance, which demonstrated the closest agreement between the calculated and experimental spectra of the solid solution Pt (sample No. 5601), was selected for further calculations. We fixed the ‘best’ Pt–S distance in the second series, but varied the number of S atoms in the first coordination sphere (from 6 to 4), and the number of vacancies in the second coordination sphere. The calculation results are shown in Supplementary Fig. A.3. The ‘best’ values are discussed below.
The effect of Pt–S distance on the calculated XANES
In this series, the coordination number was fixed as N s = 6: Pt substitutes for Fe in the structure of pyrrhotite. Three calculations were performed for various interatomic distances with R Pt–S values in the first coordination sphere of 2.33, 2.36 and 2.39 Å. The simulated spectra are compared to the spectrum of sample No. 5601 containing only isomorphous Pt in Fig. 8b. The increase of the R Pt–S distance resulted in a significant increase in the white line intensity (Fig. 8c). Additionally, due to a leftward shift (towards the lower energies) of the position of the second intense feature B (Fig. 8d) the energy difference ΔE between positions of the WL and peak B decreases with an increase of the Pt–S distance: ΔE(2.33 Å) > ΔE(2.36 Å) > ΔE(2.39 Å). Although none of the models describes all the features of sample No. 5601 spectrum precisely, we chose the interatomic distance, R Pt–S = 2.36 Å for further calculations because the energy interval between the main (WL) and the second (B) features in the calculated and experimental spectra are identical (Fig. 8e). The difference between the values of R Pt–S, determined by means of the XANES spectra simulations and EXAFS spectra fittings (2.36 Å vs. 2.39 Å), can be explained by the relatively high uncertainly of the theoretical XANES calculations method, which exceeds the uncertainty of the EXAFS spectra fitting procedure (±0.02 Å for the first coordination sphere, Table 4). However, the accuracy of the FDMNES simulations is sufficient to study the composition of the first and second coordination spheres.
The effect of NS (the first coordination sphere) and NFe (the second coordination sphere) on the calculated XANES
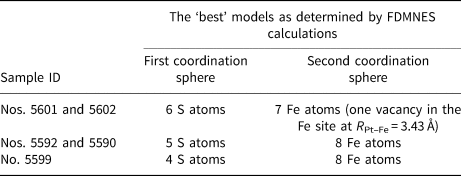
The ‘best’ simulated spectra are compared to the experimental ones in Fig. 9, and the ‘best’ models are presented in Table 5. Considering that Pt in pyrrhotite can exist in two forms: the isomorphous solid solution (N S = 6) and PtS-like clusters (N S = 4), we simulated XANES spectra for the first sphere coordination numbers N S = 6, 5 and 4. The decrease of the number of S atoms leads to the significant decrease of WL and peak B intensities of the simulated spectra (Supplementary Fig. A.3, calculations indicated by Nos. 1, 2 and 3). The spectra for Nos. 5601 and 5602 are best described by a model with Pt surrounded by 6 S atoms in the first coordination shell; Nos. 5590 and 5592 by 5 S atoms in the first coordination shell; and No. 5599 by 4 S atoms in the first coordination shell.
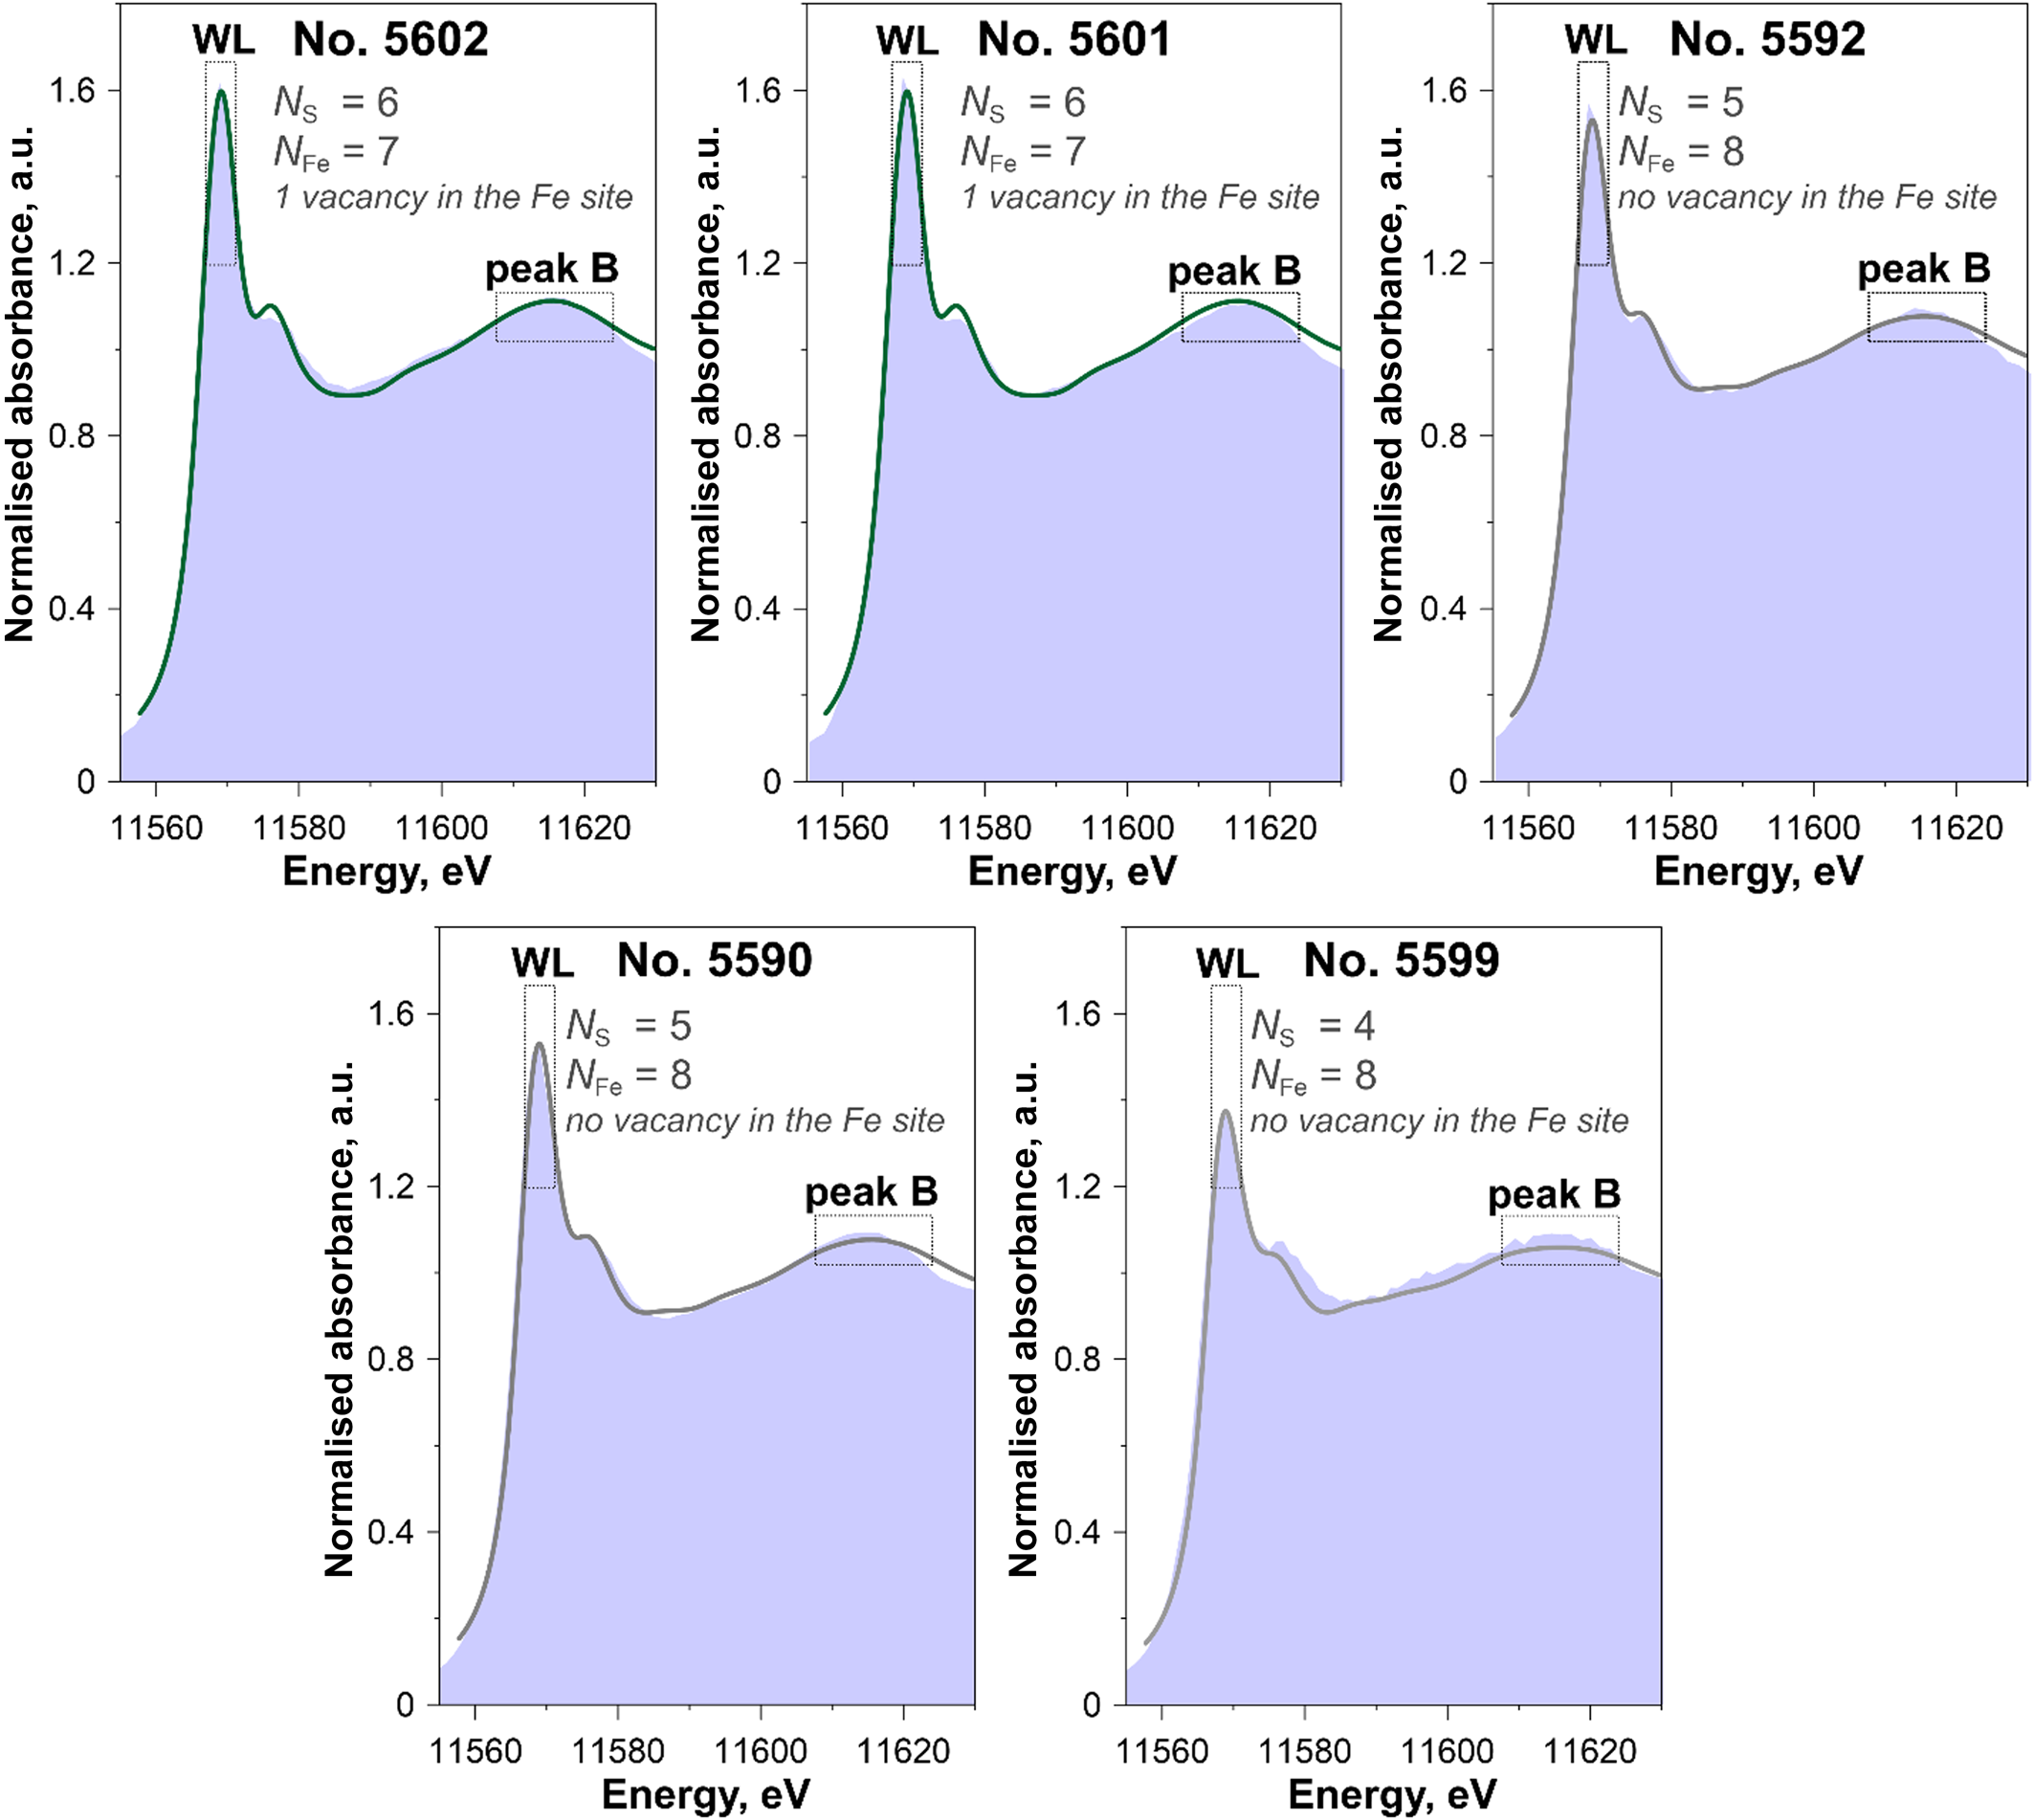
Fig. 9. Experimental Pt L 3-edge XANES spectra of samples studied (blue fields) shown together with the spectra of the ‘best’ models calculated by FDMNES code (solid lines) (the ‘best’ models are given in Table 5, all calculations are shown in Supplementary Fig. A.3). Experimental spectra Nos. 5602 and 5601 are best described by a model with Pt surrounded by 6 S atoms in the first coordination shell and 7 Fe atoms in the second coordination shell (vacancy in the Fe site at R Pt–Fe = 3.43 Å), Nos. 5590 and 5592 have 5 S atoms in the first coordination shell and 8 Fe atoms in the second coordination shell and No. 5599 has 4 S atoms in the first coordination shell and 8 Fe atoms in the second coordination shell.
Table 5. The ‘best’ models of Pt local atomic environment of studied pyrrhotite samples determined by means of the FDMNES simulations of Pt L 3-edge XANES spectra.
To test for the presence of Fe vacancies in the second shell around the excited Pt atom, the next series of simulations were performed for a model with one vacancy in the Fe site at R Pt–Fe = 3.43 Å (within each Fe layer, atom Nos. 1–6 in Fig. 7), and for another model – one vacancy at R Pt–Fe = 2.84 Å (within the neighbouring Fe layer, atom Nos. 7 and 8 in Fig. 7). The model with a vacancy in neighbouring Fe layer at a Pt–Fe distance of 2.84 Å (Supplementary Fig. A.3, calculations 7, 8 and 9) fails to reproduce the experimental spectra. The best agreement between the experimental and calculated spectra is achieved for the models with a vacancy within the Fe layer at R Pt–Fe = 3.43 Å (Supplementary Figure A.3, calculations 4, 5 and 6), or without vacancies. An attempt to use the models with two and three vacancies at R Pt–Fe = 3.43 Å failed to describe the experimental spectra: the intensity and positions of the peaks of calculated spectra differ significantly from the experimental ones (Supplementary Fig. A.3, calculation Nos. 7, 8 and 9). Accordingly, the spectra of pyrrhotite samples Nos. 5601 and 5602 (Pt is in the solid-solution state) are best described by a model with N s = 6 (first sphere) and N Fe = 7 (second sphere, one vacancy at R Pt–Fe = 3.43 Å). Formation of vacancies at R Pt–Fe = 2.84 Å (within the neighbouring Fe layer) and more than one vacancy at R Pt–Fe = 3.43 Å are ruled out.
The spectra of sample Nos. 5590 and 5592 are best described by a model with N S = 5 and N Fe = 8, and sample No. 5599 − by a model with N S = 4 and N Fe = 8. We note that the formation of the vacancy in the Fe site is not required to describe the experimental spectra of sample Nos. 5590, 5592 and 5599.
We tried to use the approach developed by Ballhaus and Ulmer (Reference Ballhaus and Ulmer1995) to quantify the substitution of Pt in pyrrhotite using their empirical equitation. The substitution mechanism suggested by Ballhaus and Ulmer (Reference Ballhaus and Ulmer1995) requires 4 to 6 vacancies in the Fe sublattice around the Pt site in our samples. This mechanism can be ruled out for two reasons: (1) it seems unrealistic in terms of the charge balance requirements, and (2) it contradicts results of the FDMNES modelling, which showed that experimental spectra can be described by the model with no more than one vacancy in the Fe sublattice.
Linear Combination Fit (LCF) analysis of XANES
The LCF analysis of XANES spectra was performed to quantify the ratio of Pt in the solid-solution state (Ptss) to PtS-like clusters (PtPtS) in the samples of Pt-bearing pyrrhotite. We used the spectra of the pyrrhotite sample containing ~0.3 wt.% Pt (No. 5601, solid solution Pt) and PtS(cr) as the reference materials. The former was chosen because, according to the analysis of the EXAFS spectra and FDMNES simulations, this sample appeared to contain only Pt in the solid-solution state, which means that the sample was free of PtS-like clusters. The results of the analysis are presented in Table 6 and shown in Fig. 10. Sample No. 5602 contains Pt mostly in the solid-solution state (~0.5 wt.% Pt), and the contribution of PtS-like clusters is insignificant. Pyrrhotite samples No. 5590 and 5592 contain up to 0.3 wt.% Pt in the solid-solution state and up to 800 ppm Pt in the PtS-like clusters (~25% of the total Pt amount). Sample No. 5599 contains ~60 ppm Pt in the solid-solution state and ~120 ppm Pt in the PtS-like clusters (~65% of the total amount). In general, with increasing sulfur fugacity, the fraction of isomorphous Pt in pyrrhotite increases from ~100 ppm to 0.3 wt.% at 650°С and 0.5 wt.% at 720°С, whereas the fraction of PtS-like clusters drops significantly with the increase of temperature from 650 to 720°С.
Table 6. Results of Linear Combination Fit (LCF) analysis of Pt L 3-edge XANES spectra in μ(E) space performed using the Athena program. Uncertainties are calculated by Athena.
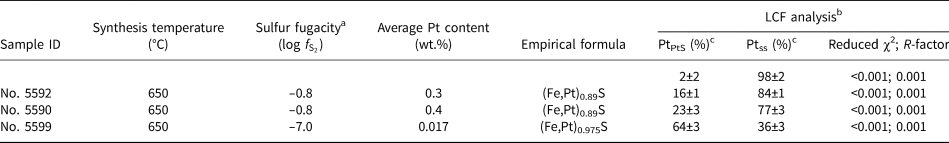
a Sulfur fugacity was determined using diagram shown in Fig. 4; benergy range 11,550–11,625 eV; cPtPtS – PtS fraction, Ptss – Pt solid-solution fraction.
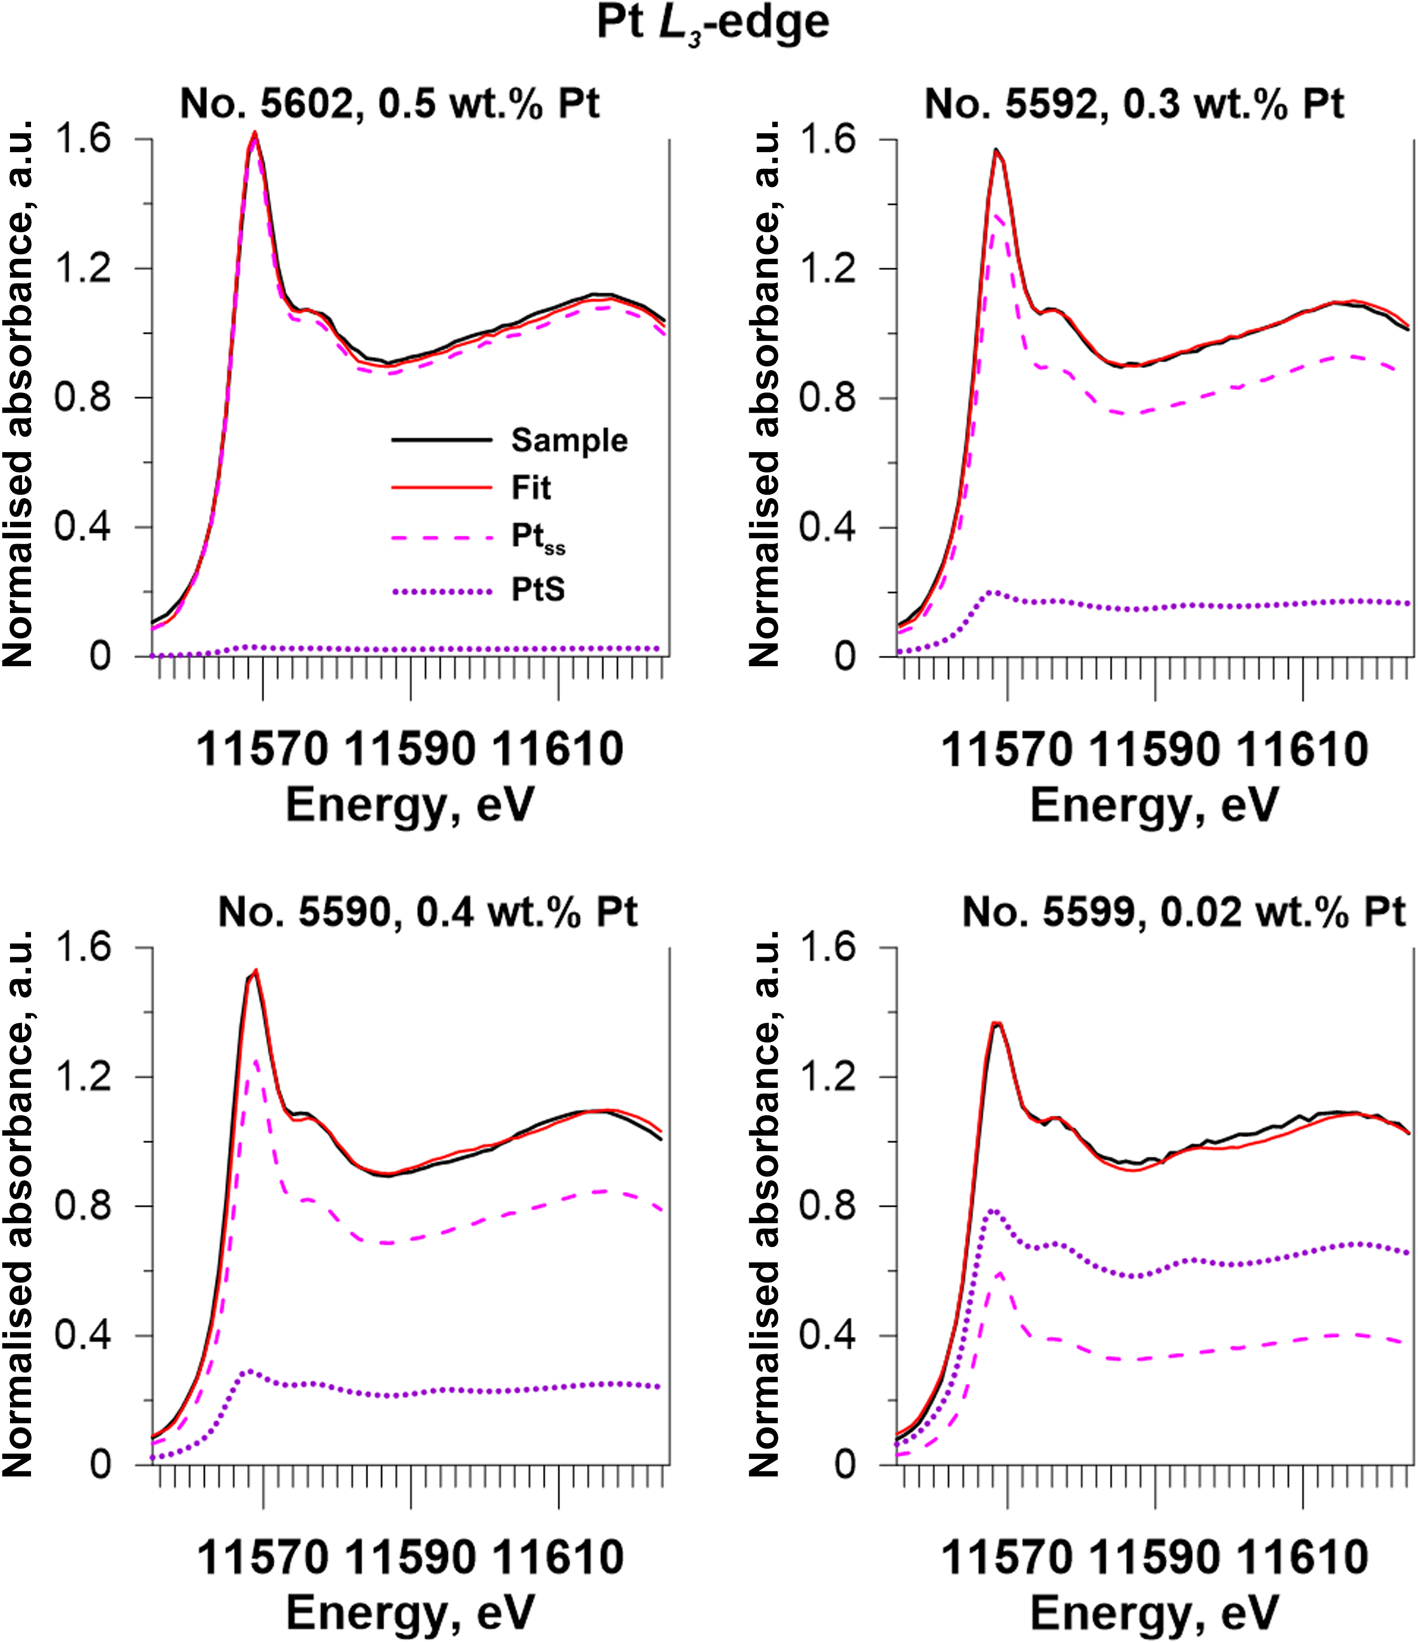
Fig. 10. Results obtained via Linear Combination Fit (LCF) modelling of Pt-bearing pyrrhotites XANES spectra. Solid black lines – experiment, solid red lines – fit results, dashed pink lines – Pt in the solid solution (Ptss, sample No. 5601), and dotted violet lines – PtS(cr).
On the basis of our previous results obtained for Pt-bearing pyrites (Filimonova et al., Reference Filimonova, Nickolsky, Trigub, Chareev, Kvashnina, Kovalchuk, Vikentyev and Tagirov2019), we consider the PtS-like clusters to be a product of the solid-solution decomposition. Thus, the results of LCF analyses show that isomorphous Pt in pyrrhotite synthesised at relatively high sulfur fugacity at T = 720°C (sample No. 5602) withstands cooling. At the same time, the cooling of pyrrhotite obtained at relatively low sulfur fugacity at T = 650°C (sample No. 5599) results in partial decomposition of isomorphous solid solution and redistribution of Pt into the PtS-like clusters.
Conclusions and implications
To determine the state of Pt in pyrrhotite in the present study, we synthesised pyrrhotite samples with Pt content from 0.004 to 0.12 at.%. Analysis of Pt L 3-edge XANES spectra revealed two groups of samples with different states of Pt. In the first group Pt exists mostly in the 4+ ‘formal’ oxidation state. The second group of samples contain admixture (up to ~20% of total Pt) of Pt2+. Additionally, one sample contains Pt in 4+ and 2+ ‘formal’ oxidation states in similar concentrations. Theoretical modelling of XANES and interpretation of EXAFS spectra showed that Pt4+ substitutes for Fe in the crystal structure of pyrrhotite, whereas Pt2+ forms PtS-like clusters disseminated in the pyrrhotite matrix. It was found that an increase of $f_{{\rm S}_ 2}$ resulted in an increase of Pt content in pyrrhotite. At high sulfur fugacity up to 0.5 wt.% Pt substitutes for Fe in the pyrrhotite structure (temperature ≈700°C, the system is saturated with respect to PtS(cr)). Additionally, when the sulfur fugacity in the experimental system was high (–0.8 < log $f_{{\rm S}_ 2}$
 < –0.1 at 700°C, determined using $f_{{\rm S}_ 2}$
 −1000/T diagram from Toulmin and Barton, Reference Toulmin and Barton1964), the Pt-bearing isomorphous solid solution withstood subsequent cooling to ambient temperature. At relatively low sulfur fugacity, the cooling of pyrrhotite resulted in partial decomposition of the isomorphous solid solution. In our samples synthesised in the systems of low sulfur fugacity, up to 20% of Pt (log $f_{{\rm S}_ 2}$
 ~ –0.8) and 60% of Pt (log $f_{{\rm S}_ 2}$
 ~ –7.0) were redistributed into the PtS-like clusters with a decrease of temperature. Both the increase of the Pt concentration and the absence of decomposition of the Pt solid solution during cooling in the systems with high sulfur fugacity imply that the high $f_{{\rm S}_ 2}$
 stabilises Pt in pyrrhotite in the solid-solution state.
As determined by Pt L 3-edge EXAFS spectra fitting, an atom of isomorphous Pt in pyrrhotite is surrounded by 6 S atoms at a distance of ~ 2.39 Å. Despite the closeness of Pt4+ and Fe2+ ionic radii (0.625 Å of Pt vs. 0.61 Å of Fe, Shannon, Reference Shannon1976), the Me–S distance decreased from 2.43 to 2.39 Å when Pt substituted for Fe in the pyrrhotite structure. The Pt–S interatomic distance obtained is close to that in PtS2 (N S = 6, R Pt–S = 2.39 Å), however the absence of a notable contribution from the distant coordination shells around the absorbing Pt atom implies that this form of Pt is different from PtS2 inclusions and can be ascribed to the isomorphous solid solution. The weak contribution of the distant coordination shell atoms to the EXAFS signal can be accounted for by the complex incommensurate crystal structure of pyrrhotite. Several samples exhibited the decrease of the Pt first sphere coordination number and interatomic distances relative to the isomorphous Pt; in one sample a substantial increase of the Debye–Waller parameter was observed. These facts can be explained by the presence of PtS-like clusters (for PtS(cr) N S = 4 and R Pt–S = 2.3 Å, Table 4).
Results of theoretical FDMNES simulations of XANES spectra are consistent with the data obtained by means of LCF XANES and EXAFS fitting. The XANES spectra of samples synthesised at high $f_{{\rm S}_ 2}$ , where the isomorphous solid solution predominates, are best described by a model with 6 S atoms surrounding the excited Pt atom in the first coordination sphere and 7 Fe atoms in the second sphere at 3.43 Å (one vacancy in the Fe sublattice). Due to the presence of the PtS-like clusters in other samples, synthesised at low $f_{{\rm S}_ 2}$
 , the average number of S atoms surrounding the excited Pt atom decreased to 5 (log $f_{{\rm S}_ 2}$
 ~ –0.8, T = 650°C) and to 4 (log $f_{{\rm S}_ 2}$
 ~ –7.0, T = 650°C). In samples with the PtS-like clusters, a vacancy in the Fe sublattice was not observed. However, the effect of the vacancy on the XAS signal can be masked by the contribution from the PtS-like clusters. Therefore, only samples with negligible content of PtS-like clusters provide unambiguous information about the composition of the second coordination sphere of Pt, where one vacancy at the Fe site was detected.
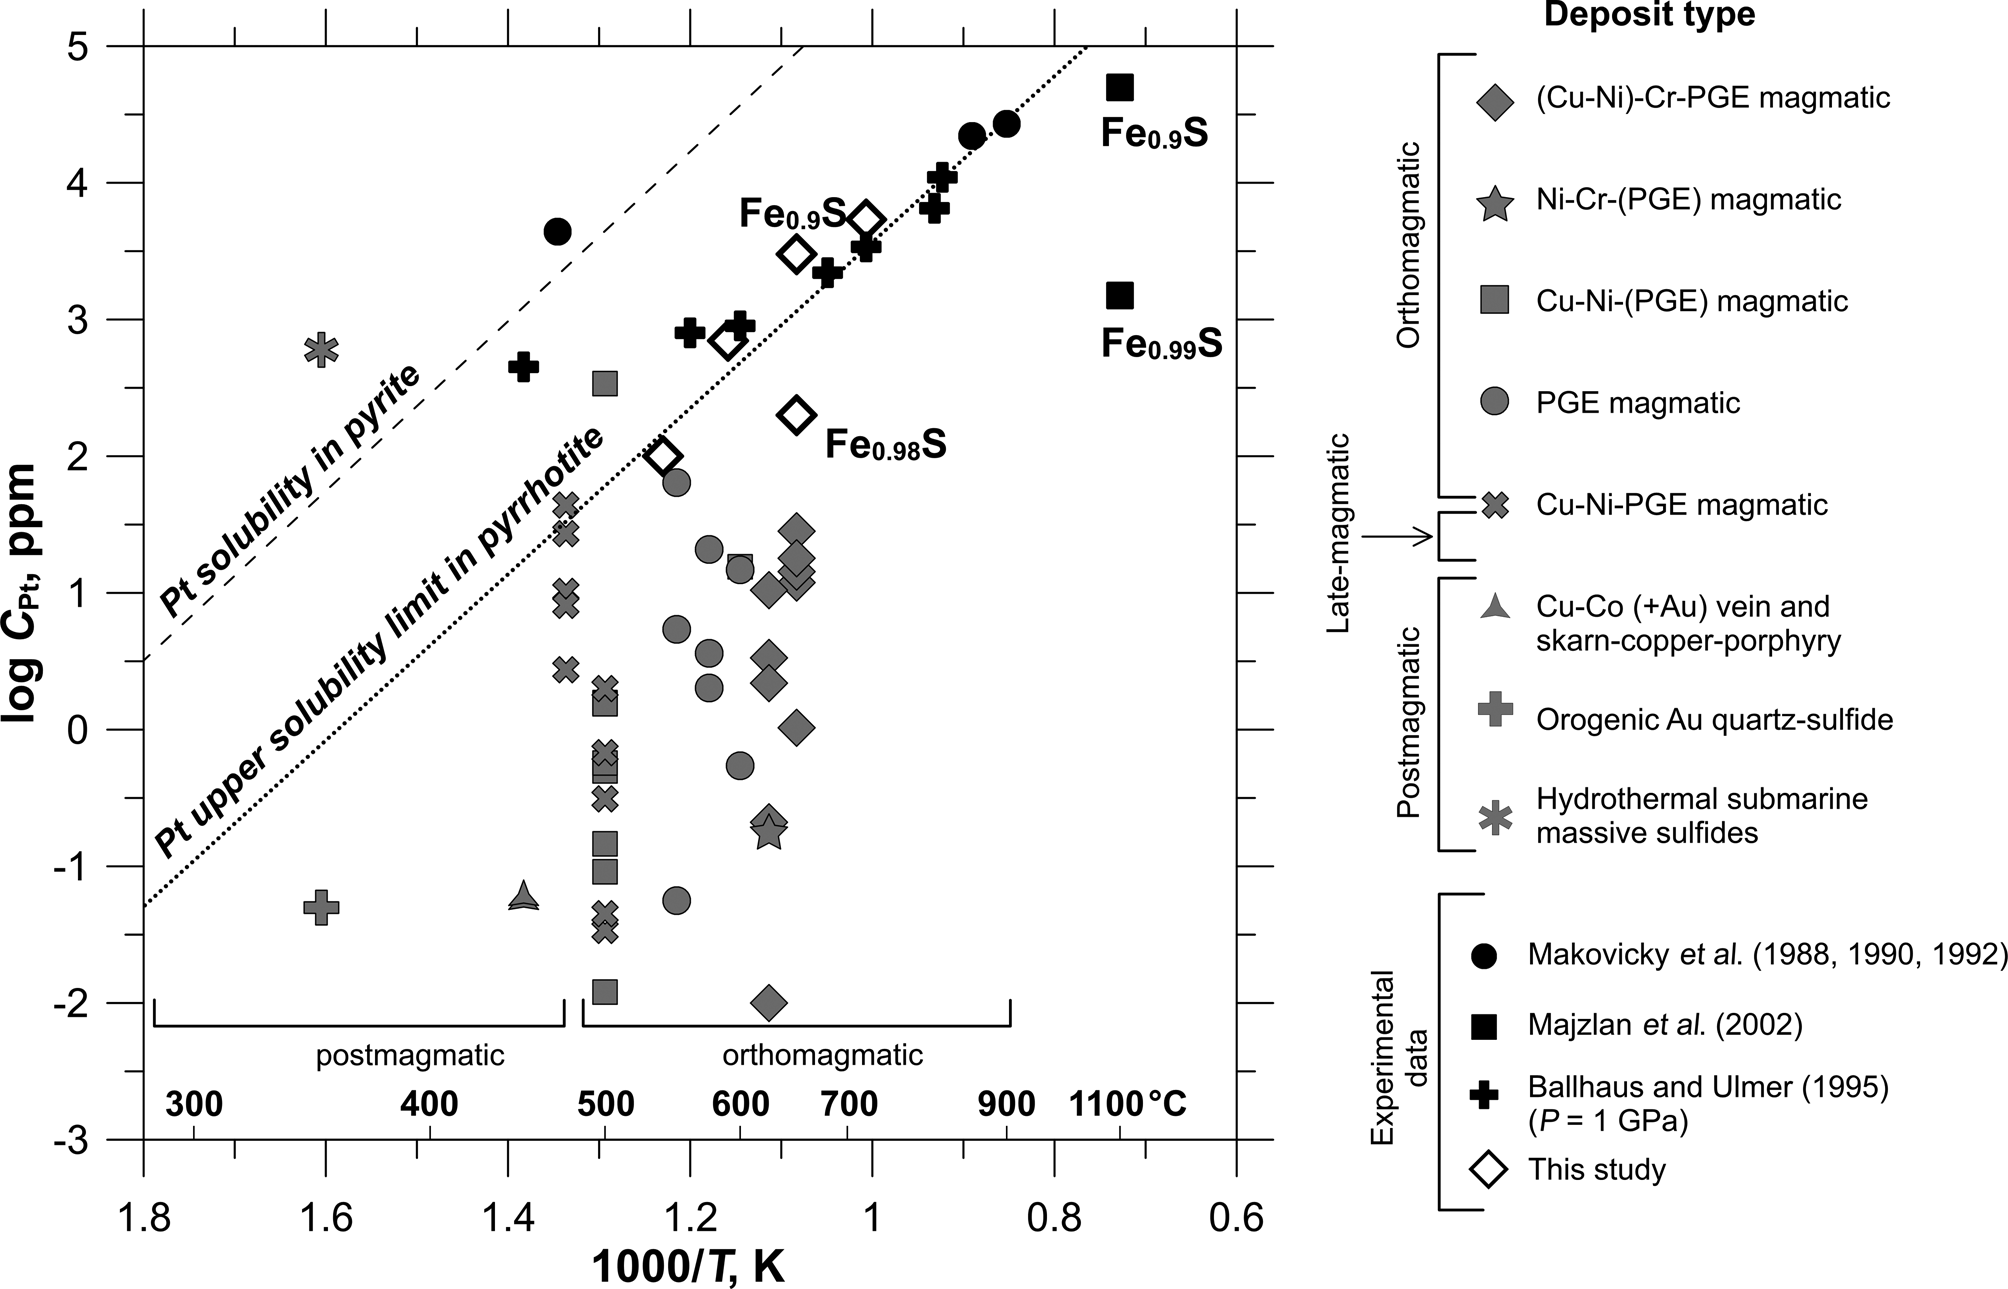
In general, the results of XAS spectroscopy and ab initio FDMNES modelling demonstrate that sulfur fugacity and temperature control the solubility of Pt in pyrrhotite. Compilation of the present study results and literature data on the concentration of Pt in synthetic and natural pyrrhotites (Fig. 11) shows that a decrease in temperature leads to a significant drop in Pt solubility. The maximum content of the solid-solution Pt in pyrrhotite can be approximated by a straight line in the log C(Pt) vs. 1/T plot. According to data presented in Fig. 11, the solubility limit of Pt in pyrrhotite increases from 1 ppm at 350°C to 3 wt.% at 900°C. As pyrrhotite is commonly the main base-metal sulfide, dominating among the ore minerals, the solid-solution Pt makes a noticeable contribution to the total balance of platinum, especially in high-temperature PGE and nickel/ Cu-Ni sulfide ores. It is interesting to note that the effect of temperature on the solubility of Pt in pyrite and pyrrhotite is described by parallel lines, with the solubility in pyrite being ~50 times higher than the Pt solubility limit in pyrrhotite.

Fig. 11. The content of Pt in pyrrhotite as a function of the approximate formation temperature. Pyrrhotite sketch diagram is built using literature data from Table 1 and experimental data of this study given in Table 2 and Supplementary Table A.3. The solid line shows the inferred solubility limit of Pt in pyrrhotite. The values, which lie above the line, are presumed to be oversaturated with respect to isomorphous Pt. The solubility of Pt in pyrite adopted from Filimonova et al. (Reference Filimonova, Nickolsky, Trigub, Chareev, Kvashnina, Kovalchuk, Vikentyev and Tagirov2019) is shown by the dashed line for comparison.
Acknowledgements
The authors thank the ESRF for the beamtime allocation under proposal No. 20-01-782 (ROBL). We thank V. Abramova for the analyses of synthesised minerals using LA-ICP-MS. Chemical analyses were performed at the “IGEM-Analytica” Center for Collective Use (EPMA, SEM). We thank A. Shiryaev for inclusion of our samples in the ESRF experiment, and for the analyses of synthesised minerals using XRD in the Center of Collective Use for Physical Analytical Methods, Frumkin Institute of Physical Chemistry and Electrochemistry, RAS. The helpful comments of two anonymous reviewers are gratefully acknowledged. The study was supported by the Russian Science Foundation grant No. 20-17-00184 (XAS experiment, theoretical spectra simulations, interpretation of the experimental and theoretical data); Russian Foundation for Basic Research grant No. 20-35-70049 (synthesis experiments and chemical analyses of the synthetic crystals); Russian Foundation for Basic Research grant No. 20-05-00849 (collection and interpretation of natural ore compositions);and Russian Ministry of Science and Education grant No. 075-15-2019-1891 (XAS experimental set-up).
Supplementary material
To view supplementary material for this article, please visit https://doi.org/10.1180/mgm.2021.76