INTRODUCTION
Catechol O-methyltransferase (COMT) is one of the two main enzymes that metabolize dopamine. A common functional polymorphism at codon 158 in the gene controlling COMT results in a valine (Val) to methionine (Met) amino acid substitution (Val158Met) and is associated with substantial differences in enzyme activity. Homozygosity for the low-activity (met) allele leads to a 3–4-fold reduction in enzymatic activity, compared with homozygosity for the high activity (val) allele. Heterozygosity is associated with intermediate levels of enzyme activity. Because of its relevance to dopamine metabolism and prefrontal cortical function, the COMT 158 polymorphism has been investigated as a candidate gene for various psychiatric and behavioral disorders, including bipolar affective disorder as well as susceptibility for anxiety and dysphoric mood (Enoch et al., 2003). Whereas the results vary somewhat across studies, there is growing evidence that COMT genotype also influences performance on measures of “prefrontal” functions such as higher order executive processes like attention, working memory, or concept formation (for a review see Tunbridge et al., 2006). Given the functional heterogeneity of frontal lobe systems and their complex modulation, further specification of COMT-related behavioral phenotypes could be valuable.
The subjects included in this study were part of an ongoing study about the COMT genotype influence on neurocognitive performance and aggression in 100 healthy controls dealing with the complimentary effects of dopamine on DLPFC-mediated stability and OFC-mediated flexibility. Additional to our primary goal of using neurocognitive tasks of higher order executive processes we were interested in further specification of COMT-related behavioral phenotypes such as emotion recognition, which was not investigated until now. The expression of emotions and the ability to recognize facial expressions of emotions in other people is an important component of interpersonal communication in humans (Davidson & Goldsmith, 2003; Ekman et al., 2003;). Impairments in these dimensions of emotion processing have been described since the earliest conceptualization (Bleuler, 1950). For example, numerous studies established that people diagnosed with schizophrenia have decreased recognition of facial emotions (reviews: Edwards et al., 2001; Mandal et al., 1998; Morrison et al., 1988), but the degree to which expression and recognition of emotions represent separable dimensions of emotional processing remains to be elucidated. Recently, we have described the association between emotion recognition abilities and affective flattening in stable schizophrenia (Gur et al., 2006).
Until now, no study has investigated the influence of COMT genotype on facial emotion recognition. Because gender differences in emotion recognition tests have been demonstrated in healthy subjects (reviewed in Kring & Gordon, 1998), we tested the association between genetic polymorphism and facial affect recognition for both sexes separately.
METHODS
A total of 100 healthy students (49 men and 51 women) were recruited from the local university. After complete description of the study, all subjects provided written informed consent in accordance with the Ethics Committee of Innsbruck Medical University. Participants underwent diagnostic examination using the Structural Clinical Interview for DSM-IV (Spitzer et al., 1990) to exclude those with current or past psychiatric or neurologic disorders, as well as substance abuse. All subjects were tested on a Battery of Emotion Identification and Discrimination Tasks.
Penn Emotion Recognition Test (ER40)
The ER40, a computer based test, assesses categorical identification of facial expressions of emotion (Kohler et al., 2004). Stimuli are color photographs of faces for which subjects are asked to choose the most appropriate emotion label from a list of five emotion labels (happiness, sadness, anger, fear, or no emotion) without time limit for a response. This study used eight expressions of each emotion (50% of low and 50% of high intensity) and eight neutral expressions, for a total of 40 expressions. Across emotional categories, stimuli are balanced for poser's gender and ethnicity with 21 whites and 19 non-white faces. The validity of the emotion expressed was established in a sample of raters (Gur et al., 2002). Standard instructions were followed by a demonstration of the task and practice. In a previous study the intraclass correlation coefficient for the test-retest reliability of the ER40 was 0.83 (unpublished data from a longitudinal study from the University of Pennsylvania of 17 healthy controls who took ER40 at least twice).
The Penn Emotion Acuity Test (PEAT)
Participants are presented with 40 black and white photographs displaying happy (10 faces), sad (10 faces) or neutral expressions (20 faces) and are asked to rate the emotional valence of the expression on each face using a seven category scale: very sad, moderately sad, slightly sad, neutral, slightly happy, moderately happy, and very happy (Erwin et al., 1992). Choices are displayed on the screen along with the stimuli, and subjects respond by using the computer mouse to select one of the seven labels. The dependent performance measure was the number of responses that are either correct or within one point from the correct response.
Emotion Differentiation Task (EMODIFF)
In the EMODIFF participants have to decide if one of two faces, which are displayed on the screen, expresses an emotion (happiness or sadness) more intensely, or whether they are equally emotional (Kohler et al., 2000). The difference between the expressions in each pair of faces is very small and only happy or sad faces are used. The participants have to click on the face that shows the more intense emotion or on a box saying both faces are equally sad/happy. The outcome measures are the total number of correct, number of happy faces discriminated correctly and the number of sad faces discriminated correctly.
Genotyping
DNA was extracted from individual saliva swabs using a modified Chelex method. 1.25 mL of a solution containing 5% Chelex (Biorad, Hercules, CA, USA) and 200 μg/mL Proteinase K (Roche, Mannheim, Germany) were added to the saliva swab placed in a 1.5-mL microcentrifuge tube. The solution was incubated at 55° C for 30 min. The mixture was vortexed and incubated again at 90°C for 8 min. After centrifugation at ×13,000g for 5 min, the supernatant was transferred to a MultiScreen PCR96 cleanup plate (Milipore, Billerica, MA, USA), which was used for DNA purification following the manufacturer's recommendations. PCR was conducted in a Gene Amp PCR System 9700 (Applied Biosystems, Foster City, CA, USA) in a total volume of 10 μL containing 1 × Advantage 2 SA buffer (BD Biosciences Clontech, Uppsala, Sweden), 200 μM each dNTP, 250 nM each of the primers (5'-GTCAGGCATGCACACCTTGTCCTTCA-3′, 5-CCGACTGTGCCGCCATCAC-3′, Proligo, Boulder, CO), 1 × BD Advantage 2 Polymerase Mix (BD Biosciences Clontech) and 2 μL purified DNA solution. Amplification comprised an initial denaturation step at 95°C for 2 minutes, followed by 40 cycles of 15 seconds at 95°C, 30 seconds at 68°C and 15 seconds at 68°C. The final extension step was carried out at 68° for 10 min.
PCR products were analyzed by ion-pair reversed-phase high performance liquid chromatography electrospray ionization time-of-flight mass spectrometry (ICEMS). A detailed description of the instrumental setup can be found in Oberacher et al. (2005a; 2005b). Allele-specific information was gathered from accurate molecular mass measurements of the denatured PCR products. Matching of the measured molecular masses to the theoretical molecular masses derived from the amplicon sequences of the two COMT variants enabled the calling of the present allelic state(s).
Statistical Analyses
The effect of genotype on recognition performance of different emotions was investigated by one-way ANOVA. Post-hoc pairwise comparisons of individual genotypes were performed when the ANOVA had yielded at least trend-level significance (p < .1). Results of the latter analyses are reported as uncorrected and Bonferroni corrected p-values.
In order to obtain a more detailed picture of the performance of male and female subjects, separate analyses for the two sexes were performed additionally.
RESULTS
Genetic analyses identified 17 met/met subjects (9 men (18%); 8 women (16%)), 58 met/val subjects (32 men (65%); 26 women (51%)) and 25 val/val subjects (8 men (16%); 17 women (33%)). There was no significant deviation from Hardy-Weinberg equilibrium (an indication of population stability), either in the overall distribution or among female subjects. However, among male subjects there was a statistically significant deviation from Hardy-Weinberg equilibrium (χ2 = 4.61, df = 1, p < .05). All subjects were White, native German speakers and university students. The mean age (± standard deviation) for women was 25.2 ± 4.6 years and for men 24.8 ± 2.7 years (t-test: p = .563).
Penn Emotion Recognition Test (ER40)
Overall analysis of emotion recognition performance on the ER40
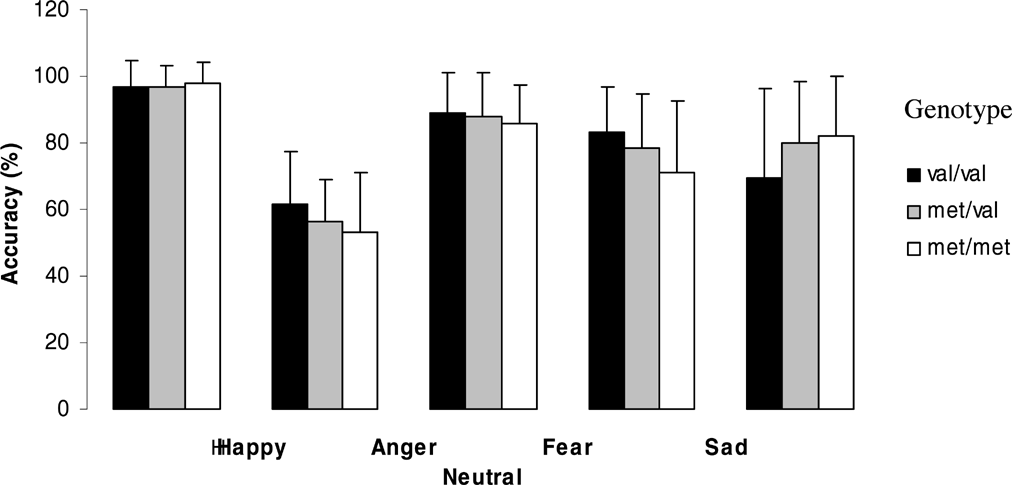
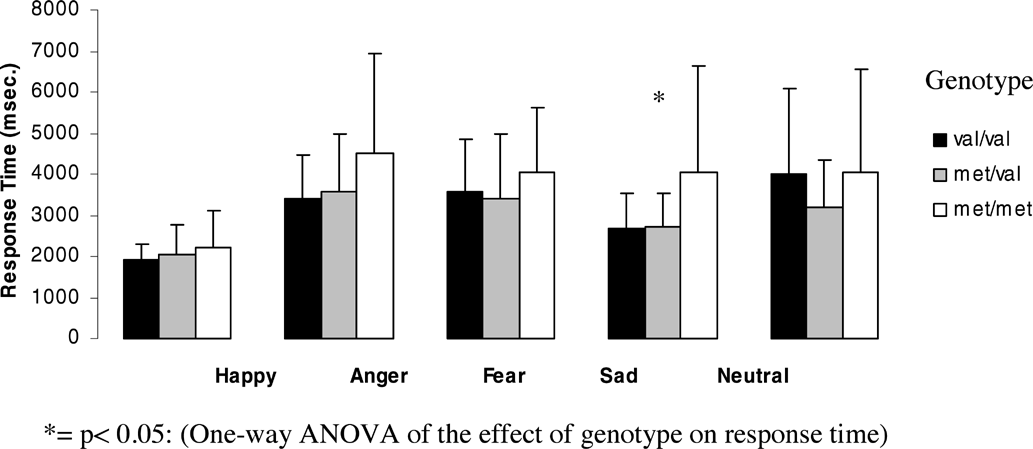
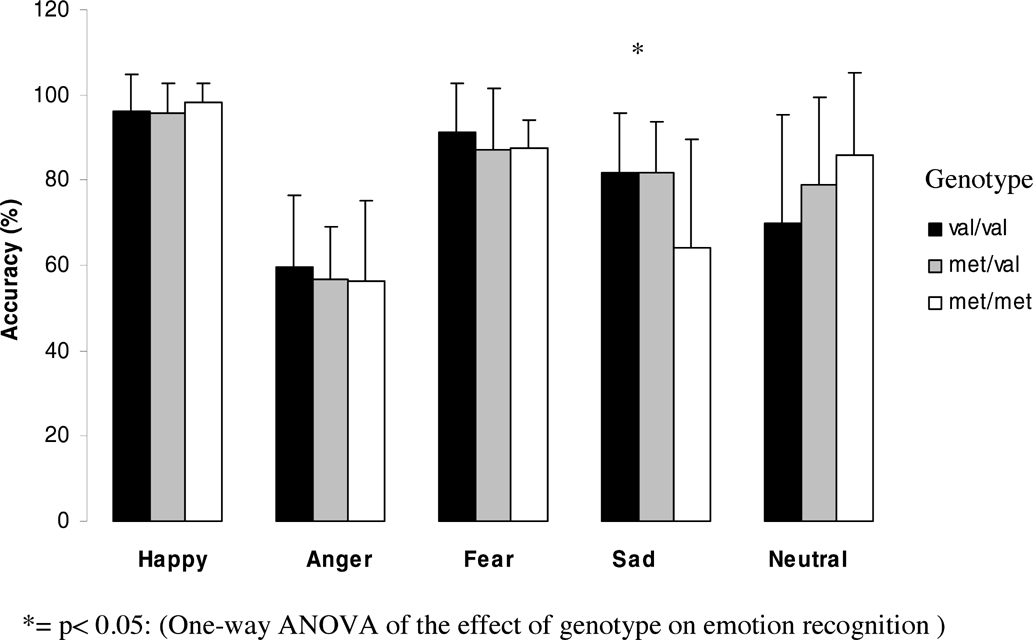
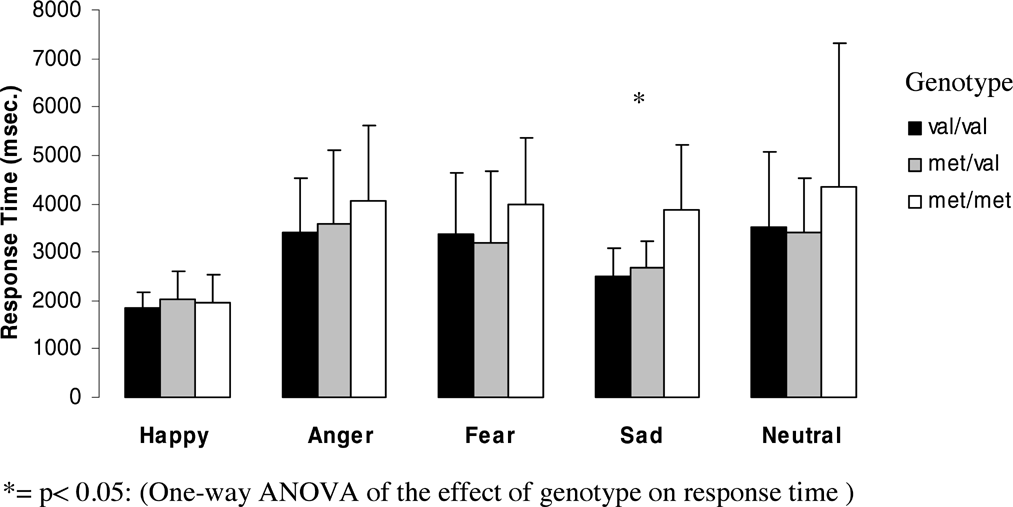
Figures 1 and 2 (means and standard deviations) illustrate emotion recognition performance and reaction time as a function of genotype for the whole group:

Effect of genotype on emotion recognition abilities for the whole group.
Effect of genotype on response time for each emotion for the whole group.
The effect of genotype on emotion recognition showed a trend towards significance for sad emotion (F = 2.5, df = 2, p = .089) and neutral faces (F = 2.8, df = 2, p = .066). Recognition of sad faces was significantly better in Val homozygotes than in Met homozygotes (p = .028), whereas recognition of neutral faces was significantly better in Met homozygotes compared to heterozygotes (p = .035) and there was a trend towards significance compared to Val homozygotes (p = .051). However, none of these results could withstand Bonferroni correction.
The effect of genotype on response time for each emotion showed significant differences for sad faces (F = 7.4, df = 2, p = .001) and a trend towards significance for angry faces (F = 3.02, df = 2, p = .054) and neutral faces (F = 3.04, df = 2, p = .052). Met homozygotes showed significantly slower reaction times for sad faces than Val homozygotes (p = 0.01, after Bonferroni correction p = .03) and heterozygotes (p = .0001, after Bonferroni correction p = .001). Also for angry faces, Met homozygotes showed significantly slower reaction times than Val homozygotes (p = .025) and heterozygotes (p = .029).
For neutral faces, heterozygotes showed significantly faster reaction times than Val homozygotes (p = .044) and a trend towards faster reaction times than Met Homozygotes (p = .065), but none of these results could withstand Bonferroni correction.
Separate analyses for male and female subjects for the ER40
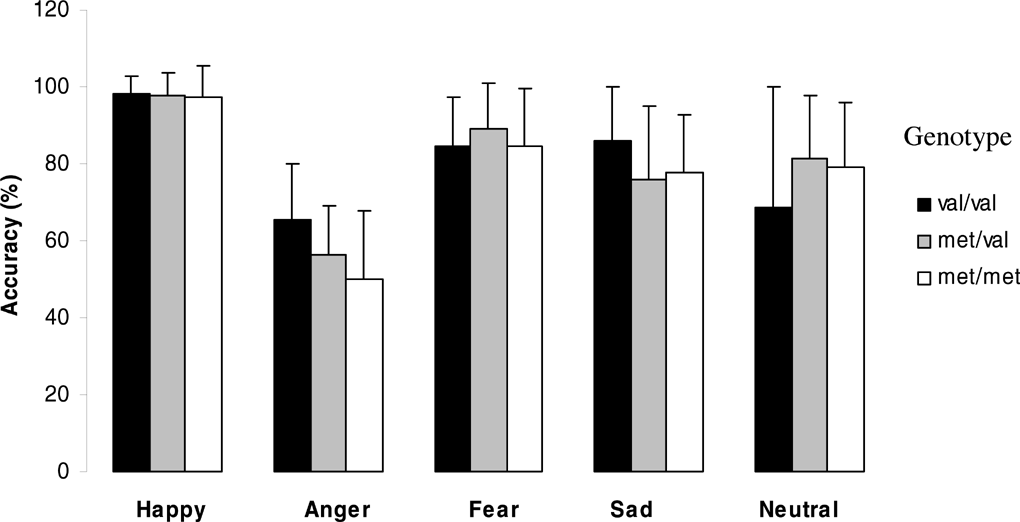
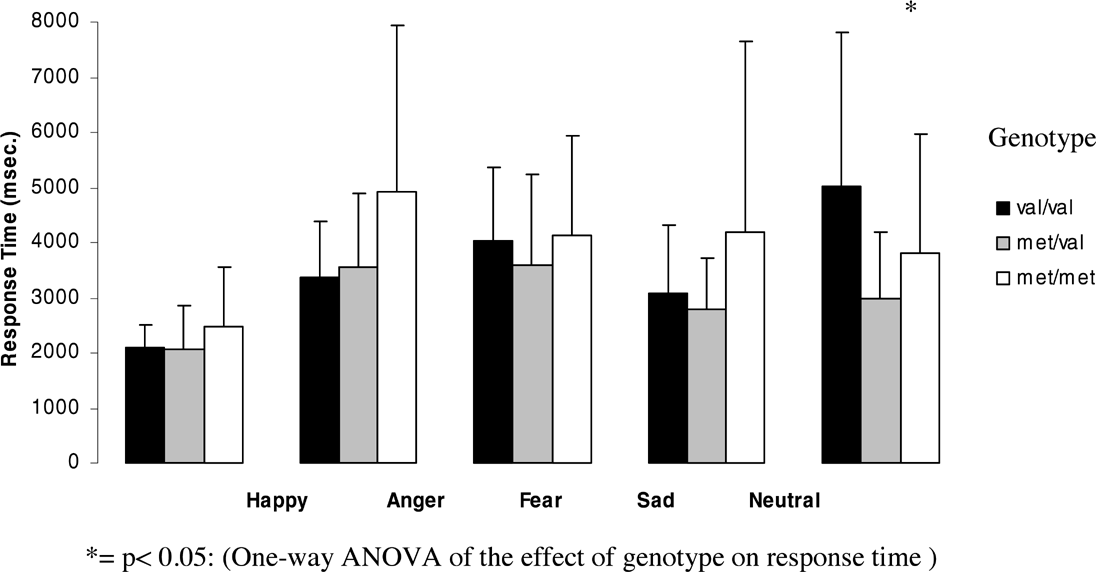
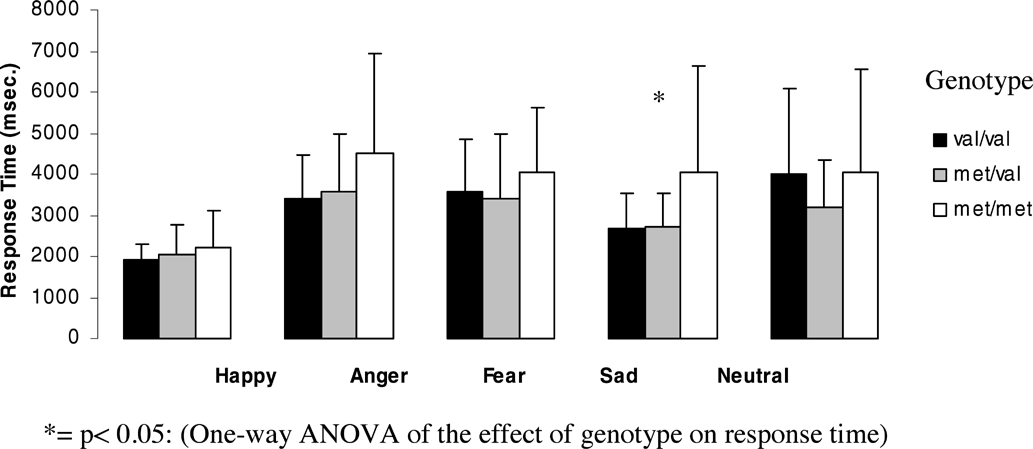
Figures 3 and 4 (means and standard deviations) illustrate emotion recognition performance and reaction time as a function of genotype in men:

Effect of genotype on emotion recognition abilities in men.
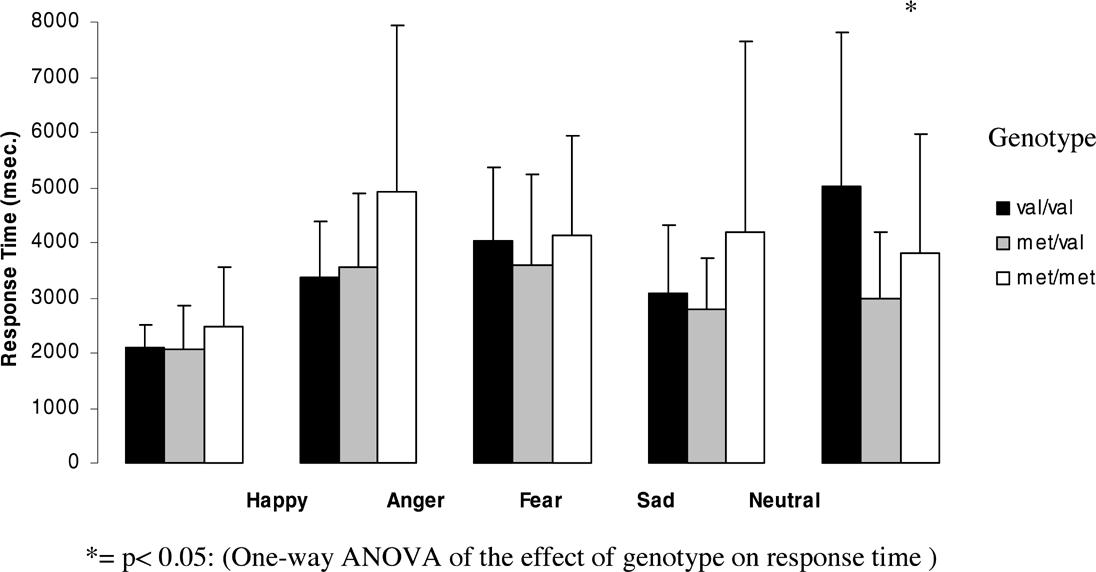
Effect of genotype on response time for each emotion for men.
In men. The effect of genotype on emotion recognition showed a trend towards significance for angry emotion (F = 2.6; df = 2; p = .086); recognition of angry faces was significantly better in Val homozygotes than Met homozygotes (p = .028).
The effect of genotype on response time was significant for neutral faces (F = 4.78, df = 2, p = .013) and showed a trend towards significance for angry faces (F = 2.56, df = 2, p =.089). For angry faces Met homozygotes showed significantly slower reaction times than heterozygotes (p = .037) and a trend towards slower reaction times than Val homozygotes. However, none of these results could withstand Bonferroni correction. For neutral faces, heterozygotes showed significantly faster reaction times than Val homozygotes (p = .004, after Bonferroni correction p = .0121) No significant differences between genotypes were found for the other emotions.
Figures 5 and 6 (means and standard deviations) illustrate emotion recognition performance and reaction time as a function of genotype in women:
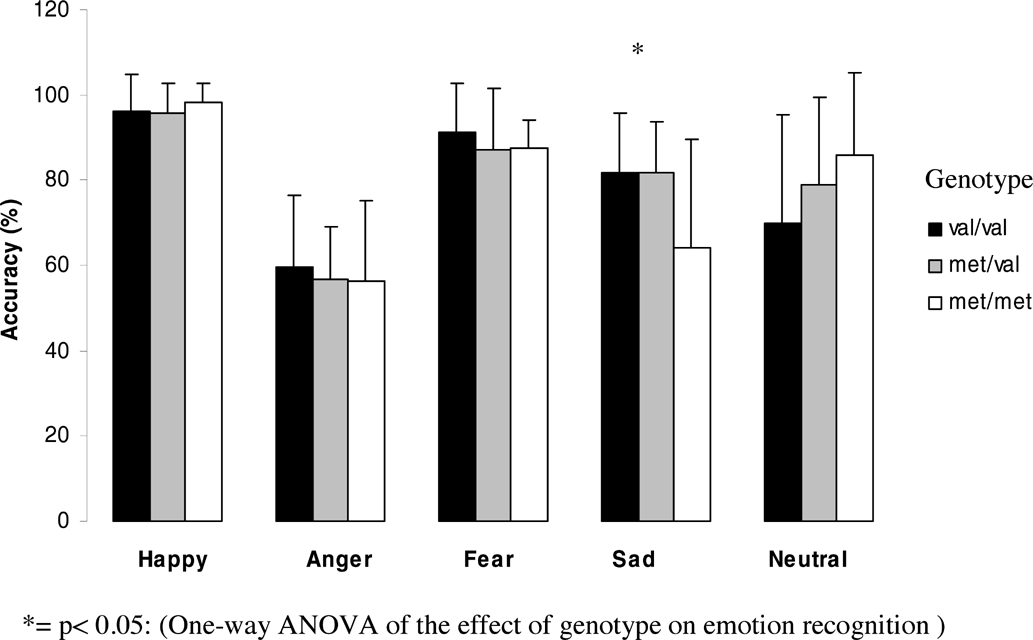
Effect of genotype on emotion recognition abilities in women.
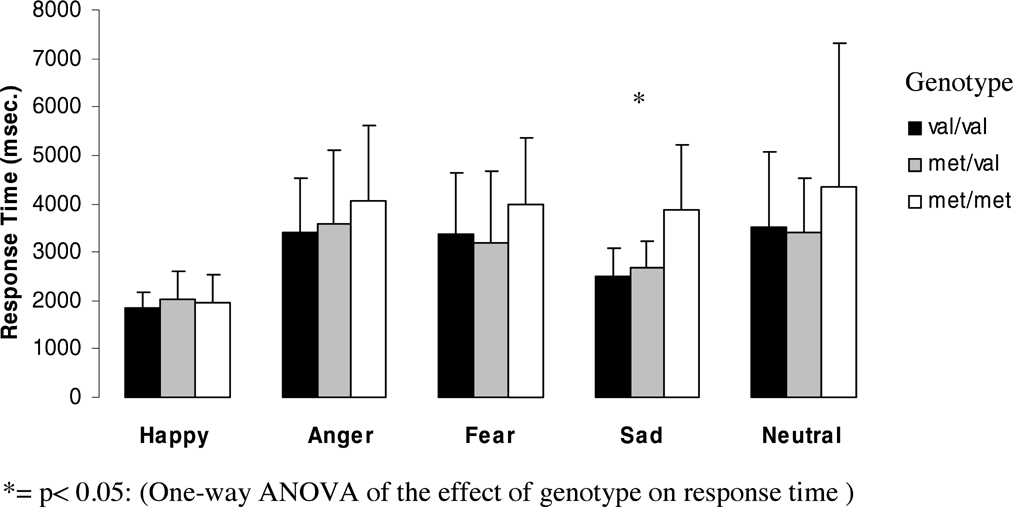
Effect of genotype on response time for each emotion for women.
In women. A significant effect of genotype on emotion recognition was found for sad faces (F = 4.5; df = 2; p = .016), with Met homozygotes women showing significantly worse performance than either Val homozygotes (p = .010, after Bonferroni correction p = .030) or heterozygotes (p = .006, after Bonferroni correction: p = .019).
The effect of genotype on response time was significant for sad faces (F = 10.69, df = 2, p = .0001) with Met homozygotes showing significantly slower reaction times than Val homozygotes (p = .0001, after Bonferroni correction p = .0001) and heterozygotes (p = .0001, after Bonferroni correction p = .001).
No other emotion gave rise to significant differences between genotypes.
The Penn Emotion Acuity Test (PEAT)
On the PEAT no significant effect of genotype was found on the accuracy ratings of happiness and sadness, or on response time.
Emotion Differentiation Task (EMODIFF)
On the EMODIFF the effect of genotype showed a trend towards significance for the discrimination of happy faces for the whole group (F = 2.89, df = 2, p = .060) and for women (F = 2,82, df = 2, p = .070). Val homozygotes were significantly worse in discriminating happy faces compared to heterozygotes (for the whole group: p = .028; for women: p = .022) and showed a trend towards significance for a worse performance compared to Met homozygotes in the whole group (p = .054), however these results could not withstand Bonferroni correction. No significant effect of genotype was found for men in the EMODIFF, or for response time for both sexes.
DISCUSSION
The current findings suggest a possible relationship between the Val-Met polymorphism in the COMT gene and recognition of facial affect in healthy subjects. Val homozygotes were better at identifying sad expressions than Met homozygotes and they also had significantly faster response times than Met homozygotes and heterozygotes. On the other hand, neutral faces were better recognized in Met homozygotes compared to heterozygotes and there was a trend towards significance compared to Val homozygotes. Also on the emotion differentiation test, Val homozygotes were worse in discriminating subtle differences in intensity of two expressions of happy emotions in the same person compared to heterozygotes and Met homozygotes.
Studies investigating associations of a genetic polymorphism with an intermediate phenotype are critically dependent on the assumption that the genotype groups are not different in factors other than genotype. Because gender differences have previously been demonstrated in emotion recognition, we conducted planned analyses of the association between COMT genotype and facial affect recognition for both sexes separately. When analyzed separately, only female subjects showed an association between genotype and emotion recognition for sad faces in the emotion recognition test and the discrimination of subtle differences in intensity of happy emotions in the emotion differentiation test. In female participants Val homozygosity was associated with significantly better performance and faster response time in recognizing sad expressions, but worse performance in discriminating differences in intensities of happy faces. In men, Val homozygosity was associated with better performance and faster response time in recognition of angry expressions. Thus, based on our data the question whether or not there are true gender differences has to remain unresolved.
Two recent fMRI studies (Drabant et al., 2006; Smolka et al., 2005) reported a significant correlation between increased limbic and prefrontal activation elicited by viewing of unpleasant pictures or faces displaying negative emotions and the number of met alleles. The authors supposed that the met/val polymorphism might be relevant for the regulation of negative affective states and that subjects with one or two copies of the met allele might be less flexible in processing emotionally arousing stimuli, perhaps because the limits for integration and regulation of emotional states might be reached earlier, resulting in a reduced resilience against negative mood states. Unfortunately, in the study by Drabant et al., (2006) a dissection of neural circuitry reflecting affect-specific processes (e.g., anger, disgust, fear) was not possible because of the use of a block design paradigm.
However, our study has several limitations. Our sample was young and highly educated and therefore generalization to other populations may be limited. Although we found significant associations with genotype only for sad faces in women and angry faces in men, it is possible that the absence of significant associations for expressed emotions may be because of lack of sensitivity, because performance is near ceiling for happy expressions, for example. Furthermore, we were not able to examine facial expression recognition as a function of stimulus arousal (high/low) and hedonic value (positive/negative) because the number of potential low and high intensity stimuli within each emotional category was too small, and happy expressions represented the only positive emotion.
These limitations notwithstanding, our study provides evidence for a possible influence of the COMT polymorphism on emotion recognition abilities in healthy subjects. Future research particularly needs to examine clinical populations such as schizophrenia and depression where impairments on these tasks have been demonstrated (Gur et al., 1992; Kohler et al., 2003).
ACKNOWLEDGMENTS
The information in this manuscript has never been published either electronically or in print. None of the authors had any financial or other relationships that could be interpreted as conflicts of interests relevant to the content of this manuscript.


