


Introduction
There is still large uncertainty regarding how ongoing climate change is impacting the Antarctic ice sheet. Current estimates of the mass balance indicate that the Antarctic ice sheet is currently losing mass and contributing to sea level rise, but with significant regional variability (Shepherd et al. Reference Shepherd, Ivins and Geruo2012). The Antarctic Peninsula and the West Antarctic Ice Sheet have been observed to be losing mass at an accelerated rate (e.g. Scambos et al. Reference Scambos, Bohlander, Shuman and Skvarca2004, Shepherd et al. Reference Shepherd, Wingham and Rignot2004, Holland et al. Reference Holland, Jenkins and Holland2008). This is partially offset by mass gains over large expanses of the East Antarctic Ice Sheet (EAIS) (Shepherd et al. Reference Shepherd, Ivins and Geruo2012). In a warming climate, there are mechanisms that drive increasing mass loss through changes in ice dynamics, and conversely, processes that drive increases in accumulation and associated mass gain.
The current and future mass loss from the Antarctic ice sheet is likely to be governed by accelerations in ice flow following changes in the dynamics of ice shelves that border the ice sheet, partially balanced by increasing precipitation. Observations of increased ice flow following changes in the ice shelves are linked to increasing ocean temperatures, increases in surface melt days, the intrusion of warmer water masses onto the continental shelf and changes in ocean currents underneath ice shelves (e.g. Rignot & Jacobs Reference Rignot and Jacobs2002, Holland et al. Reference Holland, Jenkins and Holland2008). These changes cause a reduction in the buttressing backforce exerted by the ice shelf on its tributary glaciers (Dupont & Alley Reference Dupont and Alley2005, Pritchard et al. Reference Pritchard, Ligtenberg, Fricker, Vaughan, van den Broeke and Padman2012), which subsequently leads to accelerations in their flow (Holland et al. Reference Holland, Jenkins and Holland2008). Increasing mass losses are partially offset by mass gain over the EAIS due to increased precipitation (Shepherd et al. Reference Shepherd, Ivins and Geruo2012). Global climate models predict an increase in precipitation over Antarctica that may potentially offset the mass loss caused by ice dynamic changes in the future (e.g. Krinner et al. Reference Krinner, Magand, Simmonds, Genthon and Dufresne2007). Recently there have been a number of high snowfall years that may indicate an upward trend in precipitation (Boening et al. Reference Boening, Lebsock, Landerer and Stephens2012); however, the short observational time series makes this conclusion equivocal. Large natural climate variability (Monaghan et al. Reference Monaghan, Bromwich, Fogt, Wang, Mayewski, Dixon, Ekaykin, Frezzotti, Goodwin, Isaksson, Kaspari, Morgan, Oerter, van Ommen, van der Veen and Wen2006) combined with spatially extensive monitoring being limited to the satellite era restricts our ability to assess what changes are occurring, what the impacts may be and how they will vary over the next century. The difficulty in estimating future contributions of the Antarctic ice sheet to sea level rise is that both mass loss due to changes in ice dynamics and changes in precipitation are uncertain.
While those regions of Antarctica demonstrating rapid change have been the focus of high spatial and temporal resolution velocity observations, it is also important to monitor large outlet glaciers currently thought to be stable. The Amery Ice Shelf (AIS) is the third largest ice shelf in Antarctica (Allison Reference Allison1979) and its drainage basin is a significant contributor to the mass budget of the EAIS (e.g. Yu et al. Reference Yu, Liu, Jezek, Warner and Wen2010). Understanding the present and future climate change response of the EAIS is important to understanding whether the Antarctic will be a net source or sink of sea level rise, making the AIS and its tributary glaciers an important study region.
This study calculated the velocities of the AIS and its three main tributary glaciers, the Fisher, Lambert and Mellor glaciers, concentrating on the AIS grounding zone. The feature tracking software IMCORR was applied on a sequence of Landsat 7 images selected at approximately yearly intervals between 2004 and 2012. The velocities for each yearly image pair were calculated, as was the overall change between 2004 and 2012. Velocities were compared with limited available in situ global positioning system (GPS) measurements and published satellite-based velocity measurements for the region.
Background
The Amery Ice Shelf region
The AIS is the largest embayed ice shelf in East Antarctica, with an area of ≈60 000 km2 (Galton-Fenzi et al. Reference Galton-Fenzi, Maraldi, Coleman and Hunter2008). The Mellor, Fisher and Lambert glaciers account for 60.5% of the mass that flows into the AIS (Yu et al. Reference Yu, Liu, Jezek, Warner and Wen2010). The ocean cavity underneath the AIS has one of the deepest contact points with ice in Antarctica (Fricker et al. Reference Fricker, Allison, Craven, Hyland, Ruddell, Young, Coleman, King, Krebs and Popov2002) with the circulation underneath the AIS dominated by the ice pump process (Galton-Fenzi Reference Galton-Fenzi2009). The recent BEDMAP2 bedrock topography compilation (Fretwell et al. Reference Fretwell, Pritchard and Vaughan2013) shows substantially more marine based ice sheet in the AIS region than was previously known.
There is a long history of measurements on the AIS, with the first in situ measurements of elevation and velocity recorded between 1968 and 1970 (Budd et al. Reference Budd, Corry and Jacka1982). In 1988, GPS were deployed which continued episodically until 1999 (King et al. Reference King, Coleman, Morgan and Hurd2007). These observations are limited by their single location nature and were focussed on the northern part of AIS (King et al. Reference King, Coleman, Morgan and Hurd2007). The first spatially extensive satellite observations used to analyse velocities in the AIS region were synthetic aperture radar (SAR) images from 1997 (Joughin Reference Joughin2002, Young & Hyland Reference Young and Hyland2002). In addition, gravimetry studies (e.g. King et al. Reference King, Bingham, Moore, Whitehouse, Bentley and Milne2012) have been monitoring large scale mass change across Antarctica, with the Amery drainage basin a region of continued interest. Altogether, around 40 years of records exist reviewing both velocity and elevation change in the AIS region. The velocity of the northern region of the AIS was shown to decrease by 0.5% between 1968 and 1999 (King et al. Reference King, Coleman, Morgan and Hurd2007), with the elevation being stable from 1968 to 2007 (King et al. Reference King, Coleman, Freemantle, Fricker, Hurd, Legresy, Padman and Warner2009). A number of different estimates of the velocity field have been calculated for the AIS (Joughin Reference Joughin2002, Young & Hyland Reference Young and Hyland2002, Jezek Reference Jezek2003, Rignot et al. Reference Rignot, Mouginot and Scheuchl2011a). However, due to different assumptions in their calculations, these estimates cannot be directly compared. Recently, Wen et al. (Reference Wen, Wang, Liu, Jezek, Huybrechts, Csatho, Farness and Bo2008) estimated that the mass of the entire grounded ice catchment feeding the AIS was approximately in balance, with a net flux of -4.2±9.8 Gt yr-1. This finding contrasts with Yu et al. (Reference Yu, Liu, Jezek, Warner and Wen2010) who estimated an increase in mass for the same region of 22.9±4.4 Gt yr-1. Different estimates of ice thickness at the grounding zone appear to be the source of the discrepancy and of consequent differences in estimates of ice shelf basal mass loss (Galton-Fenzi et al. Reference Galton-Fenzi, Hunter, Coleman, Marsland and Warner2012). Gravimetry studies show that best estimates of the drainage basin that includes the Mellor, Fisher and Lambert glaciers increased by 5–15 Gt yr-1 between 2002 and 2010 (King et al. Reference King, Bingham, Moore, Whitehouse, Bentley and Milne2012). The observations outlined above indicate that the AIS and its southern drainage basin are probably in steady state.
Glacier velocity measurement techniques
Surface ice velocities can be measured by in situ GPS and a variety of different remote-sensing techniques, such as feature tracking, interferometic synthetic aperture radar (InSAR) (König et al. Reference König, Winther and Isaksson2001) and speckle tracking (Gray et al. Reference Gray, Short, Mattar and Jezek2001). The point nature of GPS data limit their application for measurement of large regions; however, they are ideal for the validation of velocity datasets obtained using remote-sensing methods.
Feature tracking techniques use optical or radar images, tracking persistent features between two images separated by a known time interval to obtain velocities. This technique was automated by Scambos et al. (Reference Scambos, Dutkiewicz, Wilson and Bindschadler1992) among others and has been applied to many regions of Antarctica (e.g. Lucchitta et al. Reference Lucchitta, Mullins, Allison and Ferrigno1993, Scambos & Bindschadler Reference Scambos and Bindschadler1993, Warner & Roberts Reference Warner and Roberts2013). The implementation by Scambos et al. (Reference Scambos, Dutkiewicz, Wilson and Bindschadler1992) utilizes Fast Fourier Transform cross-correlation algorithms to match features between images. The resulting displacements, which maximize the correlations, can be converted into velocities by dividing the displacement by the time interval between image acquisitions. The optimal time interval between an image pair used for this technique will vary between individual study regions. The time should be chosen based on how long surface features will survive in a given area. The longer the time period between image pairs, the larger the signal-to-noise ratio. However, the longer the time period, the higher the chance of the features changing shape or character sufficiently that a correlation between images cannot be identified. Three main sources of error within this method include inherent error in the feature tracking method, residual geo-location errors in each image and errors due to failure to consider ice flow curvature. The inherent error in the software process is due to limitations of the sub-pixel interpolation (Scambos et al. Reference Scambos, Dutkiewicz, Wilson and Bindschadler1992). The geo-location error is caused by errors in the geo-rectification process, where small errors in sensor location and altitude, combined with an inaccurate digital elevation model (DEM) used in the image ortho-rectification process lead to a complicated spatially variable error across the image, preventing even stationary features being perfectly aligned between two images. Stationary features can be used as control points to correct for this problem. Frezzotti et al. (Reference Frezzotti, Capra and Vittuari1998) showed that, with Landsat 4 images (30 m resolution), when viable control points exist the error in displacement is approximately 0.5 pixels. The error due to curvature of ice flow is caused by the feature tracking technique only measuring the distance between a feature on two images and not the actual path the feature takes, leading to possible underestimates of ice velocity.
Methods
Data
The Landsat 7 satellite, launched in 1999, produces images within the panchromatic band with a 15 m spatial resolution with a 16 day repeat cycle. It has a near polar orbit which is repetitive, circular and sun-synchronous. In 2003, an on-board instrument, the scan line corrector (SLC), failed. All images captured thereafter have data gaps that appear as black stripes that originate towards the middle of the image and are spread in the across track direction. The data gaps caused by the SLC failure account for approximately 25% of each image. The images used in this study have undergone cubic convolution re-sampling to a polar stereographic projection and the lack of ground control points limited correction to Systematic Terrain Correction (Level 1Gt) by the US Geological Survey, which provides systematic, radiometric and geometric accuracy, while utilizing the RAMP v2 DEM for elevation correction.
The images used are from Landsat 7 row 127 and path 112 (Fig. 1, for acquisition dates see Table S1 found at http://dx.doi.org/10.1017/S0954102015000231). For each year, the image with the lowest percentage cloud cover during February was selected. Using images from different months could introduce errors from different shadow lengths. Our analysis was undertaken on Landsat 7 images on a polar stereographic projection with standard latitude of 71°S and central meridian of 0°E. All comparison velocity data share this projection.

Fig. 1 Study site locality. The black box shows extent of the Landsat 7 (row 127, path 112) images and study region. The blue line is the Antarctic surface accumulation and ice discharge grounding line (Bindschadler et al. Reference Bindschadler, Choi, Wichlacz, Bingham, Bohlander, Brunt, Corr, Drews, Fricker, Hall, Hindmarsh, Kohler, Padman, Rack, Rotschky, Urbini, Vornberger and Young2011). Background Moderate Resolution Imaging Spectroradiometer image courtesy of NASA Goddard Space Flight Centre, Rapid Response.
Two Antarctic-wide velocity datasets were chosen to compare against our results. These datasets are the RADARSAT-1 Antarctic Mapping Project Modified Antarctic Mapping Mission (RAMP-MAMM) (Jezek Reference Jezek2003) and the NASA Making Earth System Data Records for Use in Research Environments Antarctic ice velocity dataset (MEaSUREs) (Rignot et al. Reference Rignot, Mouginot and Scheuchl2011a). The RAMP-MAMM velocity dataset was derived from RADARSAT-1 satellite passes between 3 September 2000 and 17 November 2000, and calculated by InSAR. MEaSUREs is derived using a combination of InSAR measurements and speckle tracking (Mouginot et al. Reference Mouginot, Scheuchl and Rignot2012) from data taken between 2007 and 2009. The MEaSUREs dataset is provided on a 900 m grid (Rignot et al. Reference Rignot, Mouginot and Scheuchl2011b) and was re-gridded using linear interpolation to a 1 km grid for comparison with our study.
Three GPS measurement sites exist in our study region (Fig. 2) that can also be used for comparison. The GPS measurements span a different epoch (1998–2001) to the MEaSUREs satellite velocity measurements, but overlap with the RAMP-MAMM dataset. One of the GPS sites is located on the grounded portion of the Mellor Glacier, and the other two on the floating portion of the AIS (Fig. 2).

Fig. 2 The location of the nunataks used for geo-location corrections and GPS locations. Grounding line as per Fig. 1.
Velocity calculations
Velocities are calculated using the feature tracking software IMCORR which was developed by Scambos et al. (Reference Scambos, Dutkiewicz, Wilson and Bindschadler1992) to track features in optical images, such as those provided by the Landsat satellites. We used a version of IMCORR modified by Warner & Roberts (Reference Warner and Roberts2013) in order to successfully overcome a limitation of the original software that prevented its use with Landsat 7 data affected by the SLC failure.
The images used in this study were contrast enhanced before analysis to improve the signal-to-noise ratio. The correlation analysis used a search window of 256 x 256 pixels and a reference window of 64 x 64 pixels. The search window and reference window sizes are calibrated to the size of the expected displacements in the study region. The displacements calculated from the IMCORR process were binned into 1 km x 1 km areas using a least trimmed squares method, requiring three data points to be in each bin, before undergoing a nearest-neighbours culling. A data point was only accepted if four of the nine data points in a 3 x 3 bin window had displacement components within 150 m. The displacements were then corrected for geo-location errors (discussed below) and converted into velocities by dividing by the time between the two images. The measured velocities are horizontal projections of the true velocity, but in this region the vertical velocity is <1% of the overall flow, and therefore, not considered significant. The velocities are plotted at the start point of the displacement vector. Velocities below 150 m yr-1 were removed due to low confidence in correlations, largely as a function of minimal surface crevassing and feature expression at low velocities in this region. The method used is discussed fully in Warner & Roberts (Reference Warner and Roberts2013).
Geo-location error corrections
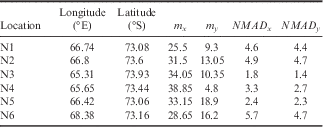
There is a spatially variable offset between each pair of images, caused by geo-location error, which becomes apparent in the initial displacements that are generated by IMCORR. The displacement direction and magnitude vary for each control point and for each image pair. We assume that the error caused by geo-location error has both a systematic offset component, as well as a random component. Features that are known to be stationary over the given time period, such as mountains and nunataks, are used as control points to correct for the spatially non-uniform systematic offset component, with the remaining random component being treated as an error term in the subsequent computation of the velocity uncertainty. The six most central groups of mountains/nunataks in the region, N1 through N6 (Fig. 2) that surround the Fisher, Lambert and Mellor glaciers in the imagery, were used as control points to account for systematic geo-location offsets. For each image pair, the mountains/nunataks groups, i (i=1,…,6), were taken in isolation and a position
n
i
(={n
ix
,n
iy
}), where
 $$x$$
is the easting and
$$x$$
is the easting and
 $$y$$
is the northing, was assigned to the centre of each group. The IMCORR process generates non-zero displacement vectors across the mountains/nunataks, indicating the offset in the image since these displacement vectors should be zero. The displacement vectors in the centre of each group of mountains/nunataks are discarded in this calculation to minimize any error due to elevation difference relative to the ice surface and illumination changes. Any other anomalous vectors (those that clearly did not match any features) were manually removed. The median of the remaining displacements, m
i
(={m
ix
,m
iy
}) and the normalized median absolute deviation (NMAD) at 95% confidence interval of the spread of these displacements, NMAD
i
(={NMAD
ix
,NMAD
iy
}) was calculated for each group of mountains/nunataks (Table I). The NMAD has been shown to provide appropriate error bounds compared to other techniques (Höhle & Höhle Reference Höhle and Höhle2009). We assumed that the median displacements are locally representative of the offset caused by the geo-location error and that it changes smoothly between each group of mountains/nunataks. This allows us to weight the medians of each mountains/nunataks group by distance using an inverse distance squared weighting and make a correction, C (={C
x
,C
y
}), to the displacement at any point, {p
x
,p
y
}:
$$y$$
is the northing, was assigned to the centre of each group. The IMCORR process generates non-zero displacement vectors across the mountains/nunataks, indicating the offset in the image since these displacement vectors should be zero. The displacement vectors in the centre of each group of mountains/nunataks are discarded in this calculation to minimize any error due to elevation difference relative to the ice surface and illumination changes. Any other anomalous vectors (those that clearly did not match any features) were manually removed. The median of the remaining displacements, m
i
(={m
ix
,m
iy
}) and the normalized median absolute deviation (NMAD) at 95% confidence interval of the spread of these displacements, NMAD
i
(={NMAD
ix
,NMAD
iy
}) was calculated for each group of mountains/nunataks (Table I). The NMAD has been shown to provide appropriate error bounds compared to other techniques (Höhle & Höhle Reference Höhle and Höhle2009). We assumed that the median displacements are locally representative of the offset caused by the geo-location error and that it changes smoothly between each group of mountains/nunataks. This allows us to weight the medians of each mountains/nunataks group by distance using an inverse distance squared weighting and make a correction, C (={C
x
,C
y
}), to the displacement at any point, {p
x
,p
y
}:
 $$C(p_{x} ,p_{y} )={1 \over d}\mathop{\sum}\nolimits_{i=1}^6 {{{\{ m_{{ix}} ,m_{{iy}} \} } \over {(p_{x} {\minus}n_{{ix}} )^{2} {\minus}(p_{y} {\minus}n_{{iy}} )^{2} }}} ,$$
 $$where\,d=\mathop{\sum}\nolimits_{i=1}^6 {{1 \over {(p_{x} {\minus}n_{{ix}} )^{2} {\minus}(p_{y} {\minus}n_{{iy}} )^{2} }}} $$
The initial displacements
 $D^{I} (=\{ D_{x}^{I} ,D_{y}^{I} \} )$
, have C subtracted to obtain the final displacement vectors,
$D^{I} (=\{ D_{x}^{I} ,D_{y}^{I} \} )$
, have C subtracted to obtain the final displacement vectors,
 $$D^{F} (=\{ D_{x}^{F} ,D_{y}^{F} \} )$$
:
$$D^{F} (=\{ D_{x}^{F} ,D_{y}^{F} \} )$$
:
 $$D^{F} =D^{I} {\minus}C.$$
The error in the calculated velocities, D
F
is made up of the error in D
I
and C. D
I
has three sources of error: one systematic and two independent random errors. The systematic error is from the geo-location systematic offset, for which C is used to correct. The first independent error is associated with the correlation calculated within the IMCORR program (Scambos et al.
Reference Scambos, Dutkiewicz, Wilson and Bindschadler1992) and the second is the remaining random error component associated with any residual geo-location error after the offset has been applied. The correction C has only the two independent sources of error. The correlation method outlined in Scambos et al. (Reference Scambos, Dutkiewicz, Wilson and Bindschadler1992) reports an error of 0.1 pixels, with the modifications by Warner & Roberts (Reference Warner and Roberts2013) reporting an error typically ~0.25 pixels. The residual geo-location error cannot be separated from the IMCORR specific error, and hence, they are treated as a single combined error term that can be applied to both D
I
and C, respectively. To estimate this error, we use the displacements at n
i
. The velocity should be zero at this point, thus the remaining spread of displacements should provide an estimate of random errors. This estimate is calculated by using the values from NMAD
i
. To estimate the random errors for the displacements on the ice, we assume that the error varies between each mountains/nunataks group in the same way as the computed offset correction field C. This allows us to use the inverse squared weighting applied in Eq. 1 to assign an error for each point, {p
x
, p
y
}, which gives an error field, E(={E
x
,E
y
}) (Eq. 3), that gives the error in both D
I
and C (
 $$E_{D}^{I} $$
and E
C
, respectively):
$$E_{D}^{I} $$
and E
C
, respectively):
 $$E_{x}^{2} ={1 \over {d^{2} }}\mathop{\sum}\nolimits_{i=1}^6 {{{NMAD_{{ix}}^{2} } \over {[(p_{x} {\minus}n_{{ix}} )^{2} {\minus}(p_{y} {\minus}n_{{iy}} )^{2} ]^{{2,}} }}} $$
and similarly for E
y
. When the offset to correct for the geo-location is applied, the error is propagated in quadrature to give
 $ E_{D}^{F} $
:
$ E_{D}^{F} $
:
 $$E_{D}^{F} =\sqrt {(E_{D}^{I} )^{2} {\plus}(E_{C}^{{}} )^{2} .} $$
Additionally, when a velocity field from one year was compared to another year, the associated errors for each D F are propagated in quadrature similar to Eq. 4.
Table I An example of calculated values for the 2004–05 image pair, where {m x ,m y } are the median displacements and {NMAD x ,NMAD y } are the NMAD value at 68.3% confidence interval of the vector components (m) at the given nunatak N1–N6.
Results
The velocity field and error field was calculated for each pair of sequential images between 2004 and 2012. The velocity magnitude and error field comparing 2004 to 2005 (Fig. 3) shows the spatial variation of the datasets and the base error fields. This is the only comparison for a single year presented herein, the other velocity and error fields are provided in supplementary information (see Figs S1–S7 found at http://dx.doi.org/10.1017/S0954102015000231).

Fig. 3a Magnitude of velocity field and b. errors (NMAD 95% confidence interval) for the 2004–05 image pair.
The velocity fields from 2004–05 and 2011–12 were differenced to examine the acceleration of the ice velocity between these two periods (Fig. 4a). While there appears to be a coherent pattern of change in the Mellor Glacier as it approaches the grounding zone, we have low confidence that a change is significant unless it exceeds the error in the region (Fig. 4b). Figure 4c shows the ratio of change to error, with only values lying outside (-1, 1) considered significant. No coherent patterns of significant change were found. This is highlighted in Fig. 5a, as the distribution of velocity differences is symmetrical and centred on a median just below zero. There is also a potential bias from certain groups of mountains/nunataks used in the geo-location process as can be seen by the distribution of the error field (Fig. 4b). Figure 5b shows that there were no major velocity changes on a yearly scale over any annual increment within the time periods, with the symmetrical distributions all centred on a median of approximately zero. Each velocity map used in the differencing has an associated error field, which are propagated by quadrature (Fig. 4) that results in a new error field associated with the velocity difference field. The outlying points on the figures are artefacts of the IMCORR process caused by anomalous highly correlated features that are not representative of ice flow.

Fig. 4a The change in speed between the year pair of 2004–05 and 2011–12. b. The combined area weighted error field (NMAD 95% confidence interval) for the change in speed. c. The ratio of change to error (NMAD), with (-1 to 1) representing the 68.3% confidence interval and (-2 to -1, 1 to 2) representing 95% confidence intervals. There is a signal at the 68.3% confidence level on the Mellor Glacier, but it is not at the 95% confidence level.

Fig. 5a The speed difference between 2004–05 and 2011–12. Error bounds are the highest error (NMAD 95% confidence interval) from the comparison, centred on the median. b. Compilation of all speed differences on a year-to-year basis between 2004 and 2012. The maximum and minimum error bound is centred on zero given the assumption of no change, and based on the highest and lowest error (NMAD 95% confidence interval) across all comparisons. The peaks of the comparisons fall well within the error bounds, indicating that no years of anomalously high change occurred across our dataset.
A temporally averaged velocity field for the AIS (given the acronym VAIS) was produced by averaging seven of the eight different image pairs (Fig. 6). The velocity pair from 2009–10 was excluded due to cloud cover overlap such that three out of the six control points were covered in cloud across the two images. If a given grid location had valid data for less than three years it was not included in the average.

Fig. 6a Mean VAIS flow calculated between 2004 and 2012, where there were at least three valid velocity calculations. b. The mean flow directions of the VAIS relative to the grid easting direction.
The VAIS dataset was compared to the MEaSUREs, RAMP-MAMM and GPS datasets. The MEaSUREs field appears slower across almost the entire region (Fig. 7a), with a slight patch of faster flow on the eastern side of the Lambert Glacier. The RAMP-MAMM dataset is faster on the ice shelf but the grounded portion of the AIS region shows considerable variations across the tributaries. RAMP-MAMM is faster in the lower section of the grounded Fisher Glacier, the Mellor Glacier is uniformly slower than the VAIS, and the Lambert Glacier is faster in the western side and slower on the eastern side (Fig. 7b). The speed difference between VAIS and MEaSUREs (VAIS-MEaSUREs) and VAIS and RAMP-MAMM (VAIS-RAMP) (Fig. 8) both show a symmetrical distribution. VAIS-MEaSUREs has a median speed difference of 8.81 m yr-1 and VAIS-RAMP has a median speed difference of 0.75 m yr-1. VAIS-MEaSUREs has a flow angle difference of 0.13 degrees and VAIS-RAMP a median flow angle difference of 0.69 degrees.

Fig. 7a The difference in speed between VAIS and MEaSUREs. VAIS is largely faster than MEaSUREs with the exception towards the edges. b. The difference in speed between VAIS and RAMP-MAMM. The comparison shows an inconsistent pattern of velocity, particularly on the Lambert Glacier. The velocity on the Amery Ice Shelf is faster in the RAMP-MAMM dataset.

Fig. 8a The speed difference between VAIS and MEaSUREs. Error is the highest error (NMAD 95% confidence interval) from the comparison centred on the median. b. The angle difference between VAIS and MEaSUREs. Error is the error (NMAD 95% confidence interval) from the comparison centred on the median.
The GPS velocities are typically faster than the VAIS (average of five closest points), MEaSUREs and RAMP-MAMM datasets (Table II). The GPS site located on the Mellor Glacier (v5, Fig. 2) showed closest agreement with the RAMP-MAMM dataset, with GPS still significantly faster by 19 m yr-1. When compared to VAIS and MEaSUREs, the same site is faster by 29 and 43 m yr-1, respectively. TS05 is located near the grounding zone of the Mellor Glacier and showed closest agreement with VAIS, with TS05 only 9 m yr-1 faster. This compares to 34 and 19 m yr-1 against the MEaSUREs and RAMP-MAMM fields, respectively. The final GPS site, TS06, is located on the ice shelf and showed closest agreement with VAIS, with TS06 being faster by 11 m yr-1. However, MEaSUREs and RAMP-MAMM also show close agreement with TS06, although with a difference in sign; TS06 was 13 m yr-1 faster than MEaSUREs and 13 m yr-1 slower than RAMP-MAMM.
Table II Comparison between this study (VAIS), MEaSUREs, RAMP-MAMM and in situ GPS velocities (all velocities in m yr-1).
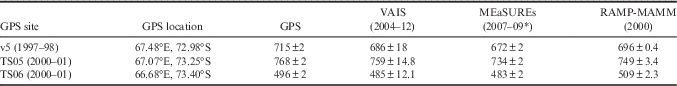
* Some regions may have data from other epochs.
Discussion
The velocity derived for the 2004–05 image pair (Fig. 4a) shows the expected velocity pattern for the AIS and tributary glaciers. Increasing velocities are observed as the glaciers approach the grounding zone, with faster velocities downstream on the ice shelf before they begin to slow as the ice flows northwards. The error field is fairly uniform in distribution across the image at ~10 m yr-1 (~95% confidence interval), but with a slightly higher error towards N6 and lower towards N3 indicating that the geo-location error is higher at N6. The coverage of the velocity estimates is spatially incomplete, with variations between each of the image pairs. There are a number of reasons for correlations breaking down in various regions and these may vary year on year. The feature tracking technique breaks down in regions where the ice is deforming so rapidly that the feature changes shape, or where the ice is moving too slowly to generate detectable surface features, the surface has melted or there is cloud cover. Such phenomena translate to a lack of persistence of any given surface feature between images, hence little or no correlation in the IMCORR process. The large gap across the grounding zone as the Lambert Glacier enters the AIS may be caused by increased flow curvature causing surface features to not be clearly identifiable between two images as they will have deformed and changed orientation. Another possibility is that crevassing at the grounding zone deforms the surface features. In some years there was significant surface melt, which destroyed features across the AIS, as seen in the south-eastern portion of the AIS (Fig. 3). Some of the images used in the study had varying levels of cloud cover which impacted the derived velocity coverage and geo-location corrections (Fig. S3 found at http://dx.doi.org/10.1017/S0954102015000231).
There was no significant change in velocities between 2004–05 and 2011–12 on the Fisher, Lambert and Mellor glaciers, and the southern portion of the AIS (Fig. 4a). While there is evidence of spatially coherent change, particularly on the Mellor Glacier, given the method of correction for geo-location we have low confidence in the change unless the magnitude is greater than the derived error (Fig. 4c). This is highlighted by Fig. 5a, where >80% of the data is within the error bounds. This is consistent with year-to-year comparisons (Fig. 5b) that show that while there are variations in median velocity for the individual image pairs, the differences are not significant. The NMAD (95% confidence interval error) ranges from 15 to 26 m yr-1 across the region, which equates to a range of 2–10% depending on the velocity. Whilst changes in velocity below this threshold cannot be ruled out, it suggests that any change that is occurring would be <2% over a period of eight years, otherwise it would have been observed in our analysis in the fast flowing ice regions (where velocities reach 1000 m yr-1). Our results suggest that the ice surface velocity in the grounding zone region of the AIS has been in steady state between 2004 and 2012.
The VAIS velocity dataset agrees within error bounds with both the MEaSUREs and RAMP-MAMM datasets. The VAIS-MEaSUREs comparison showed that the VAIS velocities are higher in a spatially coherent pattern, with a median difference of 8.81 m yr-1. The VAIS is faster in regions of high curvature, which was unexpected as the MEaSUREs dataset should measure the velocity along curves more accurately. This was possibly caused by a relatively large smoothing footprint in the MEaSUREs dataset. The VAIS-RAMP comparison showed an inconsistent spatial pattern. This contrasts with VAIS-MEaSUREs where the offset in speed was spatially consistent. The overall median difference of the VAIS-RAMP comparison was 0.75 m yr-1. The VAIS-RAMP comparison displays velocity differences in some regions of high curvature, such as the Fisher Glacier. The velocity difference due to curvature is ≈ 1%, indicating that it is only a component of the velocity difference in the VAIS-RAMP comparison. A number of approximations go into the InSAR technique, such as surface slope and firn depth, which may lead to the difference in velocity between the two techniques. Comparing the MEaSUREs and RAMP-MAMM datasets shows that RAMP-MAMM is faster on the ice shelf, where errors associated with surface slope should be small. The common slow area on the eastern Lambert Glacier that is seen in both the VAIS-MEaSUREs and VAIS-RAMP comparisons may be an indication of a systematic difference in the techniques, or be due to the higher error in the corrections due to N6.
Comparison of the three velocity fields with in situ GPS showed that GPS velocity estimates were generally faster. Two of the three GPS sites (v5 and TS05, Fig. 2) agreed most closely with the VAIS dataset; however, differences were of comparable magnitude to error within the velocity fields, making meaningful inference problematic. The remote-sensing techniques underestimate the velocity in this region relative to the GPS, but the limited spatial coverage and epochs of the GPS sites make it difficult to determine the cause of this discrepancy. Further GPS deployments on the tributaries and the AIS would be recommended to assist in a more comprehensive validation of the remote-sensing techniques in this region. Additionally, GPS located on the correction nunataks would aid geo-location of the images.
One avenue of future work to reduce the uncertainties of our velocities (and hence the tolerance required to identify significant change), would be to improve the geo-rectification of the images prior to analysis. The residual geo-rectification error accounts for at least 50% of the error. This can be improved in various ways including by using GPS receivers to accurately co-ordinate ground control points, using higher quality DEMs (which could then be used to reprocess the raw imagery) and/or using higher resolution imagery. The recent launch of the Landsat 8 satellite (15 m resolution) will allow for the continued monitoring of the AIS region and possible extension of velocity changes further inland than covered in this study.
The observed velocities of the AIS region from our study and the work by King et al. (Reference King, Coleman, Freemantle, Fricker, Hurd, Legresy, Padman and Warner2009) indicate that the ice velocities have been stable throughout the respective study periods commencing in 1968 and concluding in 2012. There are limitations to the observations in the AIS region before 1998, with the estimates in change from King et al. (Reference King, Coleman, Freemantle, Fricker, Hurd, Legresy, Padman and Warner2009) limited with respect to spatial coverage in particular. Recent gravimetry studies indicate that the drainage basin of the AIS may be increasing in mass (King et al. Reference King, Bingham, Moore, Whitehouse, Bentley and Milne2012), but this phenomena must be inconsequential for changing the driving stress, and hence, flow, given that a change in surface velocities over the study period was not seen. An unusual characteristic of the AIS, amongst major ice shelves, is that as it flows towards the sea the width of the ice shelf initially narrows, creating a choke point in the ice shelf which probably provides significant buttressing to the glacial flow. Additionally, there is evidence of a re-grounding zone after this choke point indicated by the ice rise known as the Budd Ice Rumples. The southern grounding zone of the AIS is a significant distance from the calving front and it has a long aspect ratio compared to the other major ice shelves. These features combine to provide the tributary glaciers with considerable buttressing which would not necessarily reduce if the front of the ice shelf began to retreat. The AIS also has one of the deepest grounding zones in Antarctica, which, if warmer water was to intrude, could cause high melt rates in the grounding zones of the three major tributaries. The Lambert Glacier in particular drains a large marine basin which could be vulnerable to retreat in future climate scenarios. It will be important to continue monitoring this region since changes will not necessarily be as obvious as in other regions where ice shelves have dramatically retreated or collapsed. Ice sheet modelling will undoubtedly help identify the risk in this region due to possible future climate scenarios and give indications on the precursor of change in the region.
Conclusion
The southern region of the AIS and its primary tributary glaciers, the Fisher, Mellor and Lambert glaciers, have shown no significant change in velocity between 2004–05 and 2011–12 upon investigation using feature tracking on optical Landsat 7 imagery. A spatially variable error field has been calculated from the variance of the geo-rectification correction, with the error varying between 15 and 26 m yr-1. Change in ice surface velocity may have occurred below this threshold which would have been less than 2% of the flow velocity over an eight year period. The output velocity dataset, termed VAIS, was calculated by averaging the yearly velocities from sequential image pairs between 2004 and 2012. VAIS shows higher velocities on the grounded ice and lower velocities on floating ice than the older RAMP-MAMM dataset, and shows higher velocities compared to the more recent MEaSUREs dataset. The few GPS velocities available were generally faster than all three velocity datasets, and further observations are required to determine if this is a significant systematic difference. There is no evidence of rapid changes in velocity in the AIS and its tributary glaciers, and all recent observations indicate that the AIS region has been in approximate equilibrium over recent decades (since 1968). The AIS has a unique configuration which may dictate that it responds differently to climate change than other regions. As a major outlet of the EAIS it is important to continue to monitor and assess the risk of change in this region and the impact that it may have on sea level rise into the future.
Acknowledgements
This work was supported by the Australian Government’s Cooperative Research Centres programme through the Antarctic Climate & Ecosystems Cooperative Research Centre (ACE CRC). Landsat7 images courtesy of the US Geological Survey. The VAIS dataset and associated velocity and error files for each image pair used within will be made available on the Australian Antarctic Data Centre (https://data.aad.gov.au/). We thank Allen Pope and an anonymous reviewer for comments and suggestions that greatly improved this paper.
Author contribution
J.R., R.W. and B.G-F. conceived the study and all authors provided interpretation of the findings. M.P. ran the modified IMCORR program on the satellite images, analysed the results and prepared the manuscript. J.R. prepared figure 1 and provided code to help M.P. prepare the other figures. J.R, C.W. and B.G-F. are the PhD supervisory team to M.P. R.C. provided the analysed GPS data. All authors contributed to the drafting of the manuscript.
Supplemental material
A supplemental table providing further information about the satellite images used in this study and seven figures showing the individual velocity differences and error fields for each set of image pairs will be found at http://dx.doi.org/10.1017/S0954102015000231.


