


1 Introduction
The meteoric rise of be like as a verb for introducing direct quotations, as in (1), is conspicuous among linguistic changes for both its vigourFootnote 2 and widespread attestation. Researchers began noticing be like competing with existing forms like say, think and tell in the early 1980s (Butters Reference Butters1982: 149)Footnote 3 and in the last thirty-seven years it has become globally ubiquitous. It has taken over the quotative system in the speech of young adults in Canada, the United States, Australia, New Zealand and parts of the United Kingdom (e.g. Tagliamonte & D'Arcy Reference Tagliamonte and D'Arcy2004; Barbieri Reference Barbieri2007; Rodríguez Louro Reference Rodríguez Louro2013; Cheshire et al. Reference Cheshire, Kerswill, Fox and Torgersen2011; and many others).
(1) It was snowing, uhm, maybe about a year ago and we was in the pub and I'd said, ‘Oh, it's snowing,’ and I said, ‘Should we go make snow angels,’ and he went, ‘That's the first thing you ever said to me,’ and I was like, ‘Oh, he remembers!’ (Female York speaker born 1987)
Tagliamonte et al. (Reference Tagliamonte, D'Arcy and Rodríguez Louro2016: 842) have called the simultaneous rise of be like across multiple varieties of English a ‘linguistic Black Swan event’ – something that could not have been predicted by socio/historical linguistic theory. As part of their proposal, the authors show that be like started to be used by speakers born in the same years in Toronto and Victoria, Canada, Perth, Australia, and Christchurch, New Zealand. Not only did be like emerge at the same time in these four communities, the internal linguistic factors constraining the use of be like in all four cities are parallel. This is a linguistic development that is inconsistent with models of how linguistic changes spread across communities, such as the Wave, Gravity, Cascade or Cultural Hearth models of geographic linguistic diffusion (Trudgill Reference Trudgill1974; Callary Reference Callary1975; Horvath & Horvath Reference Horvath and Horvath1997; Labov Reference Labov, Britain and Cheshire2003, etc.).
Be like did not emerge ex nihilo. For example, D'Arcy (Reference D'Arcy2012) shows that be like is an effect, rather than a cause, of the quotative system reorganizing in New Zealand English over the last 150 years. Quotation itself in modern English has gradually taken on the ability to introduce internal dialogue, which essentially opened up a gap in the quotative system providing an entry point for a new form (D'Arcy Reference D'Arcy2012; see also Tagliamonte & D'Arcy Reference Tagliamonte and D'Arcy2007: 211). While be like may have emerged through grammaticalization, it deviates from classic cases of grammaticalization, again, by showing consistent linguistic conditioning across time and space (D'Arcy Reference D'Arcy2015a).
In this article we test the hypothesis that be like's rise to ubiquity follows a pattern well known in the study of long-term morphosyntactic changes: Kroch's (Reference Kroch1989, Reference Kroch, Beals, Denton, Knippen, Melnar, Suzuki and Zeinfeld1994) Constant Rate Effect (or CRE). To do this we draw on the largest quotative dataset from vernacular spoken English yet published. This unique dataset gathers several extant corpora from Toronto, Canada, and York, UK, along with newly collected data. In addition to testing for evidence of the CRE, we use these data to present a benchmark analysis of be like's rise in apparent and real time in two major varieties of English.
1.1 The Constant Rate Effect
The CRE proposes that for an incoming form within a set of variants, ‘the rate of replacement, properly measured, is the same in all [grammatical contexts]’ (Kroch Reference Kroch1989: 202). The CRE is closely tied to the notion of the logistic curve, or S-curve – the shape of a real-time innovation as measured in proportions within the full set of contexts in which variation between competing forms can occur (Labov Reference Labov1972), plotted over some measure of time (Weinreich et al. Reference Weinreich, Labov, Herzog, Lehmann and Malkiel1968; Bailey Reference Bailey1973; Labov Reference Labov1994, Reference Labov2001, etc.). The prediction of the CRE is that a single S-curve of an incoming form, when divided into several grammatical contexts in which the innovation appears, should appear as a set of multiple S-curves that are offset from each other but with slopes that are parallel. The CRE, and any S-curve of change, reflects competition between multiple grammars (Kroch Reference Kroch1989; Roberts Reference Roberts2007: 312–13). These multiple grammars are tantamount to grammars that have parameters set to different values (see Roberts Reference Roberts2007: 312–13), with one incoming at the expense of the other. While constant slopes by context may not always result from parametric-like change, all parametric-like change results in a constant slopes by context, i.e. a CRE-type pattern.
Crucially, the CRE is incompatible with extension, a key characteristic of grammaticalization, during which an incoming form emerges in one highly circumscribed context, usually saturates that context over time, and then later spreads to other contexts, becoming more general-purpose. Rather, in a CRE pattern, an innovation takes hold in all contexts at once, but its use in some contexts is simply more frequent than in others: ‘disfavoring contexts acquire new forms no later than favouring ones, though at lower initial frequencies’ (Kroch Reference Kroch1989: 238). This parametric-like change occurs abruptly (see Roberts Reference Roberts2007: ch. 3); an innovation enters a system as a possibility across all contexts. While an innovation has a comparatively higher probability in certain initially favourable contexts, the differences between the rates at which it is found in different grammatical contexts are stable across time because they are all a result of the same parametric-like change.Footnote 4 In other words, when graphing the probability of an innovation over a measure of time by various grammatical contexts, the individual S-curves for each context will have the same slopes.Footnote 5
Patterns that conform to the CRE have been reported not just for syntactic changes, as intended (Kroch Reference Kroch1989, Reference Kroch, Beals, Denton, Knippen, Melnar, Suzuki and Zeinfeld1994; Wallenberg Reference Wallenberg2013; Gardiner Reference Gardiner2017), but also for phonological changes (Fruehwald et al. Reference Fruehwald, Gress-Wright and Wallenberg2013), and discourse pragmatic changes (Cukor-Avila Reference Cukor-Avila2002: 20–1; Durham et al. Reference Durham, Haddican, Zweig, Johnson, Baker, Cockerman, Danks and Tyler2012; Denis Reference Denis2015). There has also been a recent report of CRE patterning in synchronic judgment data (Haddican et al. Reference Haddican, Johnson and Hilton2016). Phenomena subject to the CRE appear to be reasonably common; however, the CRE has mostly been studied in historical diachronic written data, rather than the synchronic spoken data of modern sociolinguistic interviews (Cukor-Avila Reference Cukor-Avila2002: 21). Further, there is a gap in current understanding of the CRE; it is unclear what occurs at the start- and endpoints of change – the CRE does not claim to account for either one (Roberts Reference Roberts2007: 320). Below we not only test for evidence of a CRE pattern, but we also probe what that pattern looks like at the point of saturation.
The first to suggest that the rise of be like might be subject to the CRE is Cukor-Avila (Reference Cukor-Avila2002: 20–1), who studies the incoming quotative in real time in Springville, Texas. Although she does not compare rates of change across contexts directly, Cukor-Avila (Reference Cukor-Avila2002: 21) finds that as be like increases in proportion, ‘the grammatical and discourse constraints on its occurrence remain constant’. This is considered evidence of the CRE according to Kroch (Reference Kroch1989: 6). Buchstaller & D'Arcy (Reference Buchstaller and D'Arcy2009: 324) point out that if the CRE is taken to apply to linguistic changes at all levels of the grammar, then ‘we have to postulate that the constraints on be like have been in place since its genesis in American discourse and have remained stable across time’. Likewise, Haddican & Zweig (Reference Haddican and Zweig2012: 5–6), in a syntactic analysis of be like, point out that different grammatical uses of be like could be CRE-compatible results of a single change.
Durham et al. (Reference Durham, Haddican, Zweig, Johnson, Baker, Cockerman, Danks and Tyler2012) directly evaluate the notion that be like might follow a CRE pattern. They use two sets of data from York, UK: the corpus collected in 1996 and analysed by Tagliamonte & Hudson (Reference Tagliamonte and Hudson1999), plus new York data collected in 2006.Footnote 6 While Durham et al. (Reference Durham, Haddican, Zweig, Johnson, Baker, Cockerman, Danks and Tyler2012) do find an interaction between speaker age and sex (showing a sex effect changing over time), the authors do not uncover any such interaction between speaker age and any of the tested linguistic effects. There is no change over apparent or real time in whether content of the quotation, grammatical person of the subject, or tense/temporal reference (see section 2.3) are active constraints (Durham et al. Reference Durham, Haddican, Zweig, Johnson, Baker, Cockerman, Danks and Tyler2012: 327–8). This is consistent with the CRE being operative as overall rates of be like increase over time. It is less compatible with a grammaticalization-based account in which the linguistic factors might weaken over time in the same speech community as an innovation becomes more general purpose (Durham et al. Reference Durham, Haddican, Zweig, Johnson, Baker, Cockerman, Danks and Tyler2012: 317).
We build on the findings of Durham et al. (Reference Durham, Haddican, Zweig, Johnson, Baker, Cockerman, Danks and Tyler2012), incorporating their data with previously examined corpora, corpora yet to be examined for quotative use, and newly-collected data (see table 1). We also investigate be like's rise not just in York, UK, but also Toronto, Canada. Our prediction is that a CRE pattern will be evident in both cities. If, instead, there are inconsistencies between the data and an idealized CRE pattern, our results may instead be used as evidence for either grammaticalization (if such a pattern is found) or – especially for York – geographic linguistic diffusion (à la Cukor-Avila Reference Cukor-Avila2012: 635; Tagliamonte & Denis Reference Tagliamonte and Denis2014; Gardner Reference Gardner2017).Footnote 7
Table 1. Sources of data for the present study; total number of quotative tokens in each; prior studies of be like where relevant

2 Methodology
2.1 Data
Speakers from York, UK, and Toronto, Canada, are well examined in the variationist sociolinguistics literature. Comparative studies have examined a wide range of variables, including be like. Here we expand on these studies in two ways: first, by compiling the data from each study with additional concurrently collected data; and second, by adding newly collected data from each city (see table 1). Our goal is to chart as much of the S-curve of change for be like as possible in both cities.
To facilitate real-time comparison, we group our corpora into two ‘eras’ of data collection: 1996–2004 (Era 1) and 2006–13 (Era 2).
Both the Toronto and York English Archives are relatively large corpora of informal spoken English. Both consist of sociolinguistic interviews of a socially stratified cross-section of each city's residents (see Tagliamonte Reference Tagliamonte2012: 102–4 for a full description of both corpora). For this study we draw upon 6,858 quotative tokens from 198 speakers in the Toronto English Archive born between 1916 and 1993. Of note, some of these Toronto speakers were still adolescents when they were interviewed in 2002–4 (see footnote 12). We extracted 3,730 tokens from 86 speakers from the York English Archive born between 1911 and 1981.
The York Stories Corpora are similarly informal small corpora of sociolinguistic interviews with additional York residents collected by undergraduate students between 1996 and 1999. In total 1,374 tokens come from these York speakers, born between 1911 and 1989. New data (N = 2,581) from 121 speakers (26 in York, 95 in Toronto) were collected by undergraduates completing coursework in 2012 and 2013. These Era 2 speakers were all born and raised in each city, with years of birth between 1982 and 1999. All of the data, both new and previously collected, followed an identical interview protocol (e.g. Labov Reference Labov, Baugh and Sherzer1984; Tagliamonte Reference Tagliamonte2006, Reference Tagliamonte2012).
The 1,328 tokens from Durham et al.'s (Reference Durham, Haddican, Zweig, Johnson, Baker, Cockerman, Danks and Tyler2012) study were also drawn from sociolinguistic interviews conducted by undergraduates. Like our Era 2 data, the 44 York speakers from Durham et al.'s (Reference Durham, Haddican, Zweig, Johnson, Baker, Cockerman, Danks and Tyler2012) study were all 18–30 years old.
2.2 Extraction
We modelled our methods for extracting and coding quotative verbs on those of Tagliamonte & D'Arcy (Reference Tagliamonte and D'Arcy2004). These same (or very similar) methods were used by Tagliamonte & Hudson (Reference Tagliamonte and Hudson1999), D'Arcy (Reference D'Arcy2004, Reference D'Arcy2012), Tagliamonte & D'Arcy (Reference Tagliamonte and D'Arcy2007), Buchstaller & D'Arcy (Reference Buchstaller and D'Arcy2009), Tagliamonte & Denis (Reference Tagliamonte and Denis2014) and others. Using this same method for extraction and coding allows our new data to be maximally comparable. As in these other studies, we extracted all instances of verbs introducing ‘constructed dialogue’ (Tannen Reference Tannen and Coulmas1986), including both direct quotation and internal dialogue. Examples of the many different quotative verbs found in the data are shown in (2)–(7).Footnote 8
(2) And my mom said, ‘Just maybe don't tell your sister ’cause Betty can't keep a secret!’ (Female York speaker born 1993)
(3) I was like, ‘Why don't we just get it later, when the mosh pit's finished.’ (Female York speaker born 1992)
(4) The first thing she does is look at me and goes, ‘Who are you?’ (Female Toronto speaker born 1986)
(5) I thought, ‘Oh really? I'm not that keen on that.’ (Male Toronto speaker born 1990)
(6) Someone would shout out in the middle of the street, ‘You trendy wanker!’ (Male York speaker born 1993)
(7) I told her, ‘No way. I can't do this again. Let's go somewhere else.’ (Female Toronto speaker born 1991)
As others have done (Romaine & Lange Reference Romaine and Lange1991: 235; Mathis & Yule Reference Mathis and Yule1994; Ferrara & Bell Reference Ferrara and Bell1995: 265; Tagliamonte & Hudson Reference Tagliamonte and Hudson1999: 166; Cukor-Avila Reference Cukor-Avila2002: 11–12; Tagliamonte & D'Arcy Reference Tagliamonte and D'Arcy2004: 499, etc.), we included ‘zero quotatives’, or cases of direct quotation with no overt quotative verbs, as in (8):
(8) But up until about a year or so, he used to come here, play with running his cab.
Ø ‘Nana, Nana,’ you- he wanted you to play with his cars at midnight on [the] floor. You know, and you just want to go to bed. (laughter)
Ø ‘Are you tired, [NAME]?’
Ø ‘No’. [laughter]
Ø ‘Are you sure you're not tired, [NAME]?’
Ø ‘No’. [laughter]
Ø ‘Would you like to go to bed?’
Ø ‘No’. (Female York speaker born 1953)
We excluded indirect speech, as in (9) and (10), since it is not grammatically licit with the full range of variants (see Schiffrin Reference Schiffrin1981; Schourup Reference Schourup1982; Blyth et al. Reference Blyth, Recktenwald and Wang1990: 216; Cukor-Avila Reference Cukor-Avila2002: 24, etc.):
(9) I always say Americans are more aggressive, but someone said that they're not more aggressive they're just more confident. (Female Toronto speaker born 1952)
(10) The main thing I seem to think about York is how it's developed and, er, not just population-wise but, um, industry and commerce as well. (Female York speaker born 1952)
As per Tagliamonte & D'Arcy (Reference Tagliamonte and D'Arcy2004: 503–4) and others, we also disregarded examples of the be like quotative with an expletive/existential subject, as in (11) and (12). These quotative frames are particular to be like and the less frequent be and be all. Expletive/existential subjects are not grammatically licit with other quotative verbs (Tagliamonte & D'Arcy Reference Tagliamonte and D'Arcy2004: 503–4; Buchstaller & D'Arcy Reference Buchstaller and D'Arcy2009: 303; Fox & Robles Reference Fox and Robles2010: 717; Tagliamonte et al. Reference Tagliamonte, D'Arcy and Rodríguez Louro2016: 830): therefore, they must be put aside when considering the effect of grammatical subject on variation between quotative forms.Footnote 9
(11) It was like, ‘You didn't cook the meatballs’. (Female York speaker born 1992)
(12) And they know that's like, ‘This is what I'm going to get out of it.’ (Male Toronto speaker born 1990)
A total of 15,857 quotative verb tokens were extracted from 525 individual speakers, and coded following the methods outlined in section 2.3 (see table 3).
2.3 Coding and predictions
Tokens were coded for three language-external factors: ‘era’ of recording, speaker year of birth and sex. Be like is thought (and often found) to be associated with young women; further, women's role as linguistic innovators is a familiar observation in linguistic change (Labov Reference Labov1990). Speaker sex is thus an important, potentially confounding variable in our models. Other social factors like social class and education were considered but are not discussed here. Social class and education level were impossible to operationalize meaningfully within our dataset among the young, robust be like-using cohorts in each city. Moreover, social conditioning is not hypothesized to be subject to CRE patterns. That said, individual speaker was considered as a potential random effect in our statistical models.
The internal linguistic effects we examine are those consistently found to govern the use of quotative verbs (see table 2). These factors favouring be like are considered ‘commonly attested’ because they have been found across numerous studies; however, some of these studies are of the same data presented here.
Table 2. Commonly attested factors governing be like use

Across studies, quotative verb choice is constrained by the grammatical person of the subject, with be like occurring at higher rates with first-person subjects (Blyth et al. Reference Blyth, Recktenwald and Wang1990: 221; Romaine & Lange Reference Romaine and Lange1991: 243; Ferrara & Bell Reference Ferrara and Bell1995: 278; Tagliamonte & Hudson Reference Tagliamonte and Hudson1999: 161–3; Tagliamonte & D'Arcy Reference Tagliamonte and D'Arcy2004: 505, Reference D'Arcy2007: 203; Buchstaller & D'Arcy Reference Buchstaller and D'Arcy2009: 306; Buchstaller Reference Buchstaller2011: 86; Tagliamonte & Denis Reference Tagliamonte and Denis2014: 127). Tagliamonte & D'Arcy (Reference Tagliamonte and D'Arcy2007: 203) call the subject constraint a ‘defining characteristic of be like’ because of its ubiquity. Be like is also more likely with internal dialogue rather than with other reported speech (Romaine & Lange Reference Romaine and Lange1991: 266; Tagliamonte & Hudson Reference Tagliamonte and Hudson1999: 163–4; Dailey-O'Cain Reference Dailey-O'Cain2000: 66; Cukor-Avila Reference Cukor-Avila2002: 17–18; Tagliamonte & D'Arcy Reference Tagliamonte and D'Arcy2007: 206; Buchstaller & D'Arcy Reference Buchstaller and D'Arcy2009: 306, etc.). Both of these effects may be a reflex of be like's ability to introduce paralinguistic sounds, gestures, interior reactions, hypothetical speech, and other miscellaneous types of quoted items used especially by narrators recounting past events (Butters Reference Butters1982; Tannen Reference Tannen and Coulmas1986: 321; Blyth et al. Reference Blyth, Recktenwald and Wang1990: 222; Singler Reference Singler2001: 260; Fox & Robles Reference Fox and Robles2010).
The third common pattern observed for be like is that the form is initially favoured with present-tense morphology when the verb also has a past-temporal reference (e.g. Wolfson Reference Wolfson1979; Schiffrin Reference Schiffrin1981; Yule & Mathis Reference Yule and Mathis1992; Ferrara & Bell Reference Ferrara and Bell1995: 265–6; Singler Reference Singler2001: 272–3; Winter Reference Winter2002). This combination of tense and temporal reference is called ‘narrative’ or ‘historical’ present and is often employed, again, when narrating past events. The frequency of be like with the past tense, as in (13), often lags behind its rates with the historical present (14) and the present tense with a non-past temporal reference, as in (15), or habitual reading, as in (16), (D'Arcy Reference D'Arcy2004: 335; Tagliamonte & D'Arcy Reference Tagliamonte and D'Arcy2007: 209; Buchstaller & D'Arcy Reference Buchstaller and D'Arcy2009: 308; Tagliamonte et al. Reference Tagliamonte, D'Arcy and Rodríguez Louro2016: 835).
(13) And I even told her before I went to go do it. I was like, ‘I'm going out to get my belly-button pierced.’ (Female Toronto speaker born 1979)
(14) No one was there so we took all the popcorn in the room and ate it and then she's like ‘you guys are bad.’ (Female Toronto speaker born 1991)
(15) I kind of look back and I’m like, ‘Why was I dating him for so long, I barely saw him?’ (Female Toronto speaker born 1988)
(16) Every time he tells me about stuff I’m just like, ‘Yeah, okay cool, whatever’ and I don't really give it too much of a chance. (Male Toronto speaker born 1978).
If a CRE-like pattern is operative within our data we firstly expect the slopes of the frequency of be like over apparent and real time for each of the contrasting contexts in table 2 to be parallel. Secondly, there should be no interaction between these contrasts and our measures of time. In other words, the contrast in the rate of be like in first- and third-person contexts, in internal dialogue and reported speech contexts, and in historical present and past-tense contexts should not change through time – even if the overall frequency of be like does. Finally, it should not be the case that be like saturates one context before being attested in another. In order to evaluate these three predictions we employ distributional analysis and logistic regression.
3 Results
3.1 Overall distributions
Across our Toronto data there are 8,797 total tokens of 43 different overt quotative verbs, while in York there are 7,074 tokens of 30 verbs. Table 3 shows the number of each quotative verb, along with its overall rate within each dataset, and the year of birth of the oldest speaker to employ it (i.e. its first attestation in apparent time). In both cities be like and say dominate the quotative system. The zero quotative comprises about 13 per cent of each dataset. Aside from be like, say, go and think, no other quotative verb represents more than 1.1 per cent of either dataset.Footnote 10
Table 3. Number of extracted tokens of each attested quotative verb across all Toronto and York data, with percentage of total data per city and year of birth of oldest user indicated. Verbs representing less than 0.1 per cent of data grouped

Figure 1 shows how the top five variants in table 3 are distributed through apparent and real time. Era 1 is divided into four age groups: >60, 45–60, 30–45 and <30 years old. In Era 2, all speakers are <30 years old. The total number of tokens (n) for each age group is reported on the x-axis. In both cities think, go and the zero quotative are relatively stable across age groups; say and be like, however, are not. Older speakers use more say, younger speakers use more be like.

Figure 1. Distribution of quotatives in apparent and real time in Toronto, Canada, and York, UK
Earlier studies on be like using a subset of our data (e.g. Tagliamonte & Hudson Reference Tagliamonte and Hudson1999) inferred that go was growing rapidly in use alongside be like. As our combination of apparent- and real-time data shows, this increased use in go was short-lived.
In both cities, among the speakers in Era 2, be like is the majority variant, reaching a frequency of nearly 75 per cent in Toronto and 60 per cent in York. Figure 1 further shows that the increase in use of be like has slowed down as it approaches ~75–85 per cent, the significance of which we discuss in section 4.
While in figure 1 be like appears to begin increasing in apparent time in York about a generation later than in Toronto, the oldest user of be like in our full dataset is from York, born in 1941. In fact, a series of conditional inference trees (Strobl et al. Reference Strobl, Malley and Tutz2009; Tagliamonte & Baayen Reference Tagliamonte and Baayen2012) identified striking underlying similarities in the data from the two cities. These non-parametric analyses recursively divide the data into groups based on input parameters (here, age and era) where there is a statistically significant difference between the levels of the parameter (here, different ages or the different eras). These analyses are represented as plotted hierarchical partitioned trees.Footnote 11
Figures 2 and 3 show the temporal ‘shock points’ – the years of birth dividing groups of speakers who are significantly different with respect to their proportions of be like – for each city. In Toronto the first major division is between speakers born in and before 1975 (who use be like less than 50 per cent of the time) and all those born after 1975 (who use be like more than 50 per cent). The former group is divided into speakers born prior to 1952, speakers born between 1952 and 1964, and speakers born between 1965 and 1975. The latter group is divided between those born in Era 1 and Era 2. Era 1 speakers are grouped into those born 1976–84, 1985–7, and 1988–93. Era 2 speakers are grouped into those born 1982–91 and 1992–9. In York, the first division is between Era 1 and Era 2 speakers. Era 1 speakers are divided into those born before 1939 (none of whom use be like), those born 1940–68 and those born 1969–89. Era 2 speakers are divided into speakers born 1982–90 and 1991–9. While be like grows slower in York, speakers born in the late 1960s and 1970s are the first substantial users of be like in each community. Also, in both community, speakers born in the mid 1980s to early 1990s represent the generation for whom be like use becomes the majority form. These two groups correspond to Generation X and the Millennial generation (Dimlock Reference Dimlock2019).

Figure 2. Conditional inference recursive partitioning tree: be like in Toronto, Canada. Era 1 speakers born 1916–93; Era 2 Speakers born 1982–99

Figure 3. Conditional inference recursive partitioning tree: be like in York, UK. Era 1 speakers born 1905–89; Era 2 speakers born 1982–99
The Era 1 Toronto cohort born between 1988 and 1993 (marked with an asterisk) were younger than 15 when their data were recorded. Their lower frequency of be like relative to the Era 1 1985–7 group stems from the cohort still being in the process of adolescent incrementation (see footnote 12; Denis et al. Reference Denis, Gardner, Brook and Tagliamonte2019). Speakers born in the same years but Era 2 have a significantly higher rate of be like. The adolescent Era 2 Toronto speakers, born 1992–9 and recorded in 2013, do not have a lower rate of be like than their slightly older peers. This is consistent with a reality in which be like does not ever reach 100 per cent usage, but instead saturates the quotative system at about 75 per cent (see section 4 below). The small effect of incrementation among adolescent York Era 2 speakers, born 1991–9 and recorded in 2013 (marked with an asterisk), is also consistent with this reality. Evidence of incrementation is expected given that the rate of be like in York has yet to reach 75 per cent.
3.2 Contrasting contexts
3.2.1 Content of the quotation
Figure 4 compares the percentage of be like relative to other quotatives for internal dialogue (grey triangles) and direct quotation (black circles) over apparent and real time. Change in apparent time is represented by a solid line, while the continuation of that change in real time is represented by a dashed line.Footnote 12 Change in apparent time is represented by a solid line, while the continuation of that change in real time is represented by a dashed line. In each graph the slopes of the percentage of be like over time for internal dialogue and direct quotation are parallel. In Toronto, be like appears to be nearing the top of an S-curve, as it approaches 75 per cent. At this saturation point, the percentage of be like use for direct quotation and for internal dialogue converge. For York it is not clear if Era 2 represents the top of an S-curve, or whether speakers recorded later in real time would show higher rates of use. Either way, the percentage of be like use is lower than in Toronto for the same era, and the difference in the percentage of be like use with direct quotation and internal dialogue persists.

Figure 4. Percentage of be like over year of birth/era, by content of the quotation in Toronto and York
In our discussion of the frequency trends of the main effects on be like we make use of area plots (figures 5–6, 8–9 and 11–12). Area plots display ‘the continuous analog of a stacked bar chart’ and are ‘used to show how composition of the whole [as a proportion of various factors] varies over the range of x’ (Wickham Reference Wickham2009: 92). In our figures, we plot year of birth (in five year increments) on the x-axis, which visualizes the changing proportion of different contexts over apparent time and the proportion of that context in which be like occurs. In other words, figures 5–6, 8–9 and 11–12 each represent a series of adjacent stacked bar plots in five-year increments, with grey showing the percentage of all the extracted quotative tokens from those five years in which the specific grammatical context occurred, and black showing the proportion of all the quotative tokens from those five years in which the grammatical context occurred and the quotative was be like. These plots facilitate comparing the occurrence of be like by year (along the x-axis) and across contexts (vertically); cross-context parallelism in these graphs is contra grammatical extension.

Figure 5. Percentage of data by content of the quotation (grey), percentage of data by content of the quotation with be like quotative (black)

Figure 6. Percentage of data by content of the quotation (grey), percentage of data by content of the quotation with be like quotative (black)

Figure 7. Percentage of be like over year of birth/era, by grammatical person of the subject in Toronto and York (see footnote 12)

Figure 8. Percentage of data by grammatical person of the subject (grey), percentage of data by grammatical person of the subject with be like quotative (black)
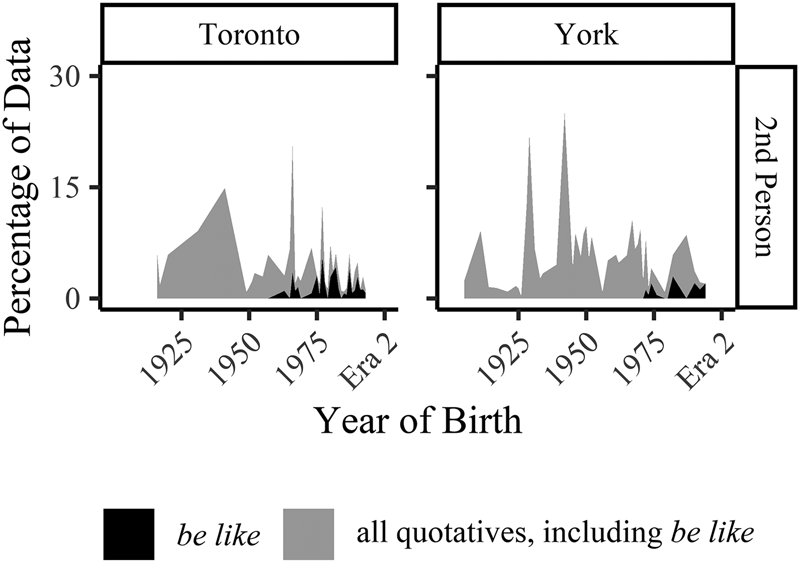
Figure 9. Percentage of data by grammatical person of the subject (grey), percentage of data by grammatical person of the subject with be like quotative (black)

Figure 10. Percentage of be like over year of birth/era, tense/temporal reference in Toronto and York (see footnote 12)

Figure 11. Percentage of data by tense/temporal reference (grey), percentage of data by tense/temporal reference with be like quotative (black)

Figure 12. Percentage of data by tense/temporal reference (grey), percentage of data by tense/temporal reference with be like quotative (black)
Figure 5 shows in grey the overall percentage of direct quotation and internal dialogue contexts in the data. The black indicates the proportion of that percentage in which the quotative used is be like. Figure 6 presents the same type of information, but for be like in less frequent content contexts (note the y-axis range). To aid in understanding what these charts are displaying, imagine the grey sections of the top and the bottom facets for each city in figure 5 plus figure 6 are puzzle pieces: they fit together perfectly to represent the full dataset.
Figure 6 shows the early high relative percentage of be like when quoting non-lexical sounds and gestures, as in (17) – a predictable finding (see Butters Reference Butters1982; Tannen Reference Tannen and Coulmas1986: 321; Blyth et al. Reference Blyth, Recktenwald and Wang1990: 222; Singler Reference Singler2001: 260; Fox & Robles Reference Fox and Robles2010). The first attestation of be like in apparent time, (17), is a York speaker acting out laughter. Looking at both figures, we see that be like is used for quoting direct speech just as early in apparent time as for internal dialogue and or sounds/gestures. In other words, be like did not saturate these contexts before spreading to direct speech; the form begins to increase in all contexts at the same time. Only quoted writing is the exception: be like does not appear in this context in data from speakers born before the mid 1970s. We suggest that this is attributable to the overall low likelihood of quoting written material, plus the initial low likelihood of using be like to quote written material. Once the overall rate of be like increases in the community, the chance of capturing the use of be like in a context like quoting writing – a context that does not occur very often in sociolinguistic interview data – becomes plausible. In the data from speakers born in the late 1970s and onwards the overall rate of be like is high enough that the few instances of quoting writing have the opportunity to occur with be like (more on this below).
(17) …and I was like, ‘[laughter]’ (Female York speaker born 1941)
3.2.2 Grammatical person of the subject
Figures 7–8 show the percentage of be like with first- and third-person subjects. In studies of be like, this is the main contrast examined. In Toronto, the rates of be like in first- and in third-person contexts increase at once and diverge slightly as the they approach 75–85 per cent. This divergence is unexpected given the CRE, but it is not yet clear whether the difference is statistically significant. In York the percentage of be like increases in both contexts in parallel as anticipated.
Second-person subjects with quotatives are generally ‘extremely rare’ (Ferrara & Bell Reference Ferrara and Bell1995: 287; see also Fox Reference Fox, Buchstaller and van Alphen2012: 241). Further, given that interviewers are unlikely to figure prominently in the narratives of the speakers they interview, quotatives with second-person subjects in sociolinguistic interviews are infrequent. That said, our dataset is sufficiently large for some degree of analysis. Figure 9 shows the small percentage of quotation contexts with second-person subjects (grey) and the percentage of those quotatives that are be like (black) (again, note the y-axis range). Be like is not found in second-person contexts among speakers born before the mid 1960s in Toronto and the mid 1970s in York. Be like itself is extremely rare in this time period. Once be like becomes more frequent (i.e. at the acceleration point of the S-curve), we do see second-person subjects clearly. Again, we suggest that this context itself is so infrequent that be like, which is both licit and employed across contexts from the time of its actuation, simply is not captured by sociolinguistic interviews until the variant reaches an overall higher frequency of use within the speech community. We interpret the decade difference in attestation with second-person subjects between Toronto and York as evidence of this developmental process.
3.2.3 Tense/temporal reference
Consistent with figures 4 and 7, figure 10 shows the percentages of be like in each city in the three most frequent, and most frequently analysed, tense/temporal reference contexts: simple past, present tense with a past temporal reference (historical present), and all other present-tense contexts (simple present). While at first blush figure 10 does not offer the same exemplary demonstrations of the CRE as figures 4 and 7, there are a number of crucial observations.
First, there is a clear ceiling effect for historical present in Toronto for speakers born in the 1960s and later. Be like is stable and used over 75 per cent of the time for quotation in this context.Footnote 13 In York, too, the historical present is the context with the highest rates throughout the history of be like. In both cities, in Era 2, the three contexts converge.
The true anomaly in apparent time is the simple present in Toronto. The prediction of the CRE is that when a change actuates, the likelihood of the innovative variant will increase in parallel in all contexts. However, this pattern assumes that how contexts are manifest in individual grammars remains stable.Footnote 14 Figure 10 shows that while the historical present (light grey line) and the simple past (black line) increase in parallel in Toronto, the simple present (dark grey line) has a more erratic pattern. It patterns (i.e. matches in frequency over time) with the historical present for speakers born in the 1960s or earlier, but with the simple past for speakers born in the 1970s and thereafter. What appears to be the case in Toronto is that speakers of different ages treat these contexts in different ways.
We suggest that among the oldest users of be like in Toronto, the relevant distinction is between present-tense morphology (simple and historical present) and past-tense morphology (simple past). For younger speakers the constraint reorganizes to be defined both by morphology and by temporal reference. Of note, this change occurs among speakers born in the late 1960s and 1970s (e.g. Generation X), the exact generation that Tagliamonte et al. (Reference Tagliamonte, D'Arcy and Rodríguez Louro2016) argue spurred be like's expansion. We extend the authors’ argument to suggest that along with codifying be like as the default quotative, the global youth culture and advances in communication technology that emerged during these speakers’ lifetimes (discussed fully in Tagliamonte et al. Reference Tagliamonte, D'Arcy and Rodríguez Louro2016) acted to homogenize slightly dissimilar definitions of the tense/temporal-reference constraint in cities like Toronto, York, Victoria, Christchurch, Perth, etc.
As with the other constraints, having a dataset with more than 15,000 quotatives means that we are able to examine less frequent tense, aspect and temporal reference contexts, as shown in table 4. Table 4 lists the overall percentage of be like in different tense, aspect and temporal reference contexts that occurred in our data. It also lists the year of birth of the oldest speaker to use be like for each tense/temporal reference construction (i.e. be like's first attestation in apparent time in each context). While the token numbers for the less frequently occurring contexts are comparatively small, figure 12, which presents be like's distribution in these contexts over apparent time, makes clear that be like did not need to be robustly entrenched in historical present contexts before arising elsewhere. For example, be like appears with modal would very early, as in (18)–(19), from the oldest be like-using male York speaker and the oldest be like-using male Toronto speaker.
(18) And so he’d be like, ‘Oh, I want to see you’. (Male York speaker born 1943)
(19) People would be like, ‘What? You guys eat what? We like, you know, roast beef. We like beef and potatoes. And what, you have your salad at the end of your meal?’ (Male Toronto speaker born 1952)
Table 4. Number of different tense/temporal reference constructions in Toronto and York, with number/proportion of tokens occurring with be like and year of birth of oldest be like user for each construction indicated

The early appearance of be like with modal would is perhaps predicted given that it can denote habitual actions with past-temporal reference, as in (20)–(21), as well as hypothetical speech, as in (22)–(23) – reportedly highly favouring environments for be like (Romaine & Lange Reference Romaine and Lange1991: 262; see also Labov Reference Labov2018). Although the context itself is infrequent in discourse, the initial probability of be like in this context is evidently very high (cf. Kroch Reference Kroch1989: 205). Thus, it is unsurprising that among the less frequent tense/temporal reference contexts, be like appears earlier with modal would in our data. The other contexts in figure 12 are low both in overall frequency and in the initial probability of be like at actuation.
(20) I remember my mom would always tell me, she’d be like, ‘So what do you want for Christmas or for your birthday?’ and I’d be just like, ‘Lego. I want Lego.’ (Male Toronto speaker born 1989)
(21) My paychecks were always like lower, but then I would be like, ‘What's with that? Why is it lower?’ (Male Toronto speaker born 1982)
(22) If he ever asked her a question, she would always be like, ‘I don't know.’ (Female Toronto speaker born 1986)
(23) If you'd just speak up, I’d be like, ‘Okay, page for page.’ (Female Toronto speaker born 1989)
The relationship between the increased overall likelihood of be like and its use in different grammatical contexts is illuminated when considering which tense/temporal reference expressions occur with be like in the 1976–84 Era 1 cohort in Toronto and the 1982–90 Era 2 cohort in York. These two cohorts represent the first age groups in which be like is used more than 50 per cent of the time overall to introduce quotations. Among speakers older than these cohorts, be like only occurs in historical present, simple present, simple past, and modal would contexts (and a handful of perfect contexts in York). After the use of be like surpasses a rate of 50 per cent, it appears with future temporal reference, participle constructions, infinitive constructions, semi-modal constructions, etc. (compare years of birth of first attestations in table 4). It is conceivable that the overall increase in be like use in these two cohorts is attributable to the increasing number of contexts in which be like can be used. This is how, for example, models of grammaticalization explain increasing frequencies of an innovation over time: as an innovation becomes more general-purpose and spreads to new contexts its overall frequency increases (see Bybee Reference Bybee, Joseph and Janda2003; Heine & Kuteva Reference Heine and Kuteva2005, etc.). If this were true, we ought to find evidence of an additive effect in the current data. However, the overall rate of be like when the infrequent contexts are removed is 74.5 per cent (vs 61.9 per cent with all contexts) for the 1976–84 Toronto speakers and 68.9 per cent (vs 58.7 per cent with all contexts) for the 1982–90 York speakers (see table 5). This indicates that the overall increased likelihood does not rely on a new availability of these infrequent contexts. Rather, with be like at an overall higher probability in the ambient language, the variant begins to be captured in lower frequency contexts in sociolinguistic interviews.
Table 5. Distribution of quotative be like by tense/temporal reference for two cohorts

3.3 Multivariate analysis
We next turn to regression analysis to test for the presence of an interaction between our measure of time and each of the three sets of contrasts discussed above. Our prediction is that if the slopes of the S-curves observed in figures 5, 8 and 11 are truly parallel, the interaction between our measure of time and each of these contrasts will not be statistically different from zero. Further, this finding should arise even when the confounding effect of speaker sex, and the potential random effect of individual speakers’ differing contributions of tokens to the dataset are taken into account.
We test our predictions by building mixed-effects logistic regression models for each city using the lme4 package in R (Bates et al. Reference Bates, Maechler, Bolker and Walker2015). We focus on speakers from Toronto born after 1947 and speakers from York born after 1940, as speakers older than this do not use be like in our data. We also set aside all tokens of grammatical contexts other than those represented in figures 5, 8 and 11. In our models the dependent variable is the binary selection of be like or not be like (i.e. other overt quotatives in the variable context). Our model includes the following parameters (or factors/effects/predictors): main fixed effects of Content of the Quotation, Grammatical Person of the Subject, Tense/Temporal Reference, Sex and Year of Birth.Footnote 15 We also include pairwise interactions between Year of Birth and Content, Person, Tense/Temporal Reference and Sex. Our model further includes a random intercept of Speaker. For both models the AIC (Akaike information criterion) is an estimation of the prediction error; the marginal R 2 (calculated using the MuMIn function (Bartón Reference Bartón2019)) is the proportion of the variation explained by the fixed effects and the conditional R 2 is the proportion of the variation explained by the fixed effects plus the random effects.
Tables 6 and 7 show these two models. The coefficients for each of our parameters’ levels are reported in log-odds along with their significance levels and standard errors. For every parameter level (including each reference level), token counts and the proportion of be like for that level are reported. Log-odds are centred around zero; positive log-odds indicate a favouring effect relative to the reference level, while negative log-odds indicate a disfavouring effect relative to the reference level. Nominal (e.g. discrete) parameters are coded using treatment contrast coding: for each nominal parameter, one of the factor levels is treated as a reference level against which the other level(s) is/are compared. This is noted in tables 6 and 7 for each factor. Thus, for the parameter Content (vs internal dialogue), the direct speech level of the Content factor is being compared against the reference level (internal dialogue). The significant p-value for Content, signalled by asterisks in table 6, indicates that the direct speech level is statistically different from the internal dialogue level, and the polarity/sign of the coefficient tells us the direction of this difference. In this case, the negative polarity/sign of the coefficient (−0.82) tells us that direct speech contexts have a lower probability of be like than internal dialogue contexts. The absence of a significant p-value for direct speech in table 7 indicates that, while there may be a difference in the proportion of be like in internal dialogue and direct speech contexts, the difference in probabilities between these contexts cannot be statistically distinguishable from chance variation.
Table 6. Toronto – mixed-effects logistic regression testing the fixed effects of Content of the Quotation, Grammatical Person of the Subject, Tense/Temporal Reference and Sex; fixed interactions between Year of Birth and Content of the Quotation, Grammatical Person of the Subject and Tense/Temporal Reference; and a random intercept of Speaker on the realization of quotative be like

Notes: * p < 0.05; ** p < 0.01; *** p < 0.001.
Treatment contrast coding; treatment levels are indicated. Model converges with BOBYQA optimizer with <20, 000 iterations. Coefficients reported in log-odds. Correlation of fixed effects r < |0.31|.
a simultaneous test for General Linear Hypothesis
past/past vs pres./non-past = 0: COEFF. -0.31, Sig. level * , S.E. 0.13
b mean year of birth = 1981, s.d. = 11.6
c simultaneous test for General Linear Hypothesis
Y.o.B:past/past vs Y.o.B:pres./non-past = 0: COEFF. 0.04, Sig. level ** , S.E. 0.02
d mean by speaker = 59%, s.d. = 21%
Table 7. York – mixed-effects logistic regression testing the fixed effects of Content of the Quotation, Grammatical Person of the Subject, Tense/Temporal Reference and Sex; fixed interactions between Year of Birth and Content of the Quotation, Grammatical Person of the Subject and Tense/Temporal Reference; and a random intercept of Speaker on the realization of quotative be like

Notes: * p < 0.05; ** p < 0.01; *** p < 0.001.
Treatment contrast coding; treatment levels are indicated. Model converges with BOBYQA optimizer with <20, 000 iterations. Coefficients reported in log-odds. Correlation of fixed effects r < |0.32|.
a simultaneous test for General Linear Hypothesis
past/past vs pres./non-past = 0: COEFF. 0.98, sig. level, S.E. 0.87
b mean year of birth = 1978, s.d. = 15.5
c simultaneous test for General Linear Hypothesis
Y.o.B:past/past vs Y.o.B:pres./non-past = 0: COEFF. -0.05, sig. level , S.E. 0.08
d mean by speaker = 27%, s.d. = 22%
The following contrasts are statistically significant in the Toronto data, as indicated by their significant p-values: Content; Person; Tense/Temporal Reference; and Sex. In each case the reference levels – internal dialogue, first person, past tense/present temporal reference (historical present) and women – favour the use of be like relative to the other levels: direct speech; third person; past tense/past temporal reference (simple past) and present tense/non-past temporal reference (simple present); and men. An additional simultaneous test for the general linear hypothesis for the contrast between simple past and simple present was performed using the glht function in the multcomp package in R (Hothorn et al. Reference Hothorn, Bretz and Westfall2008). The test determined that the probability of observing the coefficient (−0.31 log-odds) given the null hypotheses (no difference) was <5 per cent (see table 6 note a), i.e. the contrast is statistically significant, with simple past favouring be like relative to simple present. The continuous factor Year of Birth was also statistically significant; for every +1 year increment in year of birth, the likelihood of be like increases by +0.12 log-odds.
The interaction between Year of Birth and Person was not found to be significant. This means we must infer that the two parameters are statistically independent (at least within the context of our model). It is important to note that the underlying assumption of the regression analysis is that Year of Birth and other parameters are independent (i.e. that the CRE is operational). Significant interactions provide justification for rejecting this assumption. In the absence of significant interactions we accept that our assumption is valid. In other words, these regression models do not test for the presence of the CRE; instead they assume it, and test for evidence against it (see Paolillo Reference Paolillo2011). Therefore we must be moderate in our claim that our models represent evidence of the CRE in light of the possibility of Type 2 errors. Given the above proviso, we can say that there is no significant evidence that the contrast between first-person and third-person subjects varies as Year of Birth changes, even if the overall likelihood of be like does. We therefore assume that these two contexts increase through time at a constant rate. The same statistical independence for the interaction between Year of Birth and Tense/Temporal Reference is reported. This suggests that the contrast between historical present and simple past, and between historical present and simple present does not vary significantly over time. The relationship, however, between simple past and simple present is not consistent through time. A simultaneous test for the general linear hypothesis that the contrast between simple past and simple present is independent from Year of Birth was performed. The test determined that as Year of Birth increases, the difference between simple present and simple past also decreases – or rather, as Year of Birth increases, the likelihood that the difference between these two contexts is nil also increases. This finding is unsurprising given the crossover pattern for tense/temporal reference in apparent time in figure 11.
The interaction between Year of Birth and Content is also significant. The contrast between internal dialogue and direct speech decreases as Year of Birth increases – or rather, the likelihood that the difference between the two is nil increases (as shown by the positive polarity/sign of the interaction's coefficient). Again, this is unsurprising given the levelling of these constraints (i.e. convergence of be like rates across contexts) shown among speakers born in the 1980s, the 1990s and Era 2 in figure 4.
The mean Year of Birth among be like users in the Toronto data is 1981 ±11.6, so half of the data comes from the specific cohort where the Content contrast appears to be levelling. When the data were partitioned into three age categories, 30–45 in Era 1, <30 Era 1, and Era 2 (Appendix, tables A1–A3), it was found that the Content contrast is significant among both Era 1 cohorts, but not significant among Era 2 speakers – verifying that this significant interaction is due to levelling of constraints as the overall rate of be like use reaches ~75–85 per cent. This partitioning also elucidates the significant interaction between simple past and simple present. Among 30–45-year-old Toronto speakers in Era 1 there is a significant difference between historical present and simple past, and between simple past and simple present, but not between historical present and simple present. In other words, the contrast is morphological. Among <30 Era 1 speakers and among Era 2 speakers, there is a significant three-way contrast, but the relative ranking of the levels is different. For <30 Era 1 speakers the contrast is historical present > simple present > simple past, for Era 2 speakers it is historical present > simple past > simple present. While the conceptualization of this constraint changes from morphological to morphological plus temporal reference through time, the main contrast between (historical) present and other contexts has not changed.
Turning to York we find an almost identical pattern. There is a significant contrast between first-person and third-person subjects, between historical present and simple past contexts, and between women and men. Unlike Toronto, there is not a significant contrast between internal dialogue and direct speech; however, this is consistent with findings from other communities (Rodríguez Louro Reference Rodríguez Louro2013; Tagliamonte & Denis Reference Tagliamonte and Denis2014) in which content of the quotation is found to operate inconsistently as a constraint on be like.
In York the continuous factor Year of Birth is also significant. For every +1 year increase in Year of Birth the likelihood of be like increases by +0.16 log-odds. None of the interactions tested are significant, leading us to assume that the constraints of Content, Person, and Tense/Temporal Reference are independent from Year of Birth. For Person and Tense/Temporal Reference we cannot reject the assumption that the contrast between first-person and third-person subjects, and between historical present and simple past contexts remain constant as the overall likelihood of be like increases. For Content the contrast between internal dialogue and direct speech neither develops nor disappears over time.
The status of simple present contexts in York is somewhat difficult to determine. There are only 59 total tokens of this context in our regression dataset, of which only 12 occur with be like. Only one be like token occurs in the 26 simple present contexts in all the Era 1 data. While a significant contrast between historical present and simple present contexts and an independence between simple past and simple present contexts are reported in table 7, it would be impossible to state reliably whether there is a two- or a three-way tense/temporal reference contrast within the city's community grammar.
Like the Toronto data, the York data was also partitioned and regression analyses were performed on each partition (Appendix, tables A4–A6). There are only 12 be like tokens among speakers 30–45 in Era 1 in York; table A4 thus shows only distributional data. For both <30 Era 1 speakers and Era 2 speakers the same pattern of contrasts reported in table 7 was found, again pointing towards parallel increases in be like within contrasting contexts through time.
3.4 A note on sex
There is a consistent sex effect in York, with women leading in the use of be like; however, the significant interaction between Sex and Year of Birth indicates that this contrast changes through time. The negative polarity/sign of the interaction's coefficient indicates that as Year of Birth increases, the probability that the contrast between women and men is nil decreases. In other words, the sex effect is stronger among younger speakers compared to older speakers in York.
In Toronto, while the likelihood of be like among women is significantly greater than among men when all speakers born after 1948 are considered together, in each of the three Toronto age partitions reported in the Appendix A the contrast between women and men is not significant. This is most likely an artefact of partitioning; with a greater number of tokens, any tests on the full regression dataset will have more statistical power to detect differences in proportions. It is also important to note that the interaction between Sex and Year of Birth was not found to be significant, leading us to conclude that the contrast between women and men does not change through time.Footnote 16
Given that sex is a potential confounding external factor for our current analysis of be like and its CRE-like pattern, we included it in our models; however, we point readers to Denis et al. (Reference Denis, Gardner, Brook and Tagliamonte2019) for a more in-depth discussion of quotatives and sex in our data. See also Buchstaller (Reference Buchstaller2014: 99–100, 109) for a survey of sex effects for be like across studies.
4 Discussion
Along with Tagliamonte et al. (Reference Tagliamonte, D'Arcy and Rodríguez Louro2016), we find evidence of the genesis of be like very close in apparent time even in communities that are geographically far apart. This casts doubt on an account of be like around the world that rests primarily on conventional geographic diffusion. For example, Tagliamonte & D'Arcy (Reference Tagliamonte and D'Arcy2007: 212), hypothesize that be like is a product of California. If this is true, and if be like has spread outwards like a wave from California – as per the Wave Model (Trudgill Reference Trudgill1974, Reference Trudgill1986; Bailey et al. Reference Bailey, Wikle, Tillery and Sand1993; Labov Reference Labov, Britain and Cheshire2003) – be like is predicted to arrive in Toronto before York, simply because Toronto is closer to California than York. Furthermore, if innovations instead spread first to big cities before spreading to smaller peripheral communities – as per the Gravity Model (Trudgill Reference Trudgill1974; Chambers & Trudgill Reference Chambers and Trudgill1998: 166, etc.) – be like is also predicted to arrive in Toronto before York because York is smaller in both size and population compared to Toronto and less culturally and economically prominent relative to other British cities compared to Toronto and other North American cities. While the S-curves we find for both cities are offset from each other in apparent time, it is demonstrably not the case that be like is found earlier in apparent time in Toronto than in York. The earliest attestations of be like in our dataset are from York, not Toronto; further, the generational breaks dividing age-cohorts with significantly different proportions of be like are at near-identical points in apparent time. The actuation of the change appears to have been concurrent in the two cities, along with Victoria, Perth and Christchurch (Tagliamonte et al. Reference Tagliamonte, D'Arcy and Rodríguez Louro2016: 832–4). Toronto simply has a more rapidly changing quotative system compared to York. The two cities share a time of actuation and generational divides, but be like propagates through the communities at a different rate.
The similarity of the years of birth with statistically significant increases in be like use between York and Toronto – and thus Victoria, Perth, and Christchurch – suggests that while be like has developed more slowly in York, the city was not immune to the lightning-fast global diffusion of be like charted by Tagliamonte et al. (Reference Tagliamonte, D'Arcy and Rodríguez Louro2016). Our findings are also compatible with the alternative proposal that the rise of be like was a parametric-like change that was primed to occur in varieties of English around the world at the same time (see also D'Arcy Reference D'Arcy2017) and was accelerated in frequency by the increased globalization and late-twentieth-century youth culture in big cities that Tagliamonte et al. (Reference Tagliamonte, D'Arcy and Rodríguez Louro2016) argue contributed to its geographic diffusion. In addition to finding similarity in constraints across cities, the observable CRE pattern – a pattern predicated on a parametric-like change – within each city provides further evidence to support this proposal.
Wave models of change (Bailey Reference Bailey1973, etc.)Footnote 17 and grammaticalization (Hopper & Traugott Reference Hopper and Traugott2003, etc.) both predict that an innovation will take hold in a single grammatical context before spreading to others. However, this is not what occurs for be like in our data. Rather, be like usage increases in parallel across contexts for grammatical person, content of the quotation and tense/temporal reference. Even in lower-frequency contexts, e.g. second-person subjects, which have gone understudied in the be like canon, be like does not appear after the variant has become entrenched in dominant contexts, but once the overall proportion of be like is high enough – about 50 per cent. Under this interpretation, later appearances of be like in infrequently-occurring contexts is not due to an extension of be like, but is epiphenomenal to the low likelihood of be like in these contexts at actuation, plus these contexts’ overall low frequency.
From the perspective of statistical modelling, our findings have implications for future studies of linguistic variants that are likely to reach saturation below 100 per cent of a system. While be like has unquestionably taken over as the default quotative verb among the youngest speakers in York and Toronto, used nearly categorically by some speakers, our results suggest saturation of the form actually occurs at ~75–85 per cent usage within the community, as evidenced by be like's level constraints and slower trajectory at that rate. Quotative verbs that connote more specific kinds of speech events such as scream, ask, tell, etc. remain possible and functional, accounting for the other 20 per cent. This is unlike the change, for instance, to the requirement for periphrastic do in certain contexts whereby the use of do has become categorical in contemporary English. Logistic regression models assume a binary dependent variable and thus, when used for modelling a change, assume a trajectory from 0 to 1 (or 0 per cent to 100 per cent). A consequence of this is that fitting the rise of be like or a similar change to a logistic model in several contexts may obscure the similarity (or identification) of the slopes for those contexts, especially if one context has reached the upper threshold (here ~75–85 per cent). In figure 13 we plot simulated data (in black)Footnote 18 to show what happens when a logistic regression models a change, such as this, that reaches saturation between 0.75 and 0.85 (here 0.8 or 80 per cent, black horizontal line) rather than 1 (100 per cent, grey horizontal line) and has three contexts that differ with respect to their intercepts but not their slopes. The difference in the intercepts here is akin to different initial probabilities of the innovation across contexts (e.g. with be like, internal dialogue and first-person subjects would have a higher intercept than direct speech and third-person subjects). The parallel slopes represent the parallel rate of change in probability over time. The grey lines of best fit are produced with a logistic regression that models the interaction between time and context in the simulated data.

Figure 13. Saturation mismodelling: simulated data across three contexts (A, B and C) with a logistic curve (black) compressed to an 80 per cent endpoint of the S-curve, and logistic curves (grey) set to 100 per cent for comparison
The most important observation here is that the slopes of the grey lines of best fit are not identical to each other and are not 0.1 (the slope we have simulated for the three contexts). The logistic regression attempts to model the simulated data with an upper boundary of 1, but the top of each curve occurs at a lower probability (0.8). We suggest that this demonstration captures what is likely happening with be like, and possibly with other changes where saturation occurs with persistent low-frequency, but semantically-richer co-variants (e.g. changes to intensifiers, Ito & Tagliamonte Reference Ito and Tagliamonte2003; general extenders, Overstreet Reference Overstreet1999; and adjectives of weirdness, Tagliamonte & Brooke Reference Tagliamonte and Brooke2014). For this reason, standard ways of modelling the CRE (i.e. parallel slopes) might miss effects that are completely consistent with the CRE (for instance, in the years 45 to 95 in figure 13) but on the surface seem to be occurring at different rates. The significant interaction between Content and Year of Birth in the Toronto data is an example of this.
We agree with Tagliamonte et al. (Reference Tagliamonte, D'Arcy and Rodríguez Louro2016) that be like appeared simultaneously in a range of community grammars around the English-speaking world. While we remain noncommittal as to the precise nature of the change, the findings from this study demonstrate that its development follows a trajectory consistent with the CRE with only minor revisions.
Given that the quotative system of English was undergoing change towards reported thought rather than speech (D'Arcy Reference D'Arcy2012: 361; see also Tagliamonte & D'Arcy Reference Tagliamonte and D'Arcy2007: 211), the arrival of a feature such as be like may well have been inevitable. The bottom of the S-curve may have been located farther back in the twentieth century than the first recorded attestations of be like, but with a very low initial likelihood, so it took a while to be captured in written or spoken documentation. If ‘linguistic change begins with a hospitable grammatical environment, but requires a social force to drive it forward’ (Tagliamonte & D'Arcy Reference Tagliamonte and D'Arcy2007: 212; see also Labov Reference Labov2001: 462), it is likely that be like was possible before it emerged as a productive variant in the vernacular.
This explanation does not preclude the possibility that be like has reached some smaller and/or more-remote communities locations through geographic diffusion. In situations where be like has diffused from a core urban area outwards, a temporal lag can be expected in the initial use of be like, as may be the simplification of constraints that results from adult acquisition (Labov Reference Labov2007: 383; Tagliamonte & Denis Reference Tagliamonte and Denis2014: 119; Tagliamonte et al. Reference Tagliamonte, D'Arcy and Rodríguez Louro2016: 481). This is the case for communities like Springville, in east central Texas (Cukor-Avila Reference Cukor-Avila2002), rural Ontario (Tagliamonte & Denis Reference Tagliamonte and Denis2014), St John's, Newfoundland (D'Arcy Reference D'Arcy2004), and Cape Breton, Nova Scotia (Gardner Reference Gardner2017). Amazingly, however, just as with the larger communities, once be like takes root within these peripheral communities the constraints governing the use of be like are constant through apparent time.Footnote 19
5 Conclusion
We have now presented a benchmark analysis of be like in two major varieties of English (Canadian and British) using a dataset comprising more than 15,000 tokens and a battery of statistical tools, including conditional inference trees and mixed-effects logistic regression analyses with the random effect of speaker and three linguistic effects well known in the literature. Our approach has not only given us considerable statistical confidence in our findings but enabled us to include insights from the results from infrequent grammatical contexts (e.g. second-person subjects) that have been mostly overlooked in other studies. The simultaneous appearance of be like in Toronto, Canada, and York, UK may be a consequence of a parametric-like change affecting multiple dialects of English at once. If the emergence of be like is the result of this type of underlying systemic development, it provides a foundation for why be like could emerge simultaneously and with strikingly similar contextual constraints over wide geographic distances. Our findings are consistent with the Constant Rate Effect – slightly modified – suggesting that it is a useful model for the be like trajectory. Indeed, if our results are any indication, they also demonstrate that the signature pattern of the CRE does not require a protracted time depth to be observable – or, for that matter, operational. Indeed, our investigation compels us to suggest a methodological advancement to the CRE. In a system such as quotatives, saturation occurs at ~75–85 per cent rather than 100 per cent. Moreover, discourse-pragmatic variables (Tagliamonte & Denis Reference Tagliamonte and Denis2010; Denis Reference Denis2015) or those with a large number of semantically rich minor variants, such as intensifiers (Ito & Tagliamonte Reference Ito and Tagliamonte2003; D'Arcy Reference D'Arcy2015b) or adjectives within a semantic field (Tagliamonte & Brooke Reference Tagliamonte and Brooke2014) are unlikely to resolve into categoricity. This makes the assumption of saturation at 100 per cent in the original conception of the CRE untenable for these changes. Yet the CRE pattern is strongly evident. This leads us to the logical corollary that the CRE does not require logistic curves that reach a maximum of 100 per cent at the top of the S-curve of linguistic change in progress. Nonetheless, our findings come from only a single change and the top of the S-curve remains unexplored in the panoply of linguistic changes in progress. We eagerly look forward to tracking into the future whether the results presented here can be replicated for other contemporary innovations.
Appendix: Regression analysis tables
Below we offer additional regression analyses for three age partitions for each city. For the purposes of our analysis, we group Era 2 into a single set, as the speakers were all <30 years old. We partition the Era 1 data into two age groups: 30–45 and <30. These are the age groups for which there are enough instances of be like in our pared data to reliably run regression analyses. For the 30–45-year-olds in York, there is actually still too little be like for a reliable regression analysis, but we include this group for comparison. In Toronto, these ages correspond to the birth years 1959–74, and >1974; in York, 1944–69, and >1969. These are not an exact match for the conditional inference trees in figures 2 and 3, or the data used in tables 6 and 7, but they are close enough that we expect them to capture the generational divides inherent in the emergence of be like. They are also the age divisions employed by past studies on this same data (e.g. Tagliamonte & Hudson Reference Tagliamonte and Hudson1999; Tagliamonte & D'Arcy Reference Tagliamonte and D'Arcy2004; Durham et al. Reference Durham, Haddican, Zweig, Johnson, Baker, Cockerman, Danks and Tyler2012), so their use makes these analyses maximally comparable.
Table A1. Toronto – mixed-effects logistic regression testing the fixed effects of Content of the Quotation, Grammatical Person of the Subject, Tense/Temporal Reference and Sex and a random intercept of Speaker on the realization of quotative be like

Table A2. Toronto – mixed-effects logistic regression testing the fixed effects of Content of the Quotation, Grammatical Person of the Subject, Tense/Temporal Reference and Sex and a random intercept of Speaker on the realization of quotative be like
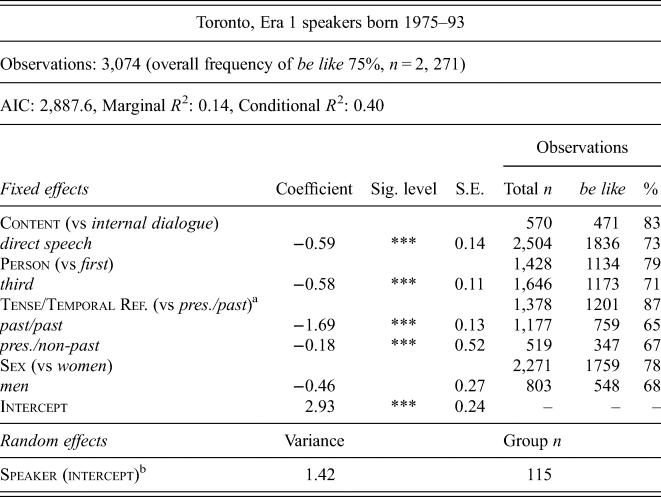
Table A3. Toronto – mixed-effects logistic regression testing the fixed effects of Content of the Quotation, Grammatical Person of the Subject, Tense/Temporal Reference and Sex and a random intercept of Speaker on the realization of quotative be like

Table A4. York – mixed-effects logistic regression testing the fixed effects of Content of the Quotation, Grammatical Person of the Subject, Tense/Temporal Reference and Sex and a random intercept of Speaker on the realization of quotative be like

Table A5. York – Mixed-Effects logistic regression testing the fixed effects of Content of the Quotation, Grammatical Person of the Subject, Tense/Temporal Reference and Sex and a random intercept of Speaker on the realization of quotative be like

Table A6. York – mixed-effects logistic regression testing the fixed effects of Content of the Quotation, Grammatical Person of the Subject, Tense/Temporal Reference and Sex and a random intercept of Speaker on the realization of quotative be like


