


Introduction
In the last decade, several works were related to the development of fast codes designed specifically for dose calculation in radiotherapy.Reference Ahnesjö and Aspradakis1–Reference Beckham, Keall and Siebers3 The Monte Carlo (MC) method has been demonstrated to be the most accurate method for dose calculationsReference Fanti, Marzeddu and Pili4–Reference Rogers, Walters and Kawrakow8 compared with conventional radiation therapy treatment planning systems, mainly in predicting dose in complicated geometries. Most of the algorithms that exist in several commercial treatment planning systems are approximate and have limited accuracy, and their primary drawback is that they do not adequately take into account the changes in electron transport near interfaces of density inhomogeneities, such as lung and bone, leading to a wrong estimation of the dose distributions (even up to a 10% or more).
Despite the shortcomings of using MC methods as a computationally intensive method (long calculation times, software and hardware complex infrastructure), the development of computer technology and variance reduction techniques have enabled the establishment of three-dimensional MC methods for routine clinical treatment planning. The other major limitation of these techniques is that, for clinical application, detailed information on the beam characteristics including the energy, angular and spatial distributions of the particles is required. Uncertainties associated with the mentioned characteristics will directly result in a systematic error in dose calculations. Before to this work, different authors have studied the comparison between MC phase space (PS) calculations and measurements, using different linear accelerator (linac) models and operational modes.Reference Ding9–Reference Deng, Jiang and Kapur13 All of them encountered that tuning procedures must be implemented owing to the lack of information from the manufacturers related to the treatment head components.
The present work is devoted to determining the characteristics of a clinical 6 MV photon beam, simulating the transport of the particles through the treatment head using two different well-probed MC codes, MCNPX 2·6 and EGSnrc-BEAM.Reference Pellowitz6, Reference Rogers, Faddegon, Ding, Ma, We and Mackie7 In this approach, electrons were injected one at a time through the exit window of the treatment head, and their subsequent passage through its materials was followed by computer simulation, potentially accounting for all physical processes of clinical significance. PSD information (charge, energy, weight, direction and position of the particle, as well as a tag that records detailed information about the particle’s history such as where the particle has interacted) can be recorded for each and every particle that escapes the treatment head. The main disadvantage of this method is that storage requirement for the PS files and the simulation of a single beam represent a considerable burden on the computing resources of an average radiotherapy department. Alternative beam reconstruction methodsReference Bush, Popescu and Zavgorodni14–Reference Tzedakis, Damilakis and Mazonakis18 have been implemented as direct input to dose-calculation codes.
This study was also aimed directly to get a better understanding of the radiation transport in the linac’s radiation head. The influence of field size on different scored histograms of spectral, radial and angular distributions of primary, scattered and leakage radiation through all components of the linac treatment head has been studied to use them as primary input source parameters for further alternative beam reconstruction methods.
Materials and Methods
MC simulations
A full linac description for MC simulations of dose depositions in phantoms is inefficient and extensively time consuming. In all the cases, the particle transport has been split, first, into the interactions of the primary beam through the target, flattening filter and the ionisation chambers, generating different PS above the collimation system. The second step in our simulations includes the dose estimation in water or equivalent tissue materials, using as primary source particles previously scored PSD, and describing their interactions with the components of the Elekta SL-25 linac collimation system (Elekta Precise®, Elekta Oncology Systems, Elekta, Stockholm) (multilayer and backup jaws) and the phantom. Therefore, the simulated geometry has been separated in a linac head target and a field collimation–phantom section.
The only ‘energy-dependent’ part of the simulated geometry includes the target section containing the X-ray target, the backing of the target, the primary collimator, the filter turret with the 6 MV flattening filter, the monitor chamber of the linac and the backscatter plate, avoiding scattered radiation from the jaws to reach the monitor chamber. The geometry of the collimator section conformed by the 80-leaf multilayer collimation system (MLC) and the upper and lower jaws depends on field size only, but is identical for all tested energies. Details of the construction and materials were obtained from original drawings made available by the manufacturer. In addition, the initial electron energy (E 0) and full-width at half-maximum (FWHM) were set to E 0=6·0 MeV and FWHM=1·0 MeV, and the focal spot size of the electron beam and its FWHM ~1 mm were obtained from the manufacturer’s data. Details of the simulated geometry and materials are displayed in Figure 1. The co-ordinate system of the accelerator model is defined as follows: the positive z-direction extends from the electron target towards the isocentre (beam-line), the positive x-direction extends from the isocentre towards the right edge of the treatment couch (cross-plane) and the positive y-direction extends from the isocentre towards the direction away from the gantry (in-plane).
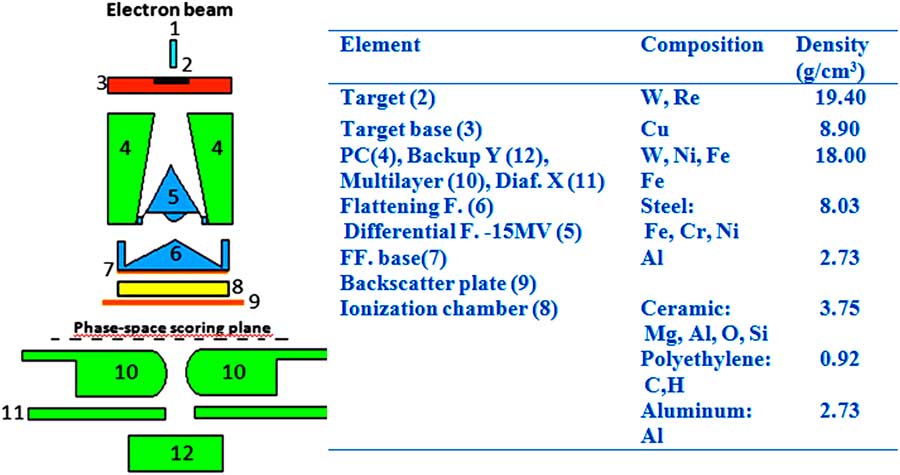
Figure 1 MCNPX view of the gamma linac head model.
Finally, for the calculation of beam characteristics, two different types of voxelized phantoms were used, a homogeneous full scatter water phantom (30×30×30 cm3) and two heterogeneous water-tissue-equivalent material (bone and lung) phantoms, as shown in Figure 2. The voxel dimensions during the simulations varied with position from the beam’s central axis in order to account for dose gradients in the per cent dose depth (PDD) and lateral dose profile (LDP) curves. PDD and LDP were generated for 5×5, 10×10 and 20×20 cm2 field sizes. The PDDs were tallied along the central axis, whereas the LDPs were sampled at different depths (1·5, 5·0 and 10·0 cm). All calculations were performed using a distance between the source and the phantom surface (SSD) of 100 cm. For the calculation of PDDs, voxels were built with a cross area of 1 cm2, and the thickness was chosen to take into account the steep variations in the build-up region and the slow fall-off in the tail, being 0·2 cm until 5·0 cm depth and 0·5 cm in the rest of the phantom. For the LDP, typical voxels of 0·5×0·5×0·5 cm3 were used to value the energy deposition in the different materials of the phantoms. Lung and bone-equivalent tissue composition was obtained from the ICRU.19
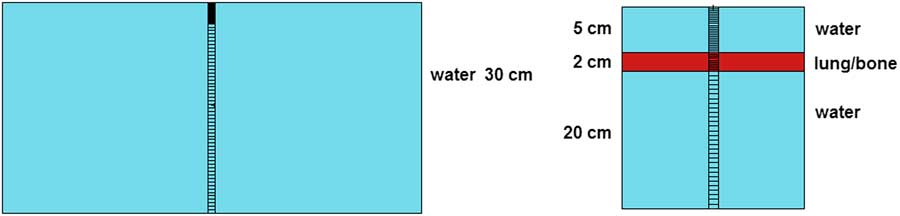
Figure 2 MCNPX sketch of both phantoms used for beam dose characterisation.
Simulations for the PS file generation were run using 100 millions of primary events and recording around ten million useful particles in the PS in order to get a statistical uncertainty <2% in further calculations. For each particle that crossed this surface, its type of particle, position, energy and angular distribution was stored. Spectra and angular histograms have been generated by sampling the energy and particle spatial distribution inside the area of interest in equally spaced energy and cosine bins (0·025 keV, 0·17 rad). Meanwhile, for fluence profiles, sampling was carried out using equally spaced rings around the beam axis of 1 mm radius.
Different variance reduction techniques controlling the particle transport were implemented in both codes to speed up simulation:
∙ directional bremsstrahlung splitting and bremsstrahlung cross-section enhancement (NIST database);
∙ electron range rejection ESAVE=2 MeV;
∙ AE=700 keV, ECUT=700 keV, AP=10 keV and PCUT=10 keV;
∙ bremsstrahlung and secondary particle biasing;
∙ weight windows providing an importance function in space–time or space–energy controlling particle weights.
The validation of the accelerator model followed a fine-tuning procedure to adjust the parameters as described in several previous studies.Reference Deng, Jiang and Kapur13, Reference Mesbahi, Reilly and Thwaites20–Reference Kim, Han, Kim and Kim22 The FWHM of the electron-beam Gaussian energy distribution was kept constant (FWHM=1 MeV), and several iterations adjusting both the mean energy and radial intensity distribution were performed. Once the agreement between the calculated curves and measured data were within the pre-defined acceptance criteria, optimal beam parameters were scored as input beam model. The chosen criteria were as follows: for the PDD curves, the average of the per cent local difference between the measured and calculated dose in the fall-off region (maximum to 30 cm) had to be <2%, and for LDP curves the average of the per cent local difference between the measured and calculated dose in the plateau region had to be <2% and the average distance in the penumbra region had to be <0·2 cm.
Experimental measurements
Photon beams were generated using an Elekta Precise SL-25 linac accelerator (Elekta Precise®, Elekta Oncology Systems). Absorbed dose to water measurements were made using a PTW-MP3 30×30×30 cm3 water phantom and a PTW 31010 Diode Semiflex ionisation chamber (PTW manufacturer) coupled with a scanner. A computer-controlled motion system (PTW manufacturer) with vertical and horizontal scanning with 1 mm step was used to obtain depth distributions on the central axis as well as LDPs at three different depths: d max=1·5, 5 and 10 cm, with regard to the reference dataset for our radiotherapy treatment planning system. Beam intensities were fixed to 100 MU in all the studies.
The PTW 31010 cylindrical chamber (PTW manufacturer) has an inner diameter of 5·5 mm and a length of 6·5 mm. The sensitive volume (0·125 cm2) is approximately spherical, resulting in a flat angular response and a uniform spatial resolution along all three axes of a water phantom. The effective point of measurement for the ion chamber was taken as 0·6 R in (where R in is the radius of the chamber cavity) upstream of the centre of the chamber, consistent with the AAPM TG-51 protocolReference Almond, Biggs and Coursey23 or IAEA code of practice.24 The chamber is covered by a wall of sensitive volume of 0·55 mm PMMA (1·19 g/cm3) and 0·15 mm graphite (0·82 g/cm3).
Results and Discussion
PS and phantom surface histograms
As was previously described, the simulated geometry has been separated in a linac head target and a field collimation–phantom section. By analysing both PS files on the top of the collimation system and for the different field sizes at the phantom surface, differences between the radiation beams can be easily pointed out. Our work focuses on the spectral, radial and angular distribution of primary and scattered radiation to find the most significant sources of variation and dependency on field size of the primary beam parameters. The accurate knowledge of the influence of field size on spectral and angular distribution, the contaminant particles and the relative strength of different sources for collimator scatter is determinant for building new algorithms for treatment planning or to improve the available ones.
Histograms scored at PS
Figures 3a and 3b present energy spectra of photons and electrons scored at the PS on top of the collimation system using the MCNPX 2·6 code. The influence of the primary beam parameters such as spectral distribution and mean energy were analysed using two type of electron beams – monoenergetic and Gaussian in shape with a nominal FWHM of 1·0 MeV. It is seen that the majority of particles are primary photons, for which spectral distributions are strongly dependent on the initial beam parameters; meanwhile, for scattering electrons, the distribution is weakly dependent. The counts per unit energy and per incident electron history at the PS for photons are 2 to 3 magnitudes higher than those for contaminant charged particles. From values of water-to-air stopping-power ratios as a function of depth for realistic photon beamsReference Berger and Hubbell25, we can foresee that primary electron Gaussian beams reproduce more likely the expected dose distributions.

Figure 3 Energy spectra of primary photons (a) and electrons (b) at the PS of a 6 MV beam from an Elekta Precise SL-25 accelerator (SSD=30 cm) using the MCNPX 2·6 code. Abbreviations: PS, phase space; SSD, source and the phantom surface.
The angular distributions were recorded and are displayed in Figures 4a and 4b. Incident photons show a similar distribution like a point source, whereas for the contaminant electrons a wider angular spread is obtained. This angular spread appears from the fact that a lot of electrons are created or scattered in the air gap between the accelerator head and the PS surface, as well as in the different materials in the path of primary radiation through radiation head. The major sources of scattered electrons result from the flattering filter and the backscatter plate. Comparing the results from this study with similar dataReference Ding9, Reference Mesbahi26, Reference van der Zee and Welleweerd27 reveal small differences for the relative contribution of the beam stopper, primary collimator and flattening filter. If we consider the difference in geometry and energy, the discrepancies are not totally unexpected, but a general consent is obtained, most of the scattered radiation is independent of the primary beam energy and is mainly generated in the top part of the linac head.

Figure 4 Zenithal angular distribution of primary photons (a) and electrons (b) at the PS of a 6 MV beam from an Elekta Precise SL-25 accelerator (SSD=30 cm) using the MCNPX 2·6 code. Abbreviations: PS, phase space; SSD, source and the phantom surface.
Finally, fluency profiles of primary photons and electrons were also studied to see the influence of the scattering materials in the linac head target section. It can be shown in Figures 5a and 5b the effect of the X-ray target, the primary collimator and the flattening filter mostly for the tested primary beams in the radial distribution of radiation above the jaws.

Figure 5 Radial distribution of primary photons (a) and electrons (b) at the phase space of a 6 MV beam from an Elekta Precise SL-25 accelerator (SSD=30 cm) using the MCNPX 2·6 code. Abbreviation: SSD, source and the phantom surface.
Histograms scored at the phantom surface
To account for the influence of the secondary collimation system (MLC, backup jaws) in the radiation field conformation, similar histograms were recorded at the water phantom surface for square fields of 5×5, 10×10 and 20×20 cm2. The PSD file for the target section containing approximately ten million particles was used as input-equivalent source and regenerated into new PS files at the phantom surface at SSD=100 cm for each square field. The configuration of both codes, MCNPX and BEAM, during these simulations allowed tracking of each particle through the geometry, finding out where each particle had interactions.
The energy spectra of photons and electrons, as well as the radial and zenithal angular distributions, obtained with the MCNPX 2·6 code are displayed in Figures 6–8 for a standard calibration field of 10×10 cm2. Re-scaling factors were used to enhance the visual appearance of the graphics when primary and secondary particles are shown simultaneously.

Figure 6 Energy distribution of primary photons and electrons at the phantom surface of a 6 MV beam from an Elekta Precise SL-25 accelerator (SSD=100 cm) using the MCNPX 2·6 code. Abbreviation: SSD, source and the phantom surface.

Figure 7 Zenithal angular distribution of primary photons and contaminant electrons at the phantom surface of a 6 MV beam from an Elekta Precise SL-25 accelerator (SSD=100 cm) using the MCNPX 2·6 code. Abbreviations: FWHM, full-width at half-maximum; SSD, source and the phantom surface.

Figure 8 Radial distribution of primary photons and electrons at the phantom surface of a 6 MV beam from an Elekta Precise SL-25 accelerator (SSD=100 cm) using the MCNPX 2·6 code. Abbreviations: FWHM, full-width at half-maximum; SSD, source and the phantom surface.
Using the results from the spectral and angular distributions of both photons and electrons crossing the water phantom surface for different field sizes, the averaged values for energy and scatter angle on the beam axis are summarised in Table 1.
Table 1 Average energy and scatter angle for primary and scattered radiation for a 6 MV Elekta Precise SL-25 photon beam determined on the beam axis calculated with the MCNPX 2·6 code
The mean energy of the spectra can be easily estimated as:
 $$E_{{{\rm mean}}} ={{\mathop{\sum}\nolimits_{i\;=\;1}^n {E_{i} \phi } (E_{i} )} \over {\mathop{\sum}\nolimits_{i\;=\;1}^n \phi (E_{i} )}}$$
whereas for the scatter angle the histogram zenithal distributions have been fitted to a Gaussian function, and the mean value with its corresponding standard deviation are reported in Table 1.
It is clearly noticeable that contributions of scattered radiation from the secondary collimation system produce a decrease in the average energy and an increase in the averaged scatter angle with an increase in field size. Larger deviations between different field sizes in the spectral distributions were found in the lower and higher energies, but in average, very small variations were obtained with the field size, supporting the criteria discussed earlier that the main change of the radiation energy spectra is produced in the top part of the linac head.
In contrast, the average scatter angle of the primary radiation is strongly dependent on the field size, but for the electron scattered radiation this effect is totally negligible.
Analysis of the radial distribution profiles for the 10×10 cm2 field allowed us to conclude that the photon’s fluency remains relatively constant until there is a sharp decrease at the field edge; however, for contaminant electrons, there is no sharp decrease outside the field, and a smoother distribution is obtained. Calculations of the total amount of contaminant electrons revealed that they were only about 0·06% for the 5×5 cm2 and 0·18% for the 20×20 cm2 fields.
The effect on the field size of both distributions for photon and electrons were also studied, and are plotted in Figures 9a and 9b. For small and medium field sizes, the photon’s fluency remained relatively constant inside the beam area, but for larger fields (such as 20×20 cm2 or wider) the photon’s fluency profile increased up to 20% away from the central axis, and the decreasing slope was considerably lower than for smaller fields.

Figure 9 Radial distribution of primary photons (a) and electrons (b) at the phantom surface of a 6 MV beam from an Elekta Precise SL-25 accelerator (SSD=100 cm) using the MCNPX 2·6 code for three different square fields. Abbreviations: FWHM, full-width at half-maximum; SSD, source and the phantom surface.
From the previous results, we can obtain a histogram-based source model based on the PSD. This procedure had been also studied by,Reference Ding9, Reference Mesbahi26, Reference van der Zee and Welleweerd27 due to the fact that the sampling is faster than reading particles from a PSD file. A drawback of the method is the long computing time required to get dose results of reasonable statistical accuracy. However, recent advances in MC dose-calculation algorithms coupled with increasing computer processing speed can make MC dose-calculation speed acceptable for radiotherapy clinics.
The obtained histograms were recorded and implemented as equivalent sources for different types of treatments using the 6 MV photon mode. For dose calculations, the primary photons can be easily modelled by a planar source, following the histograms for energy, radial and angular distributions, and times for calculations and storage requirements can be reduced by a factor of >100 times. The information about beam characteristics in the phantom surface is very useful for the development of accurate treatment planning systems as well.
MC-calculated dose distributions and measurements
The starting incident electron energy and radial spread supplied by the manufacturer were both adjusted to obtain the best match between MC-calculated and measured dose distributions using the following data: depth dose curves on the central axis and cross profiles at three different depths (d max ~1·5, 5 and 10 cm). The best MC model was obtained with a primary electron beam taken as a Gaussian distribution centred at 5·8 MeV with a FWHM of 1·0 MeV and a radial spot of 1·0 mm FWHM. The results for the dose distributions of a standard field of 10×10 cm2 are plotted in Figures 10 and 11. All measured depth dose curves were derived from the measured depth ionisation curves and were normalised at the depth of maximum dose at the beam central axis. The MC-calculated depth dose curves were also scaled in the same manner using both codes – MCNPX 2·6 and EGS-BEAM. The agreements between MC-calculated and measured dose distributions were excellent for both codes. For PDD curves, bigger discrepancies were obtained in the build-up region, but they were not significant enough to affect the adjusted MC model.
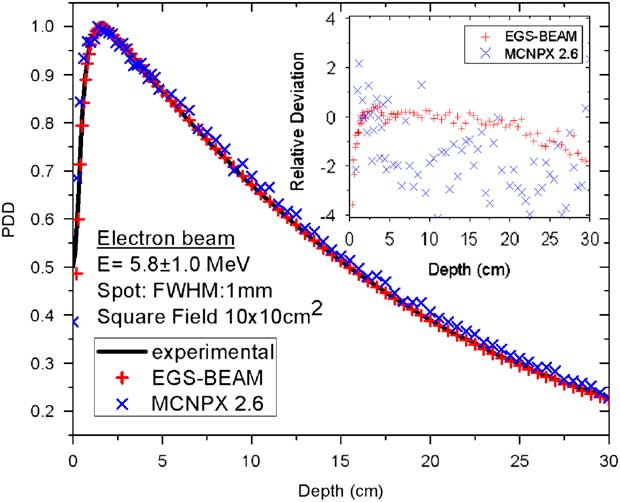
Figure 10 Comparison between measured and calculated depth dose distribution at the central axis of a water phantom caused by a 6 MV beam from an Elekta Precise SL-25 accelerator (SSD=100 cm) using the MCNPX 2·6 and the EGS-BEAM codes. Abbreviations: FWHM, full-width at half-maximum; PDD, per cent dose depth; SSD, source and the phantom surface.

Figure 11 Comparison between measured and calculated cross-beam profiles dose distributions at two different depths (1·5 and 5·0 cm) in a water phantom caused by a 6 MV beam from an Elekta Precise SL-25 accelerator (SSD=100 cm) using the MCNPX 2·6 code. Abbreviations: FWHM, full-width at half-maximum; SSD, source and the phantom surface.
The cross profiles for the 10×10 cm2 field demonstrated that it is possible, using our proposed MC model, to simulate the dose profiles from the Elekta SL-25 medical linac. Although the calculations were made on a coarse grid (voxel size 0·5×0·5×0·5 cm3), the description of the penumbra matches the measured data almost completely. The same is true for the dose inside and outside the field for all the studied depths.
To study the influence of the field size on dose distributions, is worth mentioning that dose profiles of large fields are very sensitive to the size of the radial spread of incident electrons hitting the target, whereas the central axis depth dose curves only depend on the incident electron energy. Although the tuning procedure to find the best choice for the incident electron beam characteristic is extensively time consuming, it is only required to be carried out once, and the PSD stored can be used as a reference input source for any similar irradiation conditions. Figures 12 and 13 display the influence of the field size on both depth dose and cross-beam profiles dose distributions, respectively. Re-scaling factors were used to enhance the visual appearance of the graphics when all square fields are shown simultaneously.

Figure 12 Comparison between measured and calculated depth dose distribution at the central axis of a water phantom caused by a 6 MV beam from an Elekta Precise SL-25 accelerator (SSD=100 cm) for different field sizes using the MCNPX 2·6 code. Abbreviations: FWHM, full-width at half-maximum; SSD, source and the phantom surface.

Figure 13 Comparison between measured and calculated cross-beam profiles dose distributions at 1·5 cm depth in a water phantom caused by a 6 MV beam from an Elekta Precise SL-25 accelerator (SSD=100 cm) for different field sizes using the MCNPX 2·6 code. Abbreviation: SSD, source and the phantom surface.
Finally, the dose calculations in two heterogeneous phantoms were estimated. The central axis PDDs for a field size of 10×10 cm2 of 6 MV photon beams are shown in Figure 14 for lung and bone-equivalent material heterogeneities. The boundary vertical line presented in the graphs marks the extruded heterogeneity discontinuity position. An abrupt decrease can be seen in the absorbed dose for photons entering the low-density region of the lung material. This result is not totally unexpected, taking into account that the photon scattering inside the lung is almost negligible; therefore, the energy deposited in the lung is lower than that in water. Inside the water/bone/water phantom the result differs from the water/lung/water interface, except that the monotonically decreasing photon fluency causes the same overall decreasing tendency of central axis PDDs. It is recommended to compare these results with measurements using equivalent materials and with the available TPS at the hospital, especially when we consider that most of the commercial TPS have a substantial problem modelling the correct dose estimation around the low-density region, highlighting the limitations of these deterministic algorithms.

Figure 14 Depth dose curves in a water/bone/water phantom (left) and a water/bone/water phantom (right) calculated for a 6 MV photon beam. The field size is 10×10 cm2 at 100 SSD. Abbreviations: FWHM, full-width at half-maximum; PDD, per cent dose depth; SSD, source and the phantom surface.
Conclusions
An equivalent MC source model can accurately reproduce the primary and secondary radiation transport for a 6 MV Elekta SL-25 medical linac using a PS as the equivalent source for different irradiation square fields. The agreement between the calculated and measured dose distributions was within 2% for all the studied field sizes and shows the strength and stability of the proposed model. The independence of the field size of our source model suggests that a ‘standard’ set of beam model parameters determined based on the MC simulation of a reference accelerator can be generalised to commission other types of linacs for MC treatment planning. The fitting of the primary electron beam mean energy and FWHM, as well as its radial spot half-width, are sufficient to fully recover the dose distributions for various field sizes and SSDs.
From our considerations, the main disadvantages of the method are the data storage requirements and the achievable simulation times, both of which are above the computing resources of an average radiotherapy department. Beam reconstruction methods as direct input to dose-calculation codes reduce 10,000 times or more disk space requirements and simulation times by a factor of 100 or more. The histograms scored at the PS above the collimation system, as well as the ones in the phantom surface, are been used to define an equivalent source reconstruction method from our accelerator.
Acknowledgements
The authors acknowledge Elekta Oncology Systems for providing detailed information on the Elekta SL-25 linear accelerators. They also thank the members of the Radiotherapy Department of the INOR at Havana for their support and time with the measurements, as well as for their valuable discussions and comments on the work.
Financial support
This research received no specific grant from any funding agency, commercial or not-for-profit sector.
Conflicts of Interest
None.


