Introduction
While most mosquito control programs use an integrated approach, application of adulticides can help to reduce high nuisance levels and minimize the risk of vector-borne diseases to humans and animals. Realizing the potential impact of pesticides on pollinators, mosquito control personnel make a concerted effort to minimize adulticide treatments on managed honey bees (Apis mellifera L.) within their spray zones.
Commercially kept honey bee colonies contain an average of six pesticides (Mullin et al., Reference Mullin, Frazier, Frazier, Ashcraft, Simonds, vanEngelsdorp and Pettis2010), and synergistic interactions between these pesticides have been demonstrated (Johnson et al., Reference Johnson, Pollock and Berenbaum2009; Johnson et al., Reference Johnson, Dahlgren, Siegfried and Ellis2013; Rinkevich et al., Reference Rinkevich, Margotta, Pittman, Danka, Tarver, Ottea and Healy2015). Of the 121 pesticides found in honey bee colonies, several insecticides (i.e. malathion, permethrin, prallethrin, and phenothrin) are commonly used as mosquito adulticides (Mullin et al., Reference Mullin, Frazier, Frazier, Ashcraft, Simonds, vanEngelsdorp and Pettis2010; Long & Krupke, Reference Long and Krupke2016). The effects of some of these mosquito adulticides on honey bees have been evaluated. For example, several mosquito adulticides, including malathion and chlorpyrifos, were highly toxic when caged honey bees were directly exposed to non-thermal aerosol applications (Atkins et al., Reference Atkins, Kellum and Atkins1981). One hour after malathion application, residues on foraged pollen was sufficient to kill bees (Pankiw & Jay, Reference Pankiw and Jay1992). In addition, acute bee kills have been reported to occur following mosquito adulticiding operations with naled or malathion (Dixon & Fingler, Reference Dixon and Fingler1984; Hester et al., Reference Hester, Shaffer, Tietze, Zhong and Griggs2001; Zhong et al., Reference Zhong, Latham, Hester, Frommer and Brock2003).
Although many studies have focused on the toxicity of mosquito control adulticides to honey bees, evaluating honey bee exposure remains one of the crucial areas of study. A typical swath with a truck-based application of ultra-low volume (ULV) of mosquito adulticides is 91.4 m, but many factors (e.g. wind, droplet size, temperature) can affect how far the product can travel and how much can be deposited (Schleier et al., Reference Schleier, Peterson, Irvine, Marshall, Weaver and Preftakes2012). For example, malathion tends to be lethal to honey bees at short distances (i.e. <30 m) from the application site, but with a rapid fall-off in mortality at increasing distance (Colburn & Langsford, Reference Colburn and Langsford1970; Caron, Reference Caron1979). Many mosquito control programs create buffer zones around bee hives, and applicators turn off their sprayers near hive locations. However, there is little information to guide programs on the size of the buffer necessary to protect the bees.
The goals of this study were to assess the impacts of mosquito control adulticiding practices on honey bee health and to improve current BMPs (best management practices) for mosquito control programs and apiculture. Our hypotheses were that honey bee mortality decreases as the distance from the treatment source increases, and insecticide deposition, droplet size and density correlates with bee mortality. Given that honey bees are considered to be highly susceptible to many insecticides (Anderson & Atkins, Reference Anderson and Atkins1968; Iwasa et al., Reference Iwasa, Motoyama, Ambrose and Roe2004; Johnson et al., Reference Johnson, Wen, Schuler and Berenbaum2006), with commonly kept Italian bees having the highest sensitivity (Danka et al., Reference Danka, Rinderer, Hellmich and Collins1986; Laurino et al., Reference Laurino, Manino, Patetta and Parparato2013; Rinkevich et al., Reference Rinkevich, Margotta, Pittman, Danka, Tarver, Ottea and Healy2015), it is important to evaluate the effects of these products utilizing real-world application rates and techniques in the field.
Materials and methods
Honey bees
Colonies of Italian honey bees (Wooten's Golden Queens, San Pedro, California, USA) were reared at the United States Department of Agriculture (USDA) Honey Bee Breeding, Genetics, and Physiology Laboratory in Baton Rouge, Louisiana, USA, without the use of miticides, antibiotics, or supplemental feed.
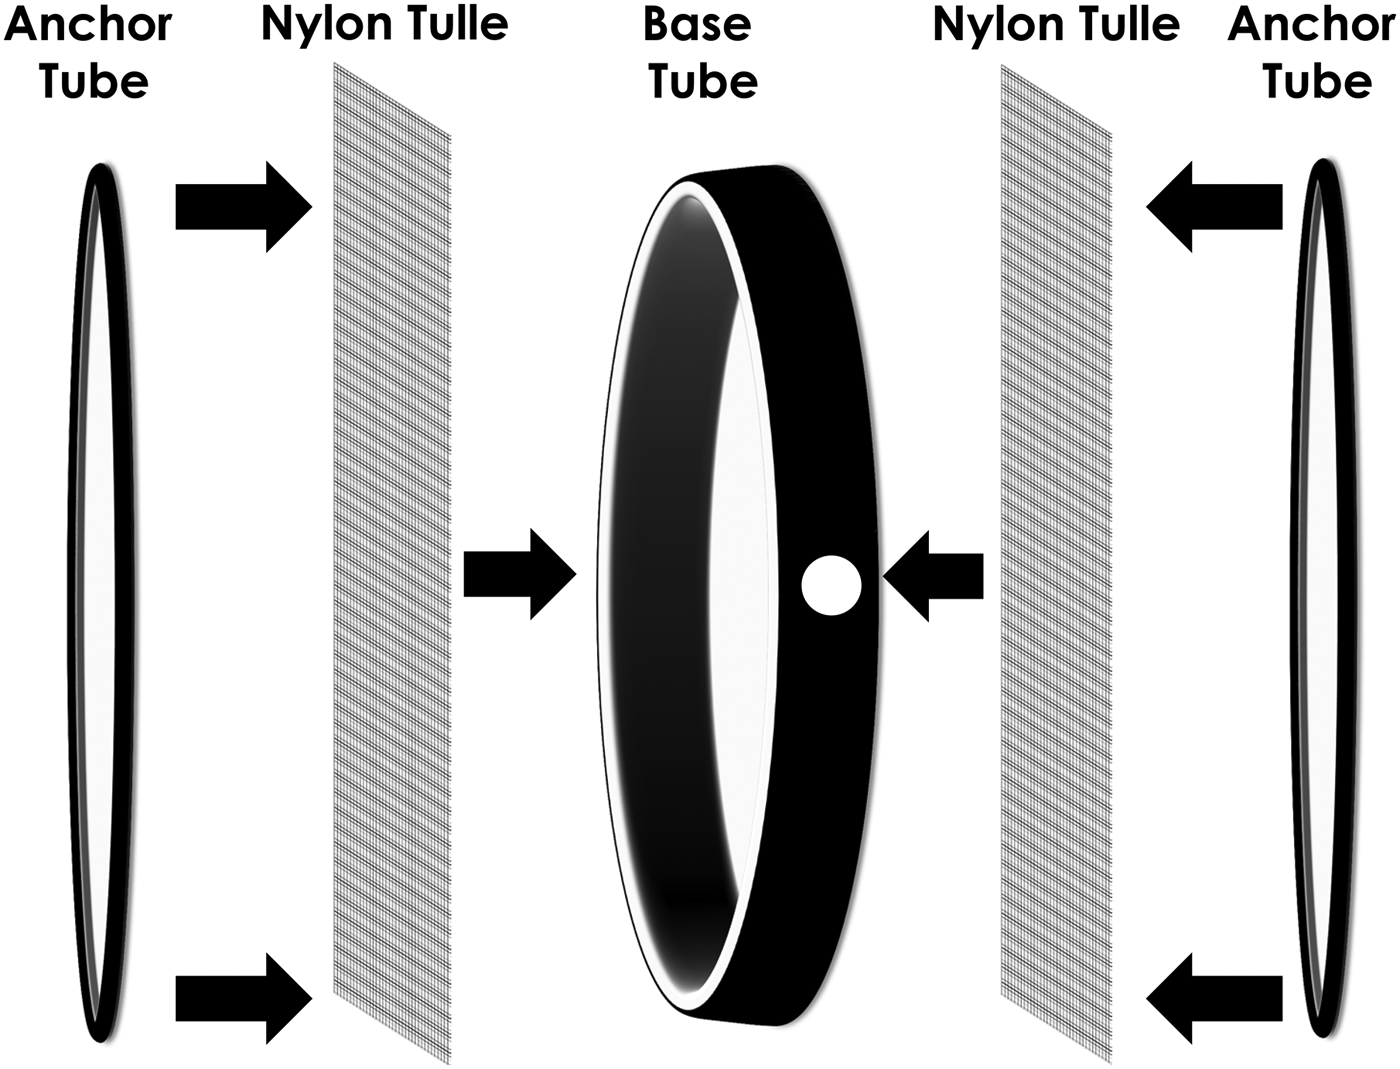
Forager bees were used in this study as they are the most likely members of a colony to encounter insecticides used in mosquito control applications. The colony entrance was blocked to cause an aggregation of returning foragers that could be scooped directly into a plastic container (38.1 cm H × 38.1 cm W × 60.0 cm L). A plastic funnel with a 1.9 cm opening was mounted in the corner at a 45o angle. The inside of the funnel was coated with a fine layer of petroleum jelly to easily add bees into a ring cage (fig. 1). The funnel of the bee box was placed through the hole of the ring cage. Approximately 30 bees were shaken in to the ring cage and the hole was plugged with 2 cotton balls soaked in 50% (w/v) sucrose solution. Caged bees were collected in mid-afternoon and held in a shaded location at ambient temperatures for 2–5 h before being used in spray trials in the evening.
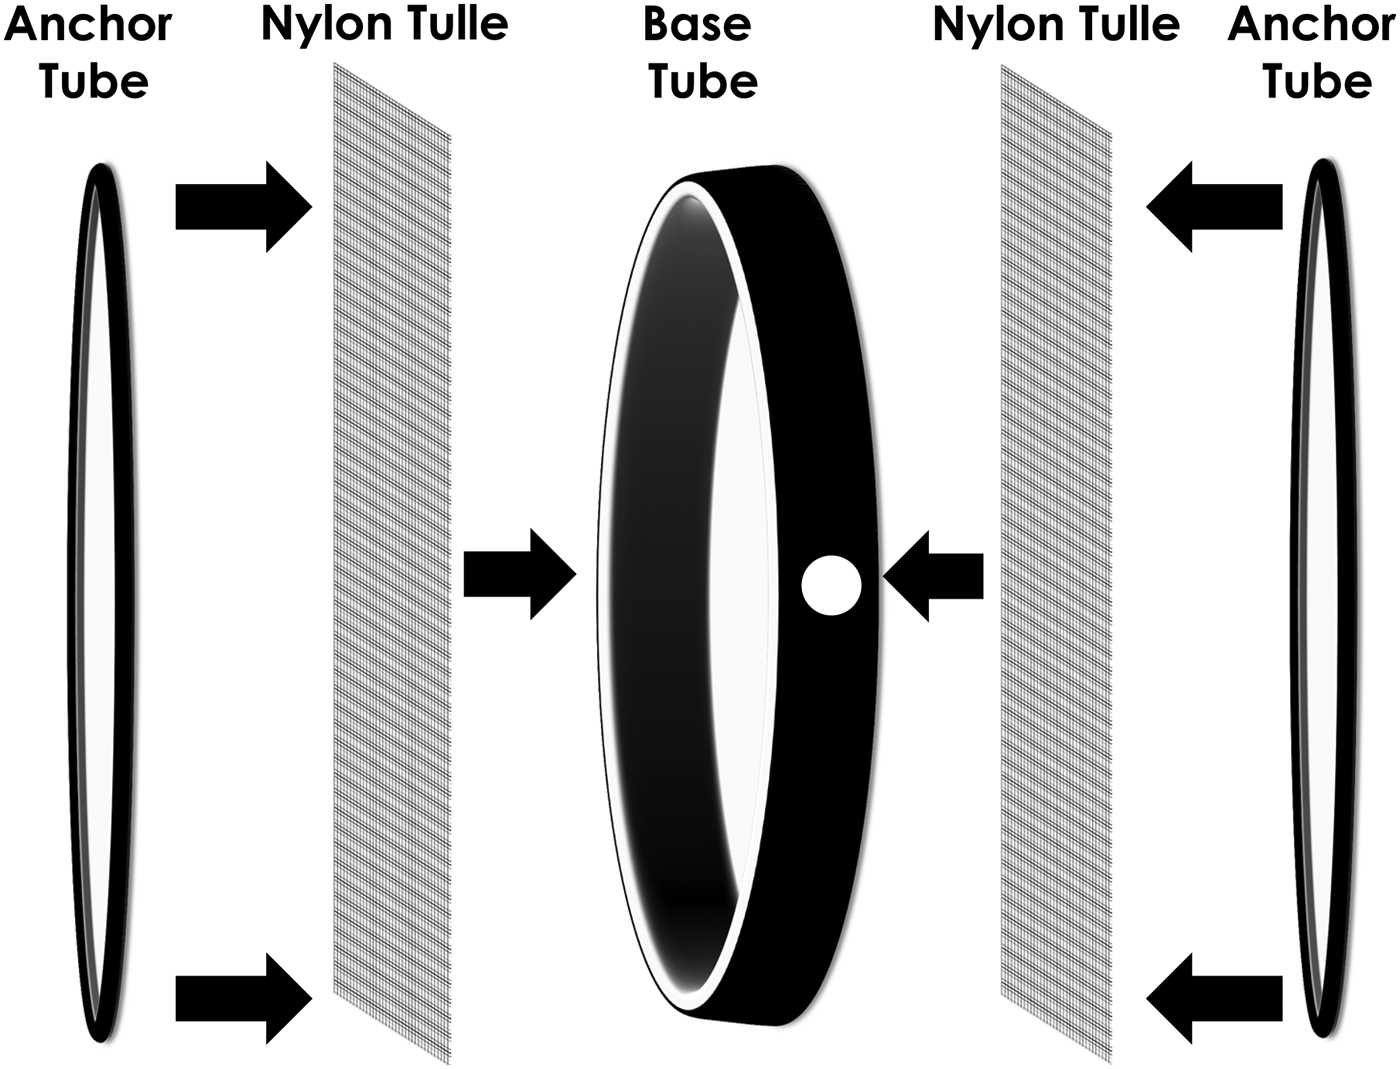
Fig. 1. Diagram of ring cages used to hold honey bees and mosquitoes. A 15.2 cm diameter mosquito ring cage (6″ Mosquito Ring Set, Pacific Paper Tube, Oakland, CA) was assembled with one base tube (14.9 cm inner diameter × 4.4 cm W × 0.2 cm thick with white liner inside) covered on both sides with nylon tulle (20.3 cm2 of 0.1 cm mesh), then covered with two anchor tubes (15.2 cm inner diameter × 1.3 cm W × 0.2 cm thick). The base tube had a 2.5 cm hole punched in the side.
Mosquitoes
Culex quinquefasciatus Say were reared in the insectary of the Mosquito and Fly Research Unit at the USDA-Agricultural Research Service (USDA-ARS) Center for Medical, Agricultural, and Veterinary Entomology (CMAVE) in Gainesville, Florida USA. This strain of C. quinquefasciatus has been established in the insectary since 1995 from a Gainesville, Florida, USA, strain and was maintained using mass-rearing protocols (Gerberg et al., Reference Gerberg, Barnard and Ward1994). The insecticide sensitivity of this strain was validated using CDC (Centers for Disease Control and Prevention) bottle bioassays (Brogdon & McAllister, Reference Brogdon and McAllister1998) at East Baton Rouge Parish Mosquito Abatement and Rodent Control (EBRPMARC) (Supplementary table 1).
The 1–2-day-old adult mosquitoes were shipped overnight to EBRPMARC, in Baton Rouge, Louisiana, USA. Ring cages (as above) were filled by aspirating approximately 20, 2–3-day-old female mosquitoes, and the hole was plugged with two cotton balls soaked in 10% (w/v) sucrose solution.
Field site
A 200 m × 100 m test plot was located at 30°30′56.4″N, 91°09′12.6″W, approximately 3.2 km from the EBRPMARC and 1.0 km from the Baton Rouge Metropolitan Airport. The terrain was flat and covered by <0.25-m-high herbaceous vegetation. Three transects 91.4 m in length were oriented in the field so that wind traveled parallel to the transects, which were spaced 9.1 m apart. Each of the three transects had six stations at distances of 15.2, 30.5, 45.7, 61.0, 76.2, and 91.4 m from a perpendicular spray line. Each of the 18 stations contained a tower to hold insect-filled cages and a tower to hold rotating impingers. Cage towers were built of 1.9 cm PVC pipe with a 1.0 m cross bar to hold two cages at 1.5 m above the ground. Ring cages were attached to cage towers by spring-loaded hair clips. Cages were oriented perpendicular to the ground with the screened sides facing parallel to the spray line. Each cage tower at each station held one cage of mosquitoes and one cage of honey bees. Droplet collection towers housed rotating impingers (Leading Edge Associates Inc, Fletcher, North Carolina, USA) that held two Teflon-coated slides that were used to measure the number and size of droplets deposited.
Products tested
We evaluated the impacts of Aqua-Pursuit™ (permethrin 20.6%), Duet® (prallethrin 1.0%, sumithrin 5.0%), Fyfanon® (malathion 96.5%), and Scourge® (remethrin 4.1%) with each formulated product applied at the low rate and high rate indicated on the product labels (table 1). All materials were applied according to the manufacturer's label with a truck-mounted ADAPCO Guardian 190 ES ULV sprayer (ADAPCO, Sanford, Florida, USA) powered by a 4-cycle, 19 hp (674.98 cc) Kawasaki FH601D engine that drove a Dresser Roots blower. The vehicle speed was 24 kph and the ULV sprayer flow rate was 295.7 ml min−1. Droplet size at the nozzle was characterized by analyzing >1000 droplets with a KLD Labs Inc. DC-IV ‘hot wire’ system before field application. The droplet diameter parameters (i.e. D v50 and D v90) for all products were <30 and 30< × <50 microns, respectively.
Table 1. Insecticide product formulations and application parameters according to manufacturer's recommendations used in this study.

The formulated products containing the synergist piperonyl butoxide is abbreviated PBO. Labeled application rates were converted from lbs/acre to g/ha.
Non-metallic (thick-walled plastic) containers were used as treatment insecticide reservoirs (Briggs & Stratton Smart-Fill, 2 + Gallon; The Plastic Group, Inc., Willowbrook, Illinois, USA). These 7570 ml (256 oz plus) containers were used for each insecticide at each concentration (low concentration and high concentration) to prevent contamination between insecticide treatments and reduce the time required in the flushing of containers and lines. The changing of reservoir containers and the flushing of spray system lines were conducted off-site where there would be no chance for the drifting of the spray on to the study site as the result of the flushing operation. Low concentration treatments were applied before the high concentration treatments to reduce system flushing time.
When changing insecticide concentrations and insecticide treatments, the insecticide reservoir containers were disconnected from the spray system lines and the system was ‘sprayed out’ to remove residual insecticide within the lines. Before flushing of the spray system lines, the insecticide supply line, in-line filter reservoir was emptied between the different insecticide treatments. The system spray lines were flushed with isopropyl alcohol between the different insecticide treatments. The system was ‘sprayed-out’ after flushing. Spray system lines were not flushed between low and high concentration treatments of the same insecticide. When the new concentration or new insecticide treatment container was connected to the system the sprayer was allowed to spray for approximately 1 min to ensure the spray system was primed with the insecticide at the desired concentration.
All applications for each product and application rate were repeated at least three times between 6 and 8 p.m. with wind speed ranging between 0 and 9.3 km h−1 and temperature ranging between 22.8 and 29.0°C. Ambient weather conditions at 1 and 10 m above the ground were recorded by a portable Kestrel Weather station with a PC interface (Kestrel Meters, Birmingham, Michigan, USA). Duet®, Fyfanon®, and Scourge® trials were conducted during the week of 20 October 2014. Aqua-Pursuit™, Fyfanon®, and Scourge® trials were conducted during the week of 1 June 2015. The number of replicates performed for each species for each product at each application rate is shown on the corresponding figures.
Field procedures
As a control, four cages each of mosquitoes and honey bees along with four pairs of Teflon-coated slides were hung from towers adjacent (i.e. <10 m) to the transects. Control insects and slides were placed for 10 min before each application of insecticides. Honey bee and mosquito cages were collected in separate plastic garbage bags, and slides were collected in disposable slide boxes. Insect cages and slides were collected approximately 15 min after insecticide application. Insects were immediately transported back to EBRPMARC and transferred into clean holding containers within approximately 30 min after application. Clean holding containers consisted of a 475 ml wax paper cup (Inno-Pak, Delaware, OH) with a 2.5 cm hole punched in the wall and the top covered with nylon tulle secured by two rubber bands. Mosquitoes were transferred by mouth aspiration. Honey bees were transferred by funneling the bees from the cages into a clean holding container. The holes in the holding cages were plugged with two cotton balls soaked in 10 and 50% sucrose solution for mosquitoes and honey bees, respectively. The total number of insects in each holding cage was recorded. Mosquitoes were held at 22±3°C and 50±5% RH with seasonal daylight regime at in the research building EBRPMARC, while honey bees were held in an incubator in continuous darkness at 33 ± 1°C and 70 ± 5% RH. Insect mortality was recorded 24 h after treatment. Replicates where control mortality exceeded 10% were excluded from analysis.
Droplet deposition collection and analyses
Each of the 18 sampling stations included a tower holding two rotary impingers (spinners, Leading Edge Associates, Waynesville, North Carolina, USA). New slides were placed in each sampler before each spray pass. One of the spinners held two uncoated 25 mm × 75 mm glass microscope slides set 16 cm apart (outside edge to outside edge), with the slides rotated at a velocity of 5.6 m s−1 to capture airborne spray concentrations moving through the spray grid. The second spinner also held two 25 mm × 75 mm glass slides, but one slide was coated with Teflon tape and used in droplet sizing assessments. The uncoated slide remained throughout the trial to provide a counter balance to the coated slide. Exposed slides were collected individually into labeled, zip-top bags after each spray pass and after allowing sufficient time for the spray to travel through the grid. Zip-top bags containing exposed slides were stored in insulated containers for transport to the processing location.
Each spray mixture used included a fluorescent dye (Tinopal®, BASF, Research Triangle Park, North Carolina, USA) at a concentration of 5 g l−1 to allow for deposition analysis by fluorometry. Exposed slides were washed by adding 20 ml of hexane to each bagged sample and agitated for approximately 15 seconds. The 5 ml of the wash solution was decanted in borosilicate vials, which was processed for fluorescence using a spectrofluorophotometer (Model RF5000U, Shimadzu, Kyoto, Japan) with an excitation wavelength of 372 nm and an emission wavelength of 427 nm. The minimum detection level for Tinopal® is 0.00007 mg cm−2. The measured fluorescence values were converted to volume of spray solution using pre-mixed standard solutions of known dye concentration (Fritz et al., Reference Fritz, Hoffman and Jank2011). The resulting deposition data were in the form of total volume of spray solution per area sampled per slide surface.
Teflon-coated slides were analyzed within an hour after exposure using DropVision™ (Leading Edge Associates, LLC, Waynesville, North Carolina) by processing five rows of 12 images (Faraji et al., Reference Faraji, Unlu, Crepeau, Healy, Crans, Lizarraga, Fonseca and Gaugler2016). Low spray concentrations through the sampling grid resulted in a minimal numbers of droplets collected in individual slides (typically 50 or less), which required searching in a non-randomized pattern across the slides. Measurements were only made when droplets were found, which heavily biased coverage (drops per area) data. However, the droplet size results (i.e. D v50, and D v90) were representative of the spray moving through the sampling grid.
Statistics
Percentage mortality was calculated using Abbott's correction for control mortality (Abbott, Reference Abbott1925) that was arc-sine transformed. Honey bees and mosquito mortality at each distance was compared by ANOVA. Interactions between mortality and different factors (i.e. droplet size, concentration, wind, temperature, distance, and rate) were analyzed by General Linear Model. JMP® v12.1 statistical software (SAS, Cary NC) was used for all analyses.
Results
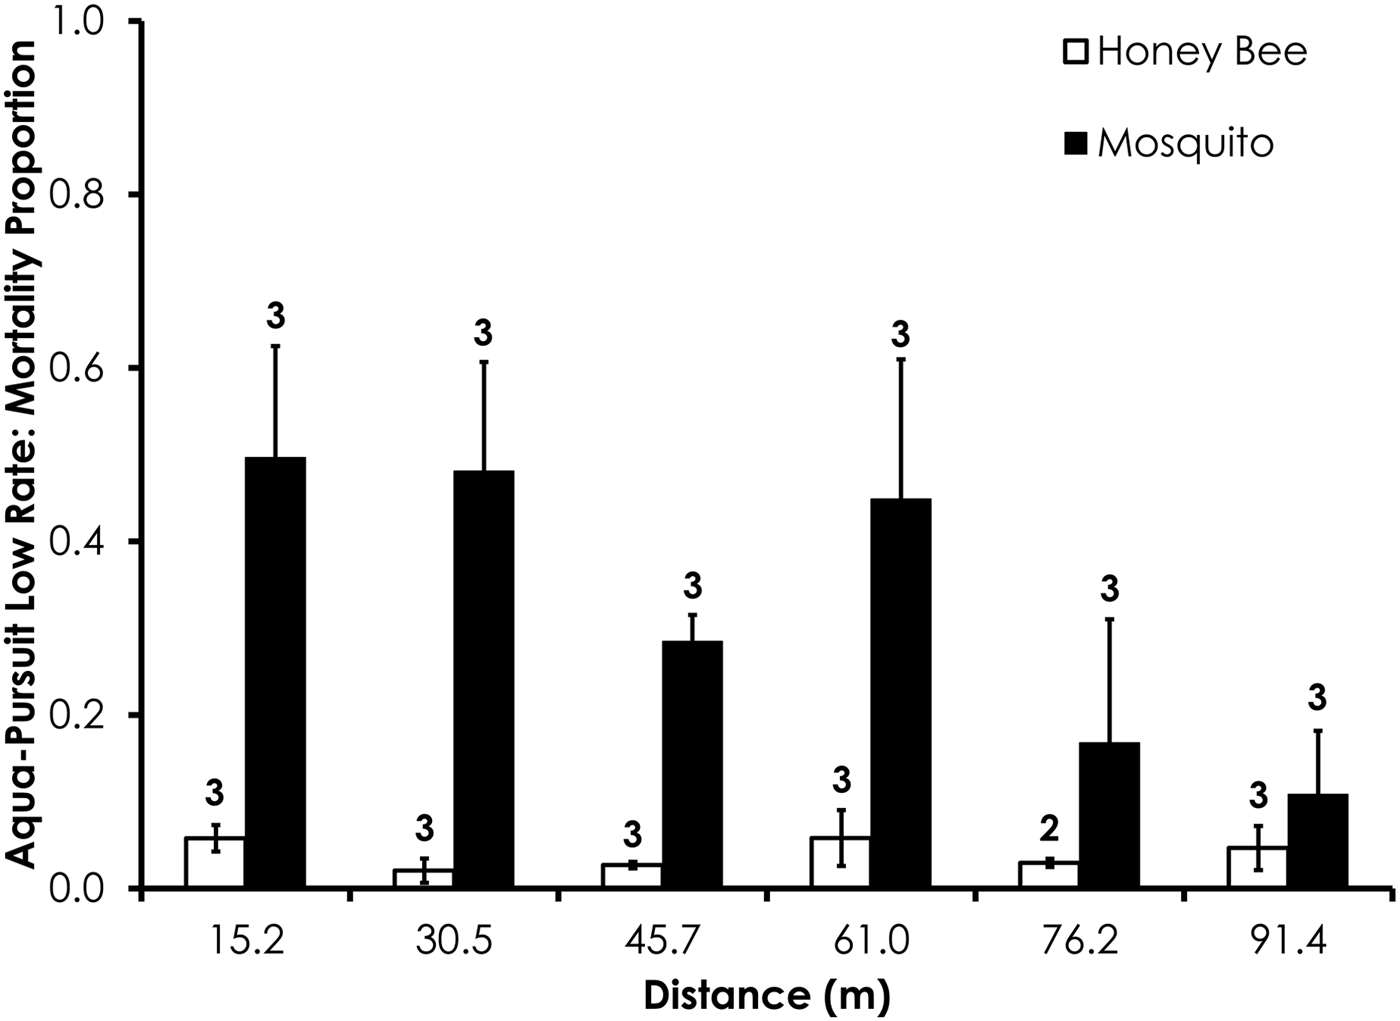
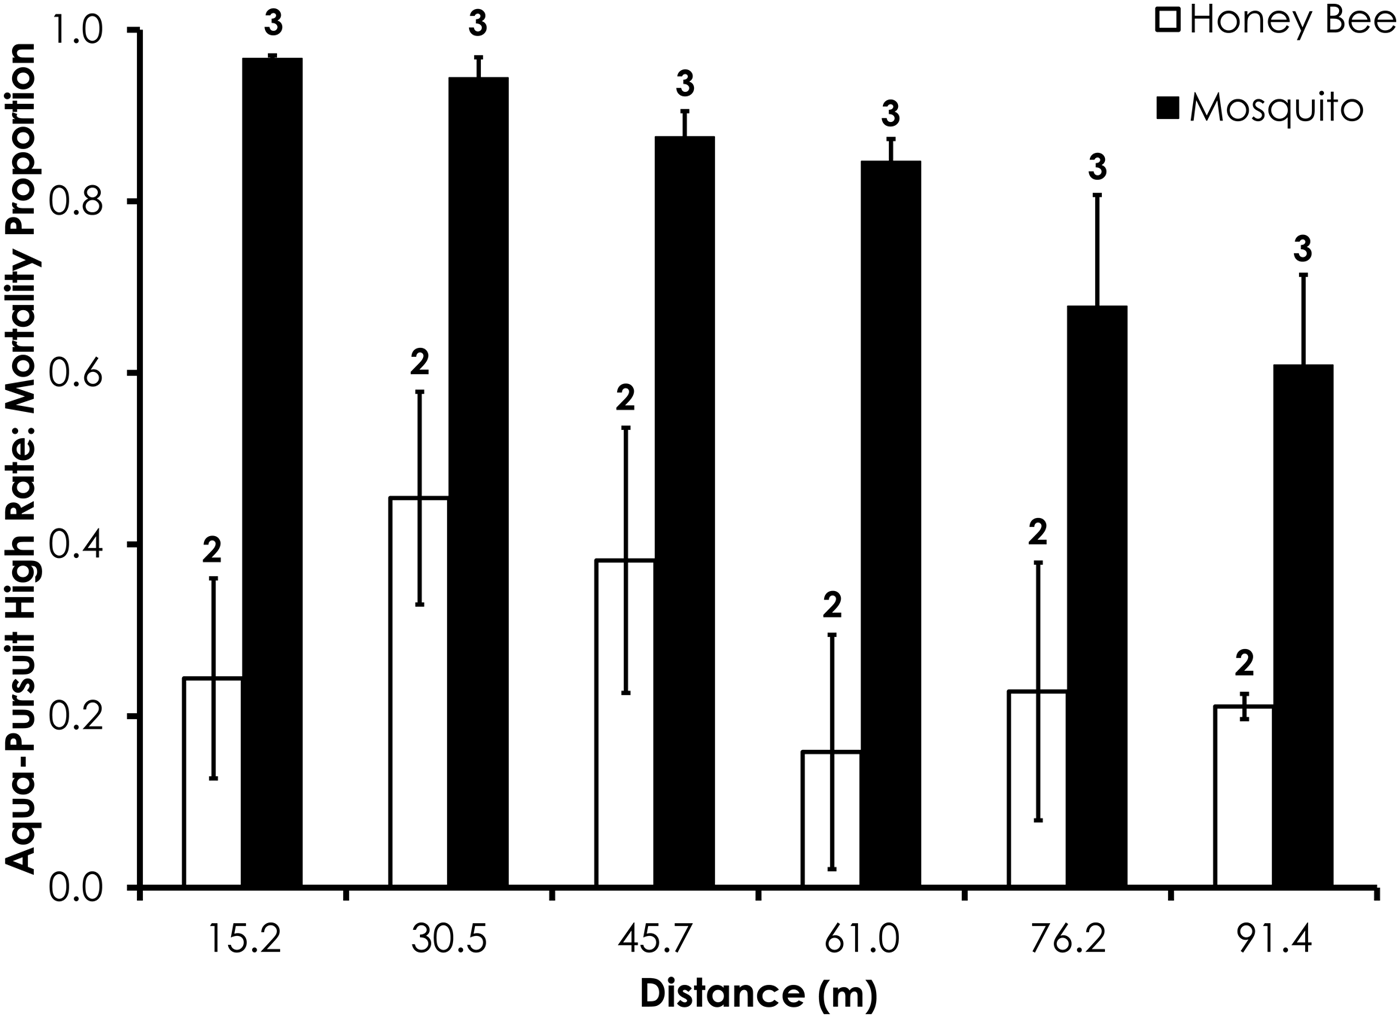
Deposition rate, droplet size (i.e. D v50, D v90), droplet number, wind speed, and temperature parameters for each field trial are shown in table 2. Average control mortality during the Aqua-Pursuit experiments was 0.0 and 3.3%, respectively, for honey bees and mosquitoes at the low rate, while control mortality was 8.3 and 3.3%, respectively, for honey bees and mosquitoes at the high rate. Honey bee mortality was significantly lower than mosquito mortality for Aqua-Pursuit at the low (df = 34, F = 25.6, P < 0.0001; fig. 2) and high rates of application (df = 29, F = 64.9, P < 0.0001; fig. 3) when mortality was pooled across all distances. Although mortality did not significantly differ between honey bees and mosquitoes at >61.0 m from the spray at the low rate, honey bee mortality was significantly lower than mosquito mortality as far as 76.2 m at the high application rate of Aqua-Pursuit (table 3). Honey bee mortality ranged from 17 to 42%, depending on distance, when exposed to high application rate of Aqua-Pursuit.
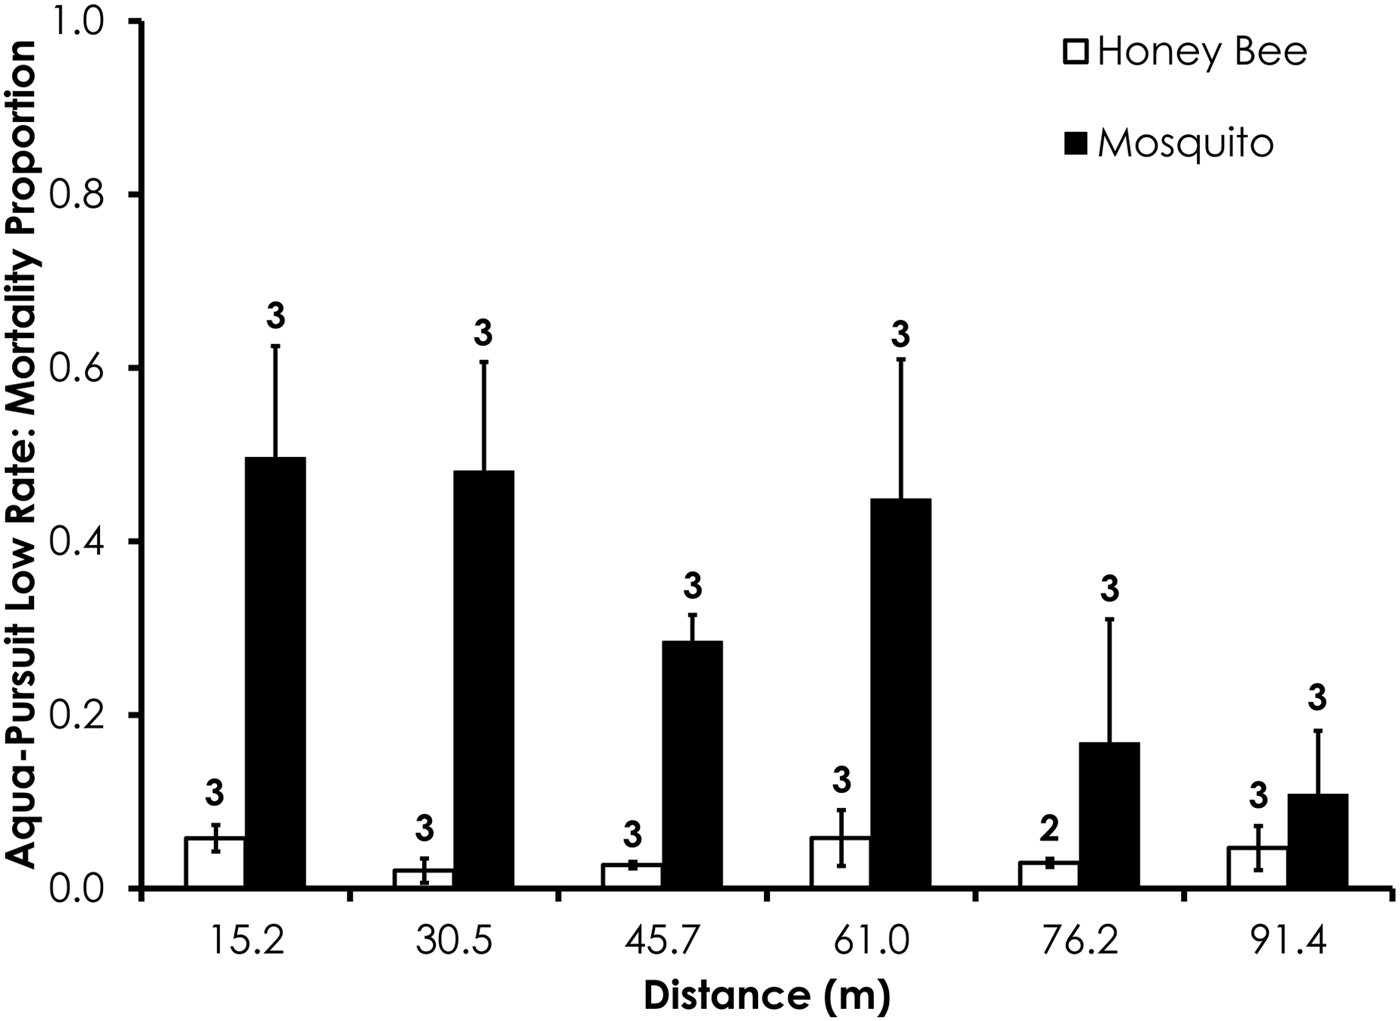
Fig. 2. Honey bee and mosquito mortality at distances from Aqua-Pursuit treatment at the low application rate. Control mortality for honey bees and mosquitoes was 0.0 and 3.3%, respectively. Data are shown as average mortality (±SEM). Numbers over mortality bars represent the number of replicates performed in triplicate.
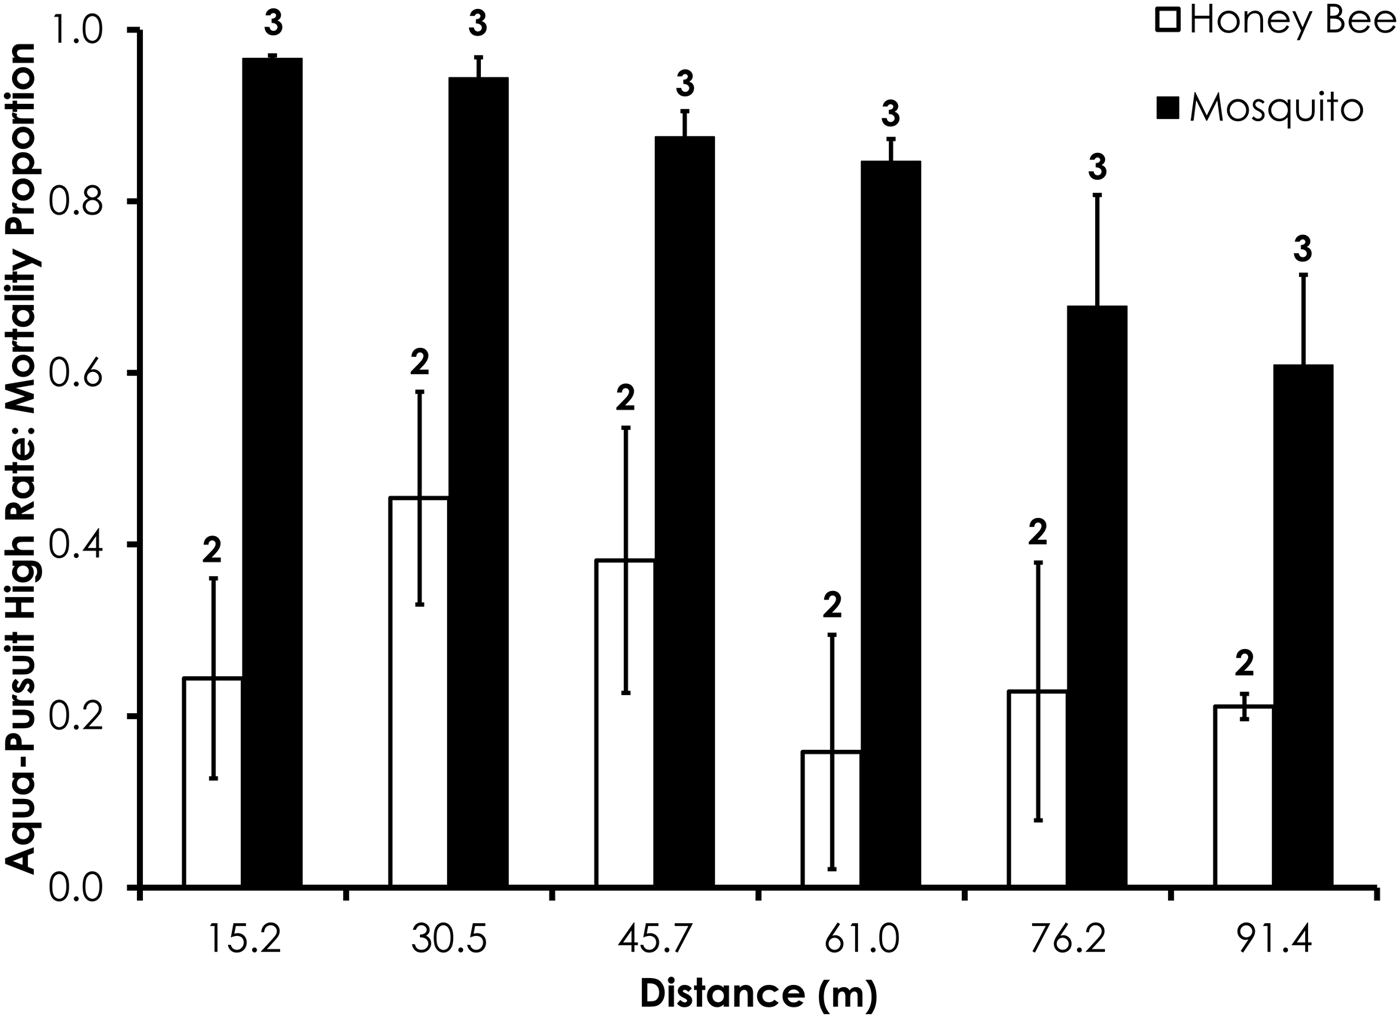
Fig. 3. Honey bee and mosquito mortality at distances from Aqua-Pursuit treatment at the high application rate. Control mortality for honey bees and mosquitoes was 8.3 and 3.3%, respectively. Data are shown as average mortality (±SEM). Numbers over mortality bars represent the number of replicates performed in triplicate.
Table 2. Droplet, deposition, and environmental parameters for each product applied at low and high label rates.

Values shown are the average (95% confidence interval).
Table 3. Mortality differences between honey bee and mosquito for four commonly used mosquito adulticides at increasing distances from application site.

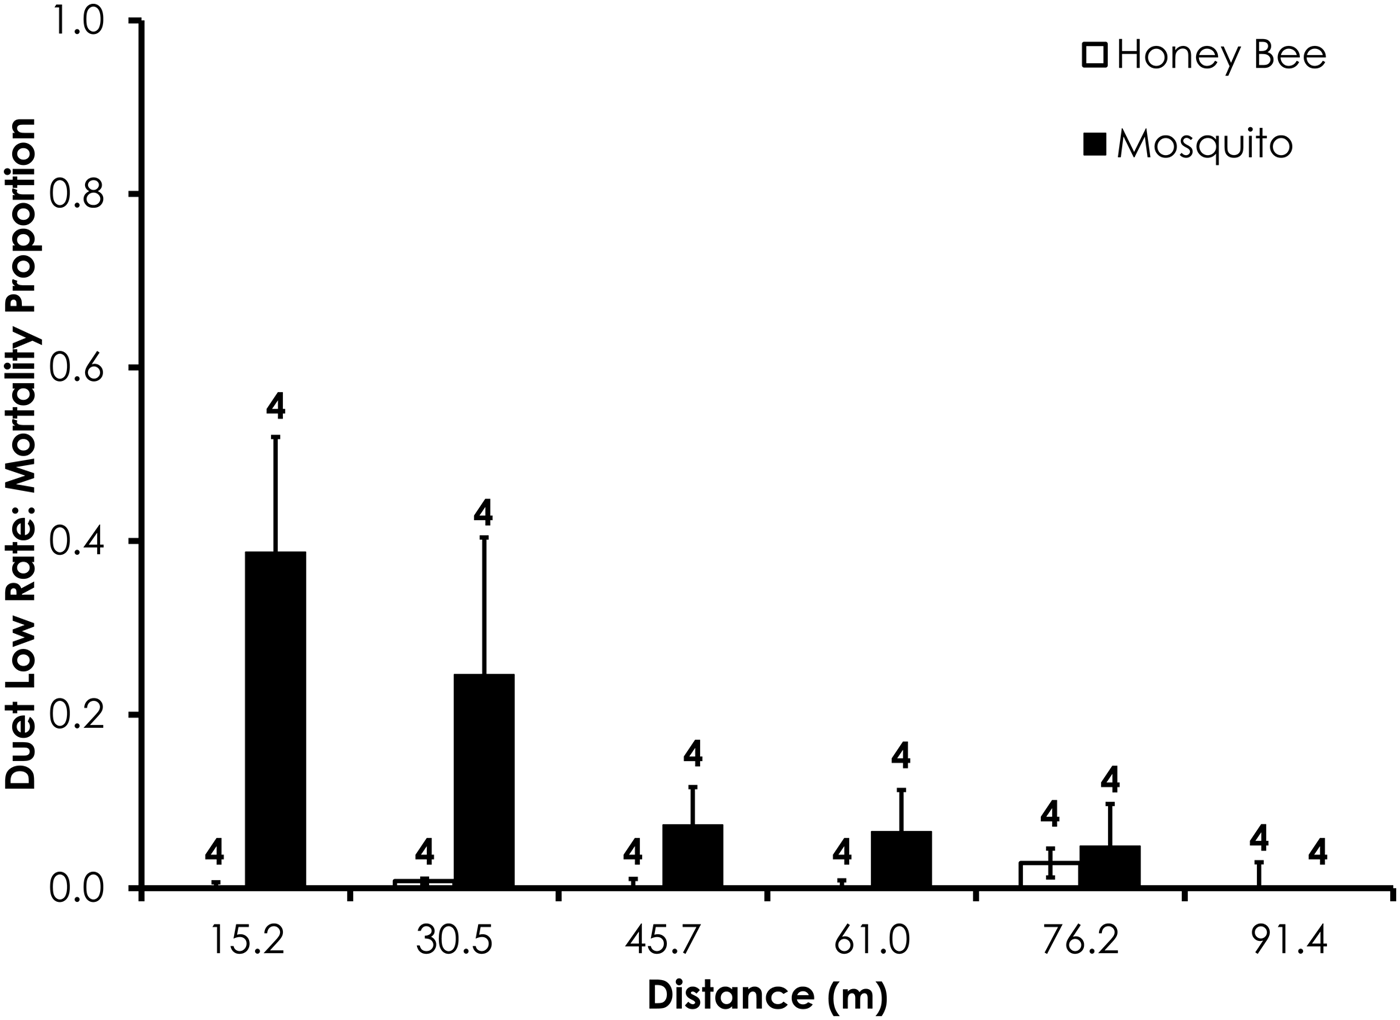
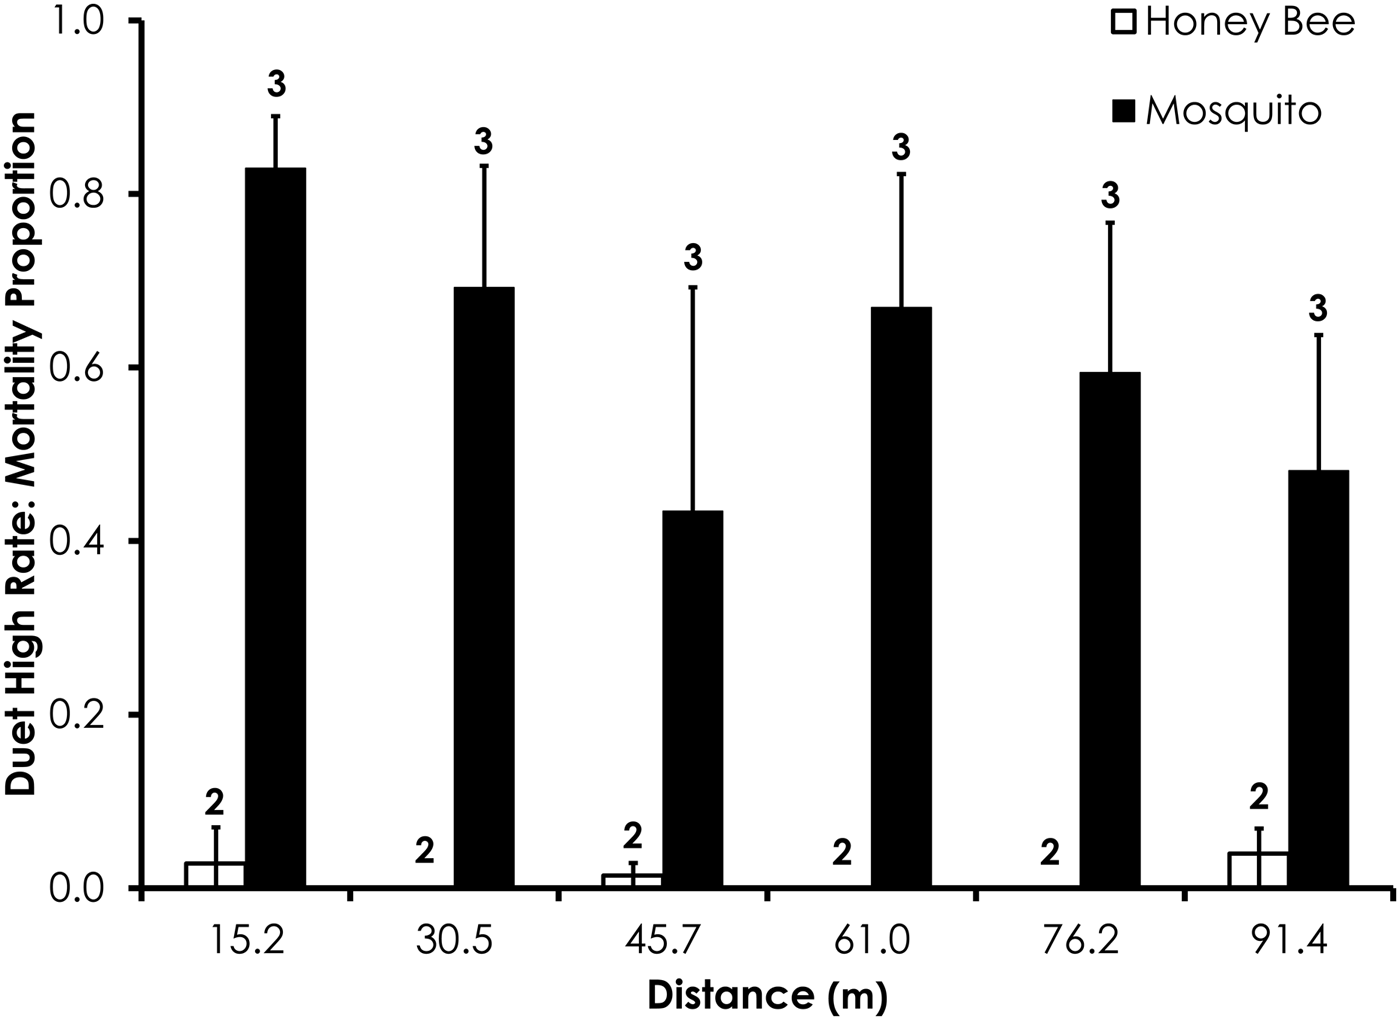
Two replicates were removed from the Duet experiments due to high-control mortality (over 20%). After removal of those replicates, average control mortality during the Duet experiments was 0.0% for mosquitoes and honey bees at the low rate and 1.3 and 2.4% control mortality for honey bees and mosquitoes, respectively, the high Duet application rate. Overall, honey bee mortality was significantly lower than mosquito mortality for Duet for both low (df = 29, F = 20.4, P = 0.0001; fig. 4) and high rates of application (df = 47, F = 9.7, P = 0.0032; fig. 5) when mortality was pooled across all distances. Mortality did not significantly differ between the two species at >15.2 m from the spray at low and high application rates (table 3).
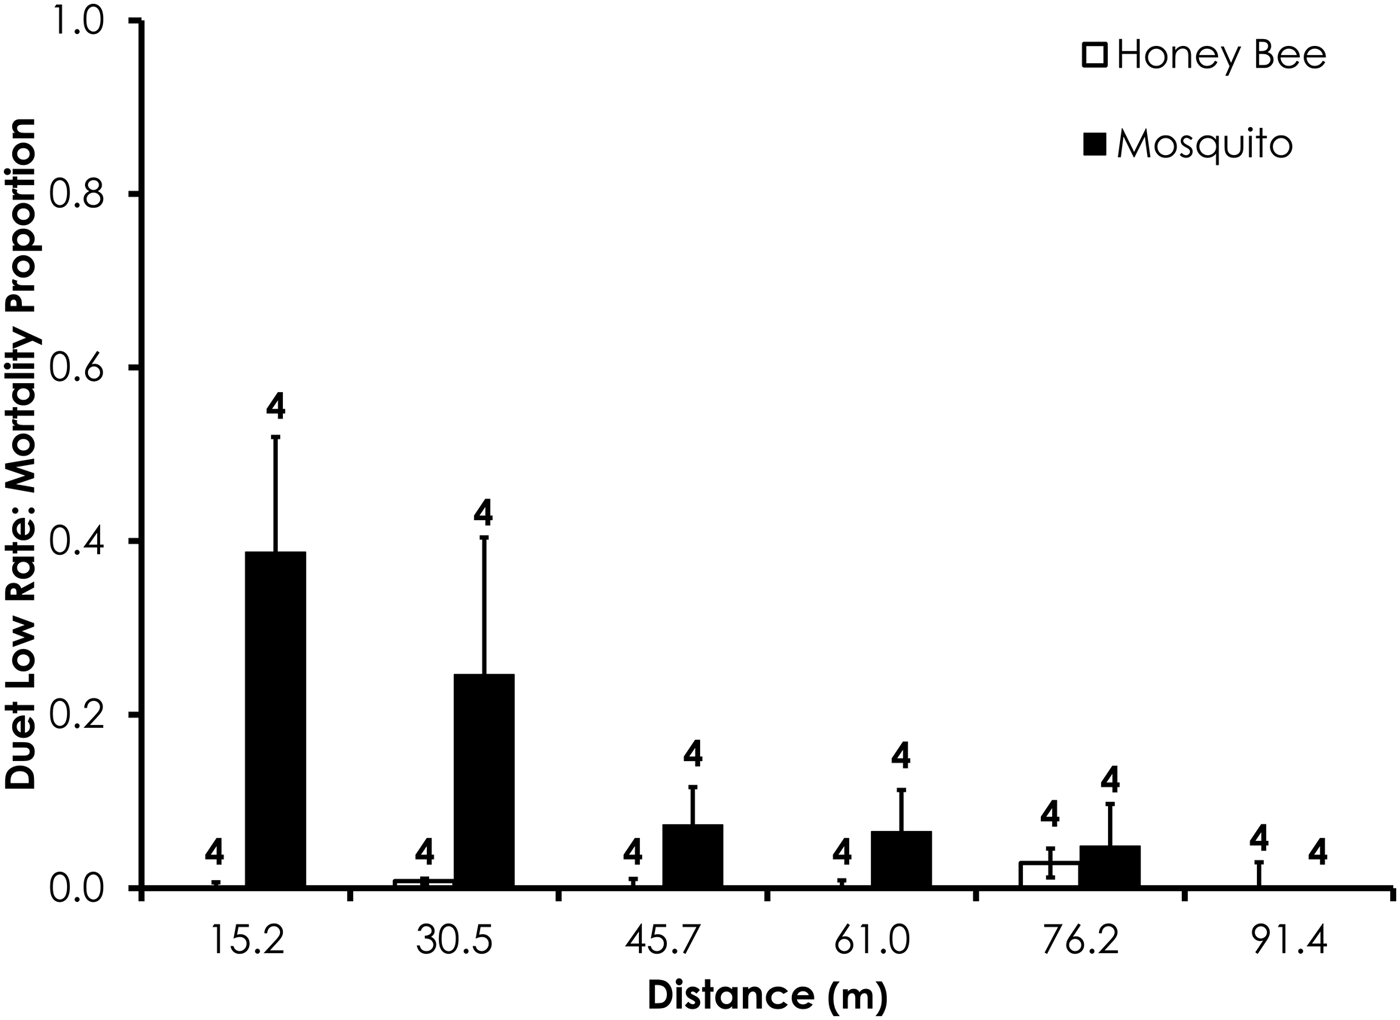
Fig. 4. Honey bee and mosquito mortality at distances from Duet treatment at the low application rate. Control mortality for both honey bees and mosquitoes was 0.0%. Data are shown as average mortality (±SEM). Numbers over mortality bars represent the number of replicates performed in triplicate.
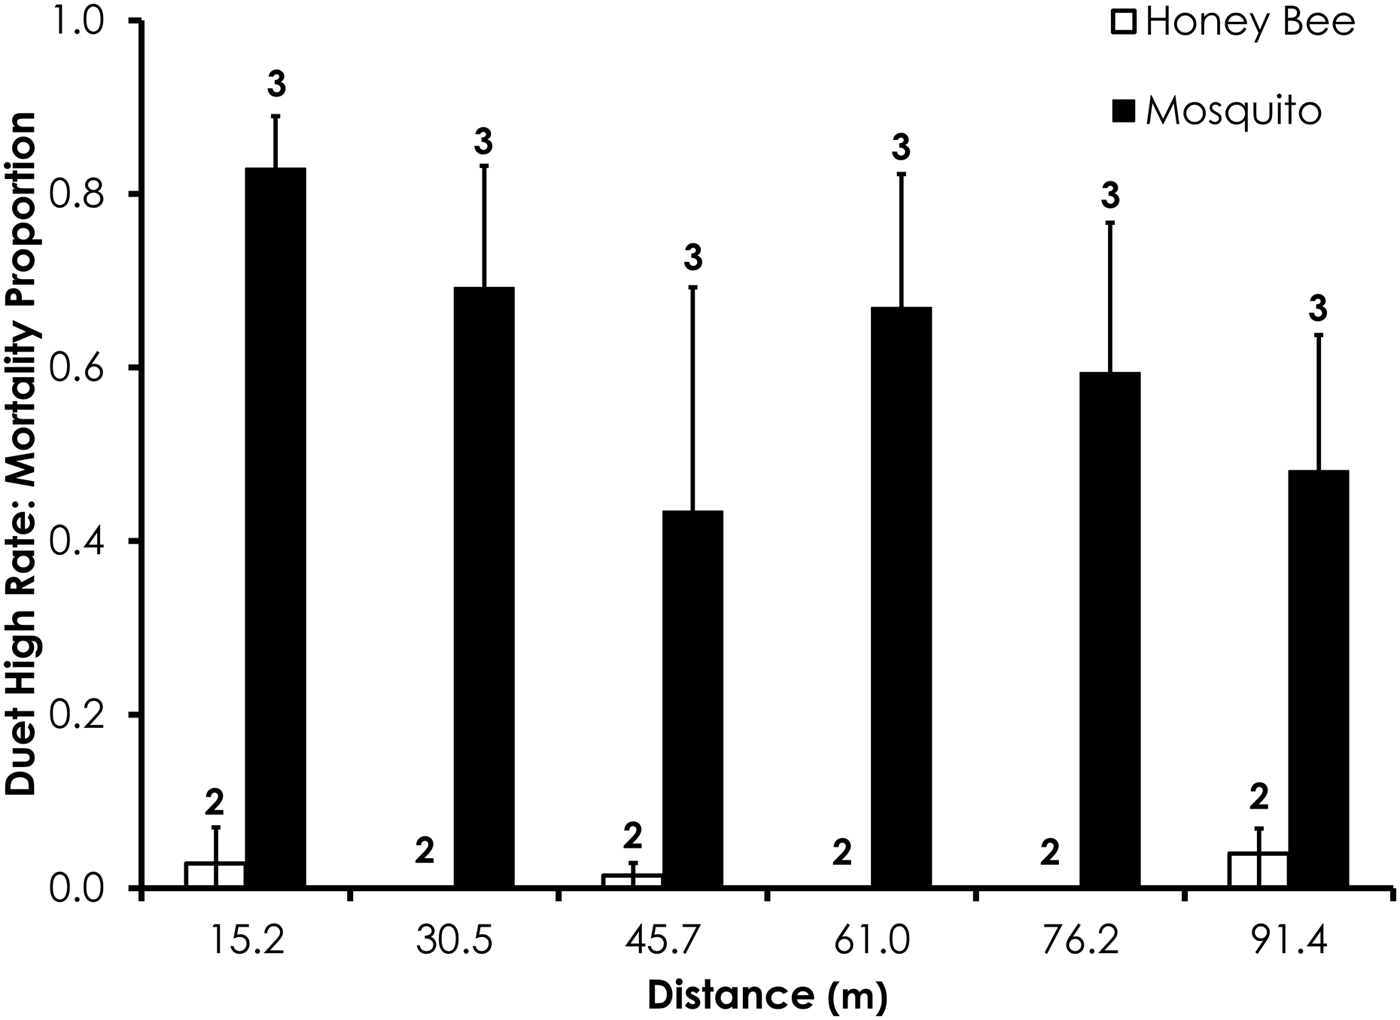
Fig. 5. Honey bee and mosquito mortality at distances from Duet treatment at the high application rate. Control mortality for honey bees and mosquitoes was 1.3 and 2.4%, respectively. Data are shown as average mortality (±SEM). Numbers over mortality bars represent the number of replicates performed in triplicate.
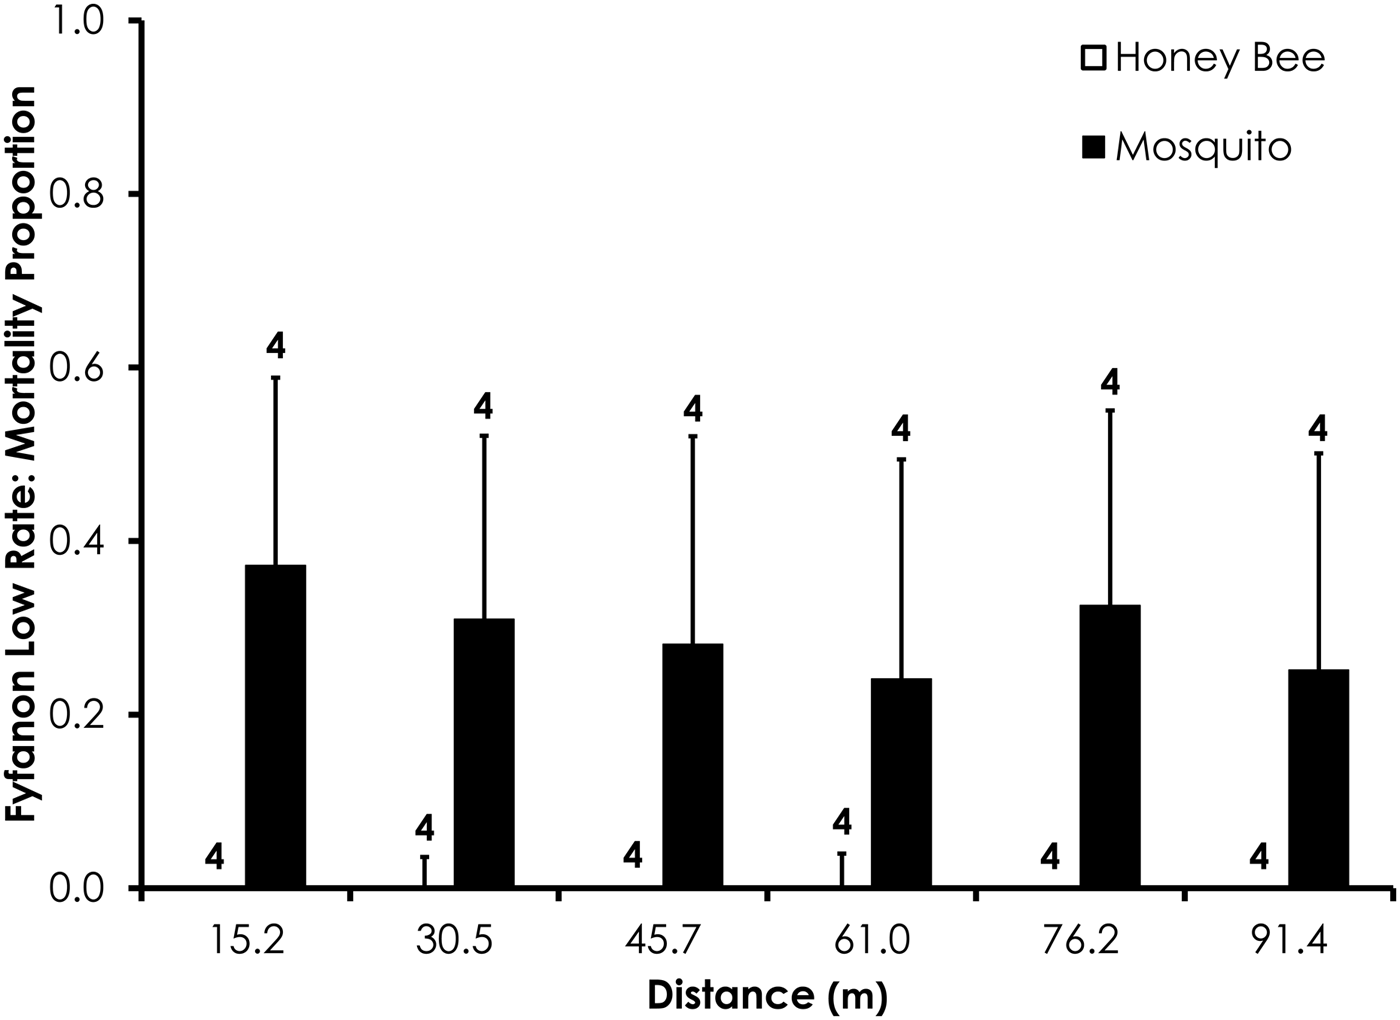
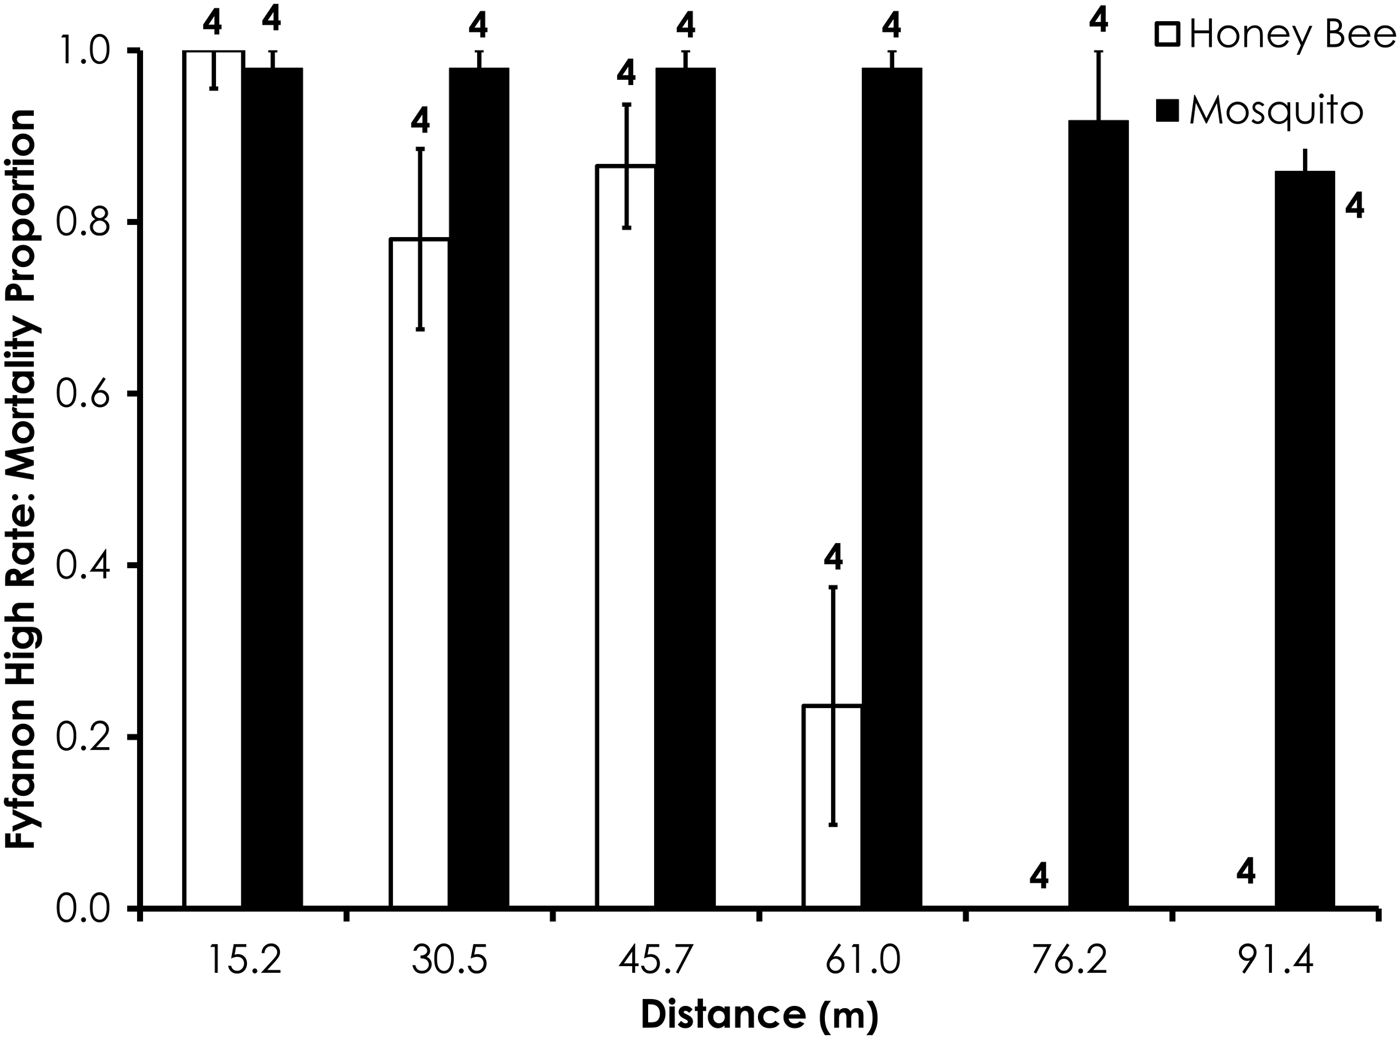
Two replicates were removed from the Fyfanon experiments due to high control mortality (over 20%). After removal, the average control mortality during the Fyfanon experiments was 4.4 and 3.6% for honey bees and mosquitoes, respectively, at the low rate and 4.0 and 8.4% for honey bees and mosquitoes, respectively, at the high rate. Overall, honey bee mortality was significantly lower than mosquito mortality for Fyfanon for the low application rate (df = 47, F = 7.96, P < 0.007; fig. 6) when mortality was pooled across all distances, although there were no significant differences at any single distance (table 3). At the high Fyfanon application rate, honey bee mortality was significantly lower than mosquito mortality when comparing all samples pooled at all distances (df = 47, F = 121.5, P < 0.0001; fig. 7, table 3). Honey bee mortality was >80% at distances as far as 45.7 m when exposed to high-rate application of Fyfanon.
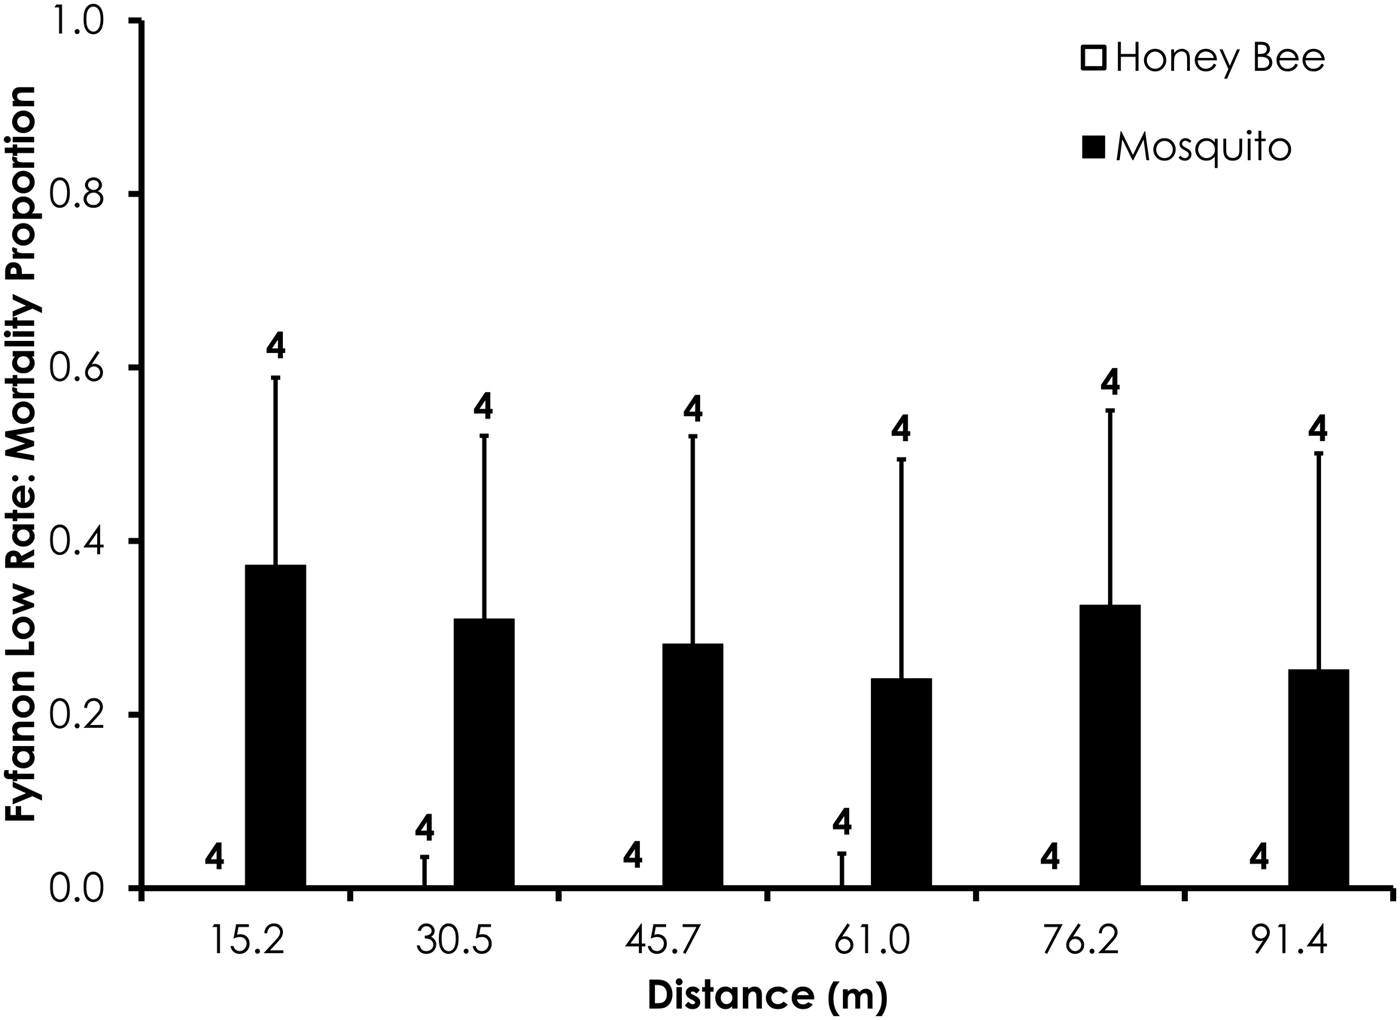
Fig. 6. Honey bee and mosquito mortality at distances from Fyfanon treatment at the low application rate. Control mortality for honey bees and mosquitoes was 4.4 and 3.6%, respectively. Data are shown as average mortality (±SEM). Numbers over mortality bars represent the number of replicates performed in triplicate.
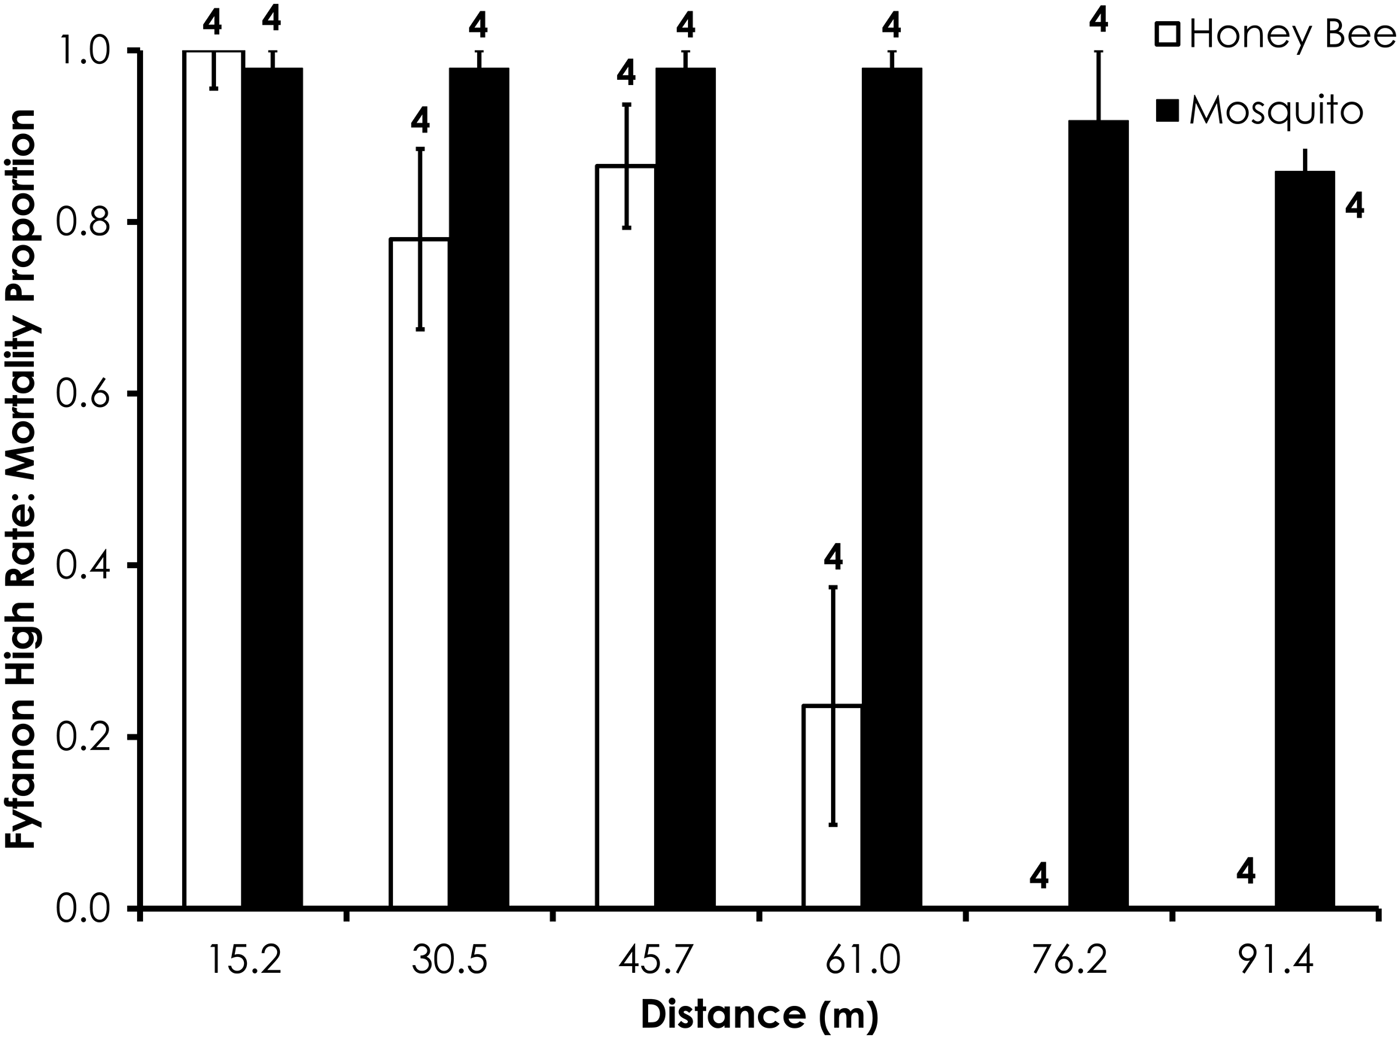
Fig. 7. Honey bee and mosquito mortality at distances from Fyfanon treatment at the high application rate. Control mortality for honey bees and mosquitoes was 4.0 and 8.4%, respectively. Data are shown as average mortality (±SEM). Numbers over mortality bars represent the number of replicates performed in triplicate.
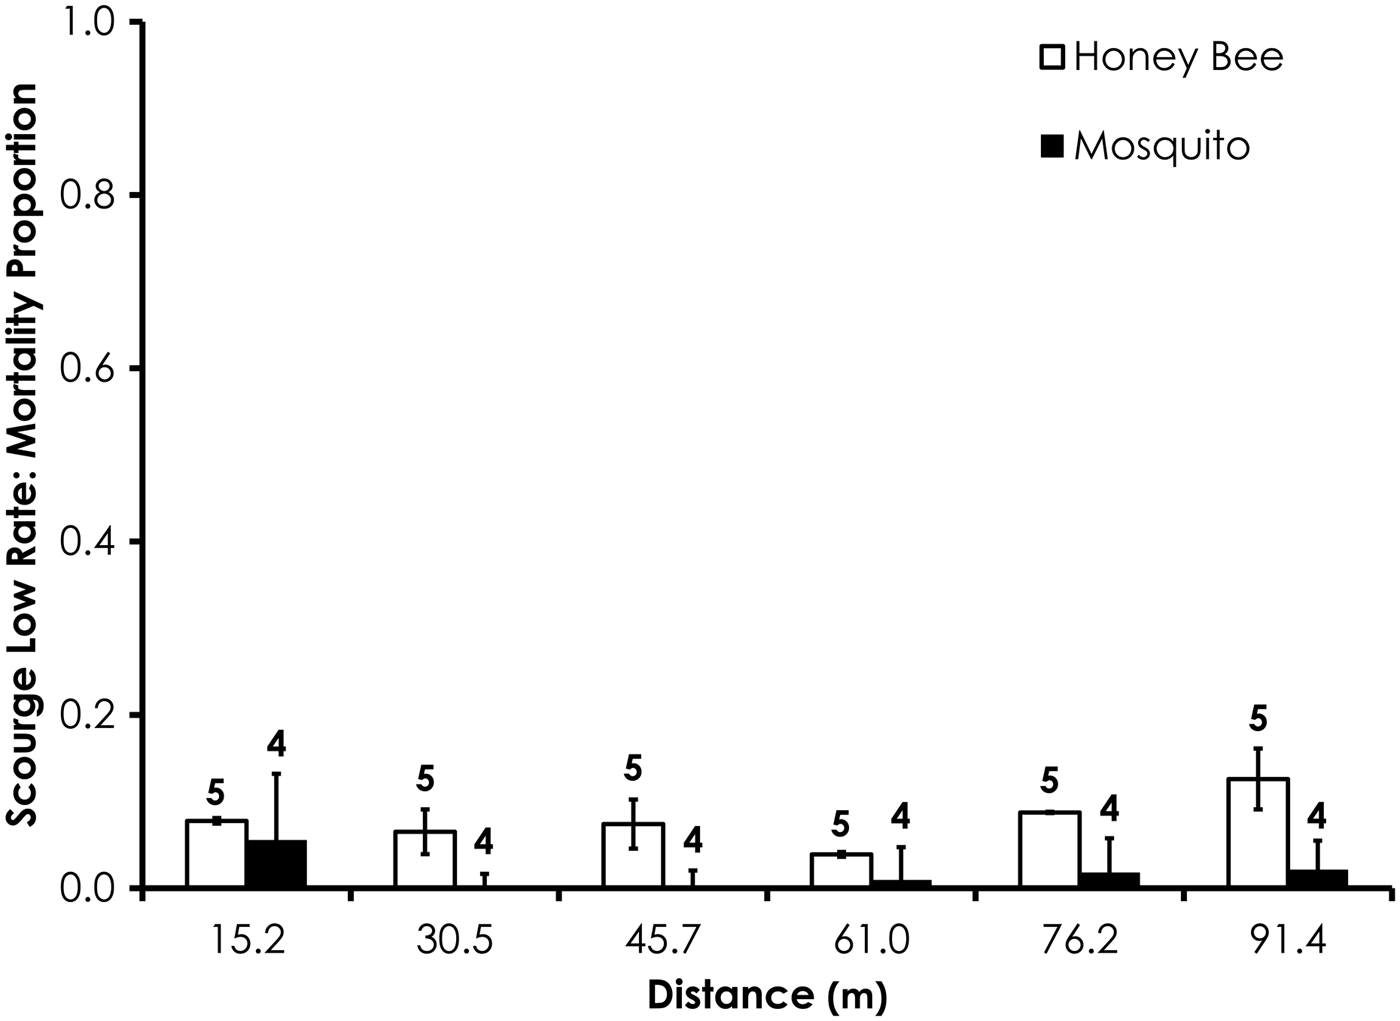
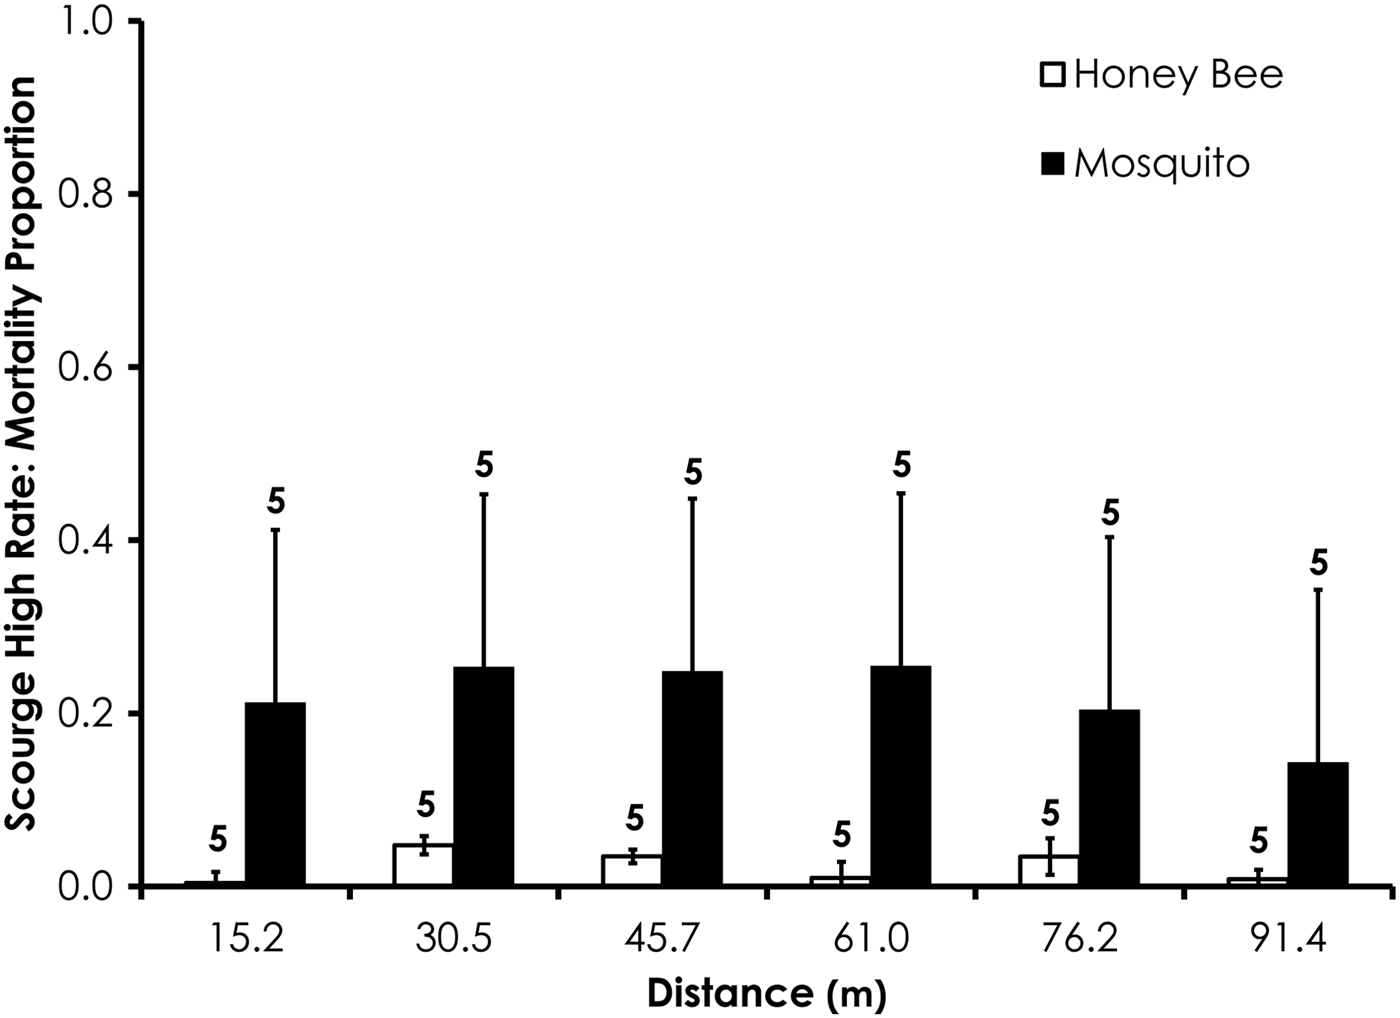
Average control mortality during the Scourge experiments was 1.9 and 4.5% for honey bees and mosquitoes at the low application rate. Control mortality was 6.9 and 0.0% for honey bees and mosquitoes, respectively, at the high Scourge application rates. Overall, honey bee mortality was significantly higher than mosquito mortality for Scourge at the low application rate (df = 53, F = 13.4, P = 0.0006; fig. 8, table 3) when mortality was pooled across all distances, although the average honey bee mortality was <13% for each distance. Honey bee mortality was significantly lower than mosquito mortality at the high rates of Scourge application distance (df = 59, F = 12.9, P = 0.0007; fig. 9, table 3) when mortality was pooled across all distances.
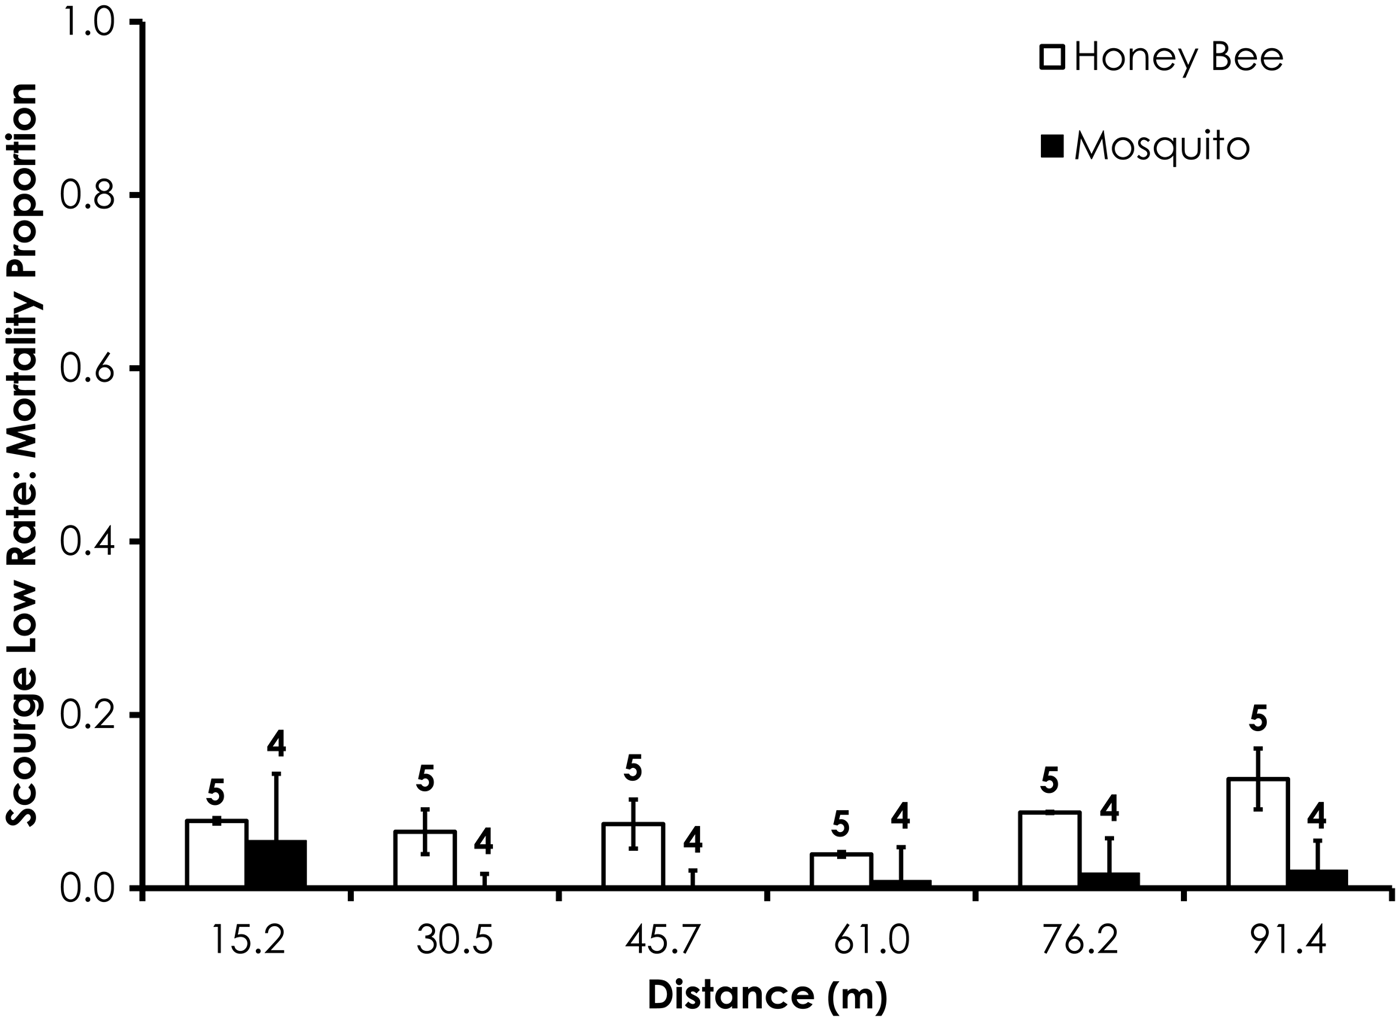
Fig. 8. Honey bee and mosquito mortality at distances from Scourge treatment at the low application rate. Control mortality for honey bees and mosquitoes was 1.9 and 4.5%, respectively. Data are shown as average mortality (±SEM). Numbers over mortality bars represent the number of replicates performed in triplicate.
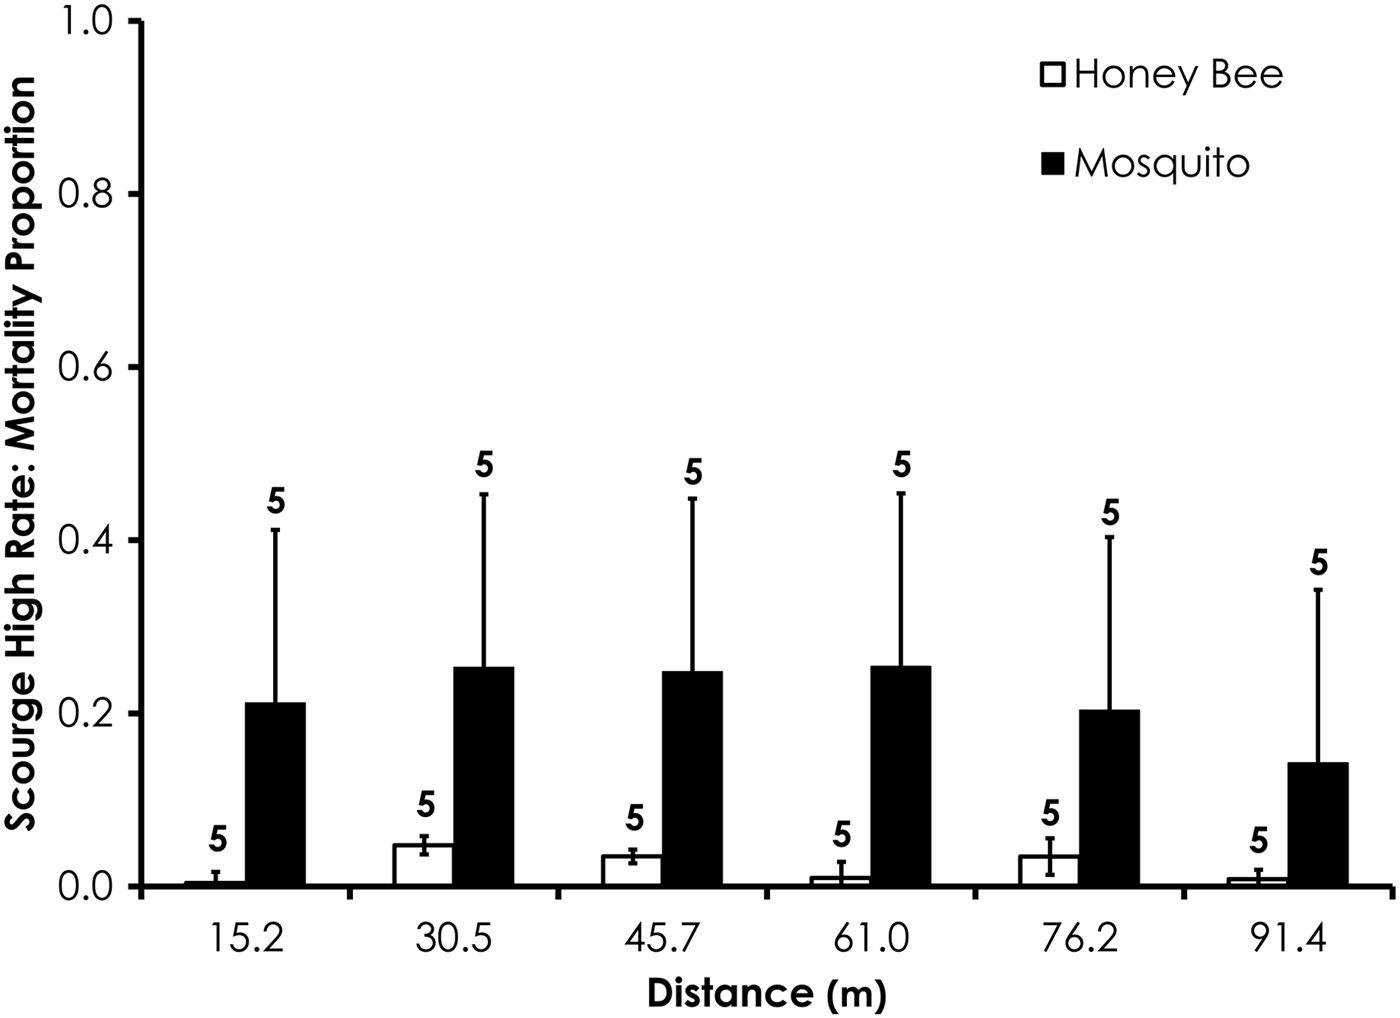
Fig. 9. Honey bee and mosquito mortality at distances from Scourge treatment at the high application rate. Control mortality for honey bees and mosquitoes was 6.9 and 0.0%, respectively. Data are shown as average mortality (±SEM). Numbers over mortality bars represent the number of replicates performed in triplicate.
Factors that significantly influenced honey bee mortality varied by product (table 4). Aqua-Pursuit mortality was significantly increased by higher application rate, D v50, and D v90. An increase in D v50 was the only factor that significantly increased Duet mortality. Fyfanon mortality was significantly reduced by distance, but increased with high application rate, higher number of drops, and larger D v90. No factor in our model was significant to determine mortality due to Scourge.
Table 4. Significant factors that affect honey bee mortality across different products; interactions between these factors and mortality were analyzed by General Linear Regression.

The number under the product indicates how many data points were used in the analysis. The NA in Wind and Temperature columns are because there were no differences in wind and temperature parameters, so those data were not able to be used in the analysis.
Mosquito mortality was significantly affected by more factors than honey bee mortality (table 5). Mortality due to Aqua-Pursuit was significantly reduced by farther distance, but increased at higher deposition, high application rate, and higher wind speed. No factor in our model was significant to determine mortality due to Duet. Fyfanon-induced mosquito mortality was significantly reduced by farther distance, but increased at higher deposition, and higher application rate. Higher deposition, application rate, wind speed, and temperature were significant factors that increased mosquito mortality due to Scourge.
Table 5. Significant factors that affect mosquito mortality across different products; interactions between these factors and mortality were analyzed by General Linear Regression.

The number under the product indicates how many data points were used in the analysis. The NA in Wind and Temperature columns are because there were no differences in wind and temperature parameters, so those data were not able to be used in the analysis.
Discussion
Our results showing lower honey bee mortality compared with mosquito mortality, especially at low application rates and far distances, agrees with other reports on the comparative toxicity of mosquito adulticides to honey bees and mosquitoes as well as the limited impacts of ULV applications. In controlled laboratory experiments, mosquitoes (C. quinquefasciatus) and honey bees (A. mellifera) had similar weight-standardized LD50 values for permethrin (Hardstone & Scott, Reference Hardstone and Scott2010). Under field conditions in our experiments, however, mosquito mortality was significantly higher than honey bee mortality for the permethrin containing product, Aqua-Pursuit. This suggests that environmental factors such as distance, deposition, and wind were significant factors in determining mortality. Furthermore, Aqua-Pursuit is formulated with emulsifiers and adjuvants, as well as the synergist piperonyl butoxide (PBO). Formulated products tend to be significantly more toxic than technical materials (Seccacini et al., Reference Seccacini, Lucia, Harburguer, Zerba, Licastro and Masuh2008). We did observe significant bee mortality ranging from 17 to 42% with high doses of Aqua-Pursuit and more than 80% mortality as far as 45.7 m from the high-dose Fyfanon spray. Obviously care must be taken to avoid direct spray contact with these two pesticides, especially at high application rates.
Large differences in live body weight likely accounts for much of the difference between honey bee and mosquito mortality. Honey bees weigh approximately 35 times more than mosquitoes by weight (82–93 mg for honey bee (Rinkevich et al., Reference Rinkevich, Margotta, Pittman, Danka, Tarver, Ottea and Healy2015) and 2.5 mg for mosquitoes (AMCA mosquito.org/faq)). Weight is an important factor to consider when determining non-target impacts because heavier insects exhibit decreased sensitivity to ULV-applied insecticides (Schleier & Peterson, Reference Schleier and Peterson2010; Chaskopoulou et al., Reference Chaskopoulou, Thrasyvoulou, Goras, Tananaki, Latham, Kashefi, Pereira and Koehler2014). Therefore, caution should be exercised when extrapolating results from highly controlled laboratory studies with technical materials to variable field conditions with formulated products across species.
Distance from application site significantly impacted mosquito and honey bee mortality in this project. The effect of distance from the spray source on honey bee mortality has been previously reported (Hester et al., Reference Hester, Shaffer, Tietze, Zhong and Griggs2001). In that study, overall honey bee mortality was very low, but it declined from 7.6 to 91.4 m from the application line of malathion, much like in our experiments with Fyfanon at the high application rate. In addition to low mortality in that study, there was no impact of malathion application on adult bee population or colony weight. These low impacts (especially at far distances) on honey bees occurred alongside very high mosquito mortality at the same distances. Distance is an important factor affecting mortality as deposition declines with distance. Distance and deposition were important factors for mosquito mortality due to Fyfanon, but only distance was a significant factor for honey bee mortality. Therefore, it appears that the decreased deposition that occurs with increasing distance from the spray line is not sufficient to affect honey bee mortality. Aerial application of Aqua-K-Othrine (2% deltamethrin) and Pesguard S102 (10% d-phenothrin) showed no significant mortality relative to the controls, and exposed colonies had the same number of frames of adult bees, brood population, and colony weight as the control (Chaskopoulou et al., Reference Chaskopoulou, Thrasyvoulou, Goras, Tananaki, Latham, Kashefi, Pereira and Koehler2014). While aerial application of naled resulted in significantly higher numbers of dead honey bees than the control treatment, exposed colonies produced as much honey as the control colonies (Zhong et al., Reference Zhong, Latham, Hester, Frommer and Brock2003). A small number of dead bees in proportion to colony size is likely to have little impact on an otherwise healthy colony as the number of workers that die from insecticide exposure would have to be more than twice the rate of those which die naturally for more than 35 days (Henry et al., Reference Henry, Beguin, Requier, Rollin, Odoux, Aupinel, Aptel, Tchamitchian and Decourtye2012). A prolonged exposure period is unlikely with these products as most of them rapidly degrade over a few hours, and they are not applied on a daily basis.
Increases in the D v50 and D v90 significantly increased honey bee mortality for Aqua-Pursuit, Duet, and Fyfanon, but did not significantly affect mosquito mortality. This demonstrates that larger droplets can result in higher honey bee mortality without any increase in effectiveness in mosquito control. Ensuring that application parameters are consistent with label recommendations may reduce non-target impacts while maintaining efficacious mosquito control.
The dramatic increase in honey bee mortality at close distances with the high rate of Fyfanon is consistent with the high slope of the bioassay dose response curve for malathion (Rinkevich et al., Reference Rinkevich, Margotta, Pittman, Danka, Tarver, Ottea and Healy2015). This shows that a high level of accuracy must be exercised when using malathion containing products for ULV application to avoid the risks associated with high application rates.
It should be noted that these experiments were conducted in a fairly uniform field without obstructions of vegetation or structures, and with insects held in cages. It is likely that the application of these products in a realistic environment that may include buildings, trees, and honey bees in hives will undoubtedly affect the uniformity of product application, hazard to bees, and the efficacy against mosquitoes (Peterson et al., Reference Peterson, Preftakes, Bodin, Brown, Piccolomini and Schleier2016). Fortunately, because mosquito control occurs in the evening when bees are typically protected by the confines of the hive, and because of the rapid photodegradation of most mosquito control materials, the impacts of mosquito control operations on honey bee colonies is likely to be minimal when mosquito adulticides are properly applied. These compounding factors create a strong emphasis for future studies to evaluate actual exposure in real-world scenarios.
Supplementary Material
The supplementary material for this article can be found at https://doi.org/10.1017/S0007485317000347
Acknowledgements
The authors would like to thank Nick DeLisi, Jean M. Pittman, and Emily Boothe from Louisiana State University for assistance with field work; John Griffin, Charles Stoewer, Nelson Hughes, Randy Thomas, Michael Morganti, Owen Jones, Jenny Bodin, and Steve Hahn from East Baton Rouge Parish Mosquito Abatement and Rodent Control for filling mosquito cages, assisting with field work, and recording bioassay results; and Dave Dodge, Victor Rainey, Garrett Dodds, and Dan Winfrey from the USDA-ARS Honey Bee Breeding, Genetics, and Physiology Lab in Baton Rouge, LA for assistance with maintaining honey bee colonies and filling ring cages with honey bees. This manuscript has been approved for publication by the Director of Louisiana Agricultural Experiment Station as Manuscript No 2016-234-28545.


