


Introduction
A common metric of conservation effort is the size and number of protected areas (Pack et al. Reference Pack, Ferreira, Krithivasan, Murrow, Bernard and Mascia2016), which are critical to sustaining natural ecosystems in the context of expanding human impact (Ahmadi et al. Reference Ahmadi, Farhadinia, Cushman, Hemami, Nezami Balouchi, Jowkar and Macdonald2020), and provide important benefits by conserving biodiversity and maintaining ecosystem services (Andam et al. Reference Andam, Ferraro, Pfaff, Sanchez-Azofeifa and Robalino2008, Ma et al. Reference Ma, Li, Li, Han, Chen and Watkinson2009, Schreckenberg et al. Reference Schreckenberg, Franks, Martin and Lang2016, Ma et al. Reference Ma, Chen, Melville, Fan, Liu, Dong, Tan, Cheng, Fuller, Xiao and Li2019). Although covering only 15% of Earth’s terrestrial area (Visconti et al. Reference Visconti, Butchart, Brooks, Langhammer, Marnewick, Vergara, Yanosky and Watson2019), the global protection network has expanded rapidly over the past decade (Ahmadi et al. Reference Ahmadi, Farhadinia, Cushman, Hemami, Nezami Balouchi, Jowkar and Macdonald2020). Among nations, China has some of the highest climatic and ecological diversity (Ren et al. Reference Ren, Young, Wang, Wang, Long, Wu, Li, Zhu and Yu2015). To protect this diversity, China has established a network of strictly managed nature reserves (Wu et al. Reference Wu, Zhang, Yu, Zhao, Li, Wang, Yu, Ma, Chen and Long2011, Ma et al. Reference Ma, Chen, Melville, Fan, Liu, Dong, Tan, Cheng, Fuller, Xiao and Li2019). By the end of 2019, China contained 2,750 nature reserves covering a total area of 1.47 million km2 (Xu et al. Reference Xu, Pimm, Du, Su, Fan, An, Liu and Ouyang2019), which is equivalent to 66% of the overall forest cover in China (NFGA 2020). However, there are still gaps in the coverage of protected areas for biodiversity, as the mismatches between habitat needs of species and availability often occur, and many species are not assured of long-term persistence within the existing ‘man-made boundary’ of a protected area (Newmark Reference Newmark1996, Jenkins et al. Reference Jenkins, Pimm and Joppa2013).
One method commonly used in conservation biology for identifying gaps in conservation lands (e.g. nature reserves) where target species and their habitat or important ecological features occur is known as gap analysis (Jennings Reference Jennings2000). Gap analysis is often based on assessments of species’ habitat needs, determinations of their potential range and subsequent analysis of the adequacy of existing protection networks (Ahmadi et al. Reference Ahmadi, Farhadinia, Cushman, Hemami, Nezami Balouchi, Jowkar and Macdonald2020). Gap analysis can be used to identify habitats not well represented in existing protected areas for a species (Yip et al. Reference Yip, Corlett and Dudgeon2004), and it has been used to assess conservation status in light of landscape changes, habitat loss, and climate change (Sharafi et al. Reference Sharafi, Moilanen, White and Burgman2012), thus informing decision makers about land management priorities. Studies have also employed it to evaluate the representation of species (De Klerk et al. Reference De Klerk, Fjeldså, Blyth and Burgess2004), habitats or vegetation cover (Maiorano et al. Reference Maiorano, Falcucci and Boitani2006, Cano et al. Reference Cano, Pacheco, Refoyo and Tellería2014), and biomes and ecoregions (Franco et al. Reference Franco, Saavedra-Rodríguez and Kattan2007, Sharafi et al. Reference Sharafi, Moilanen, White and Burgman2012) in protected areas.
Reeves’s Pheasant Syrmaticus reevesii, a forest-dwelling Galliformes species (Zheng Reference Zheng2017), is listed as ‘Vulnerable’ on the IUCN Red List (IUCN 2018). As a nationally protected species in China, it is a flagship species for conservation initiatives in some of the mountain ranges in Central China where it was once widely distributed (Cheng et al. Reference Cheng, Tan, Lu, Tang, Bao and Li1978). Reeves’s Pheasants are sensitive to environmental changes, and their survival depends on specific topographical factors, such as altitude and slope (Xu et al. Reference Xu, Zhang, Zheng, Zhang, Sun and McGowan2007, Zhou et al. Reference Zhou, Zhao, Connelly, Li and Xu2017). The species is also strongly affected by land cover and other broad-scale climatic factors (such as temperature and rainfall). Human disturbance is one of the most important factors causing the population decline of Reeves’s Pheasant (Zheng Reference Zheng2015, Zhou et al. Reference Zhou, Zhao, Connelly, Li and Xu2017, Tian et al. Reference Tian, Xu and Wang2020). In the 1990s, illegal hunting was a factor that caused the direct decline in the population of Reeves’s Pheasant (Zheng Reference Zheng2015). Also, eggs are harvested, and chicks, sometimes even adults, are captured to meet the demand for recruits for some zoos or breeding centres, which could directly cause a population decline and decrease in reproductive rate (CITES 2019). In addition, poison baits used by farmers to protect their crops cause additional mortalities of this pheasant (Zhou et al. Reference Zhou, Xu and Zhang2015).
Owing to illegal hunting, habitat loss and fragmentation (MacKinnon et al. Reference MacKinnon, Meng, Carey, Zhu and Melville1996, Zheng and Wang Reference Zheng and Wang1998), Reeves’s Pheasant populations have decreased dramatically, and its distribution has been divided into two geographical parts (Zhou et al. Reference Zhou, Xu and Zhang2015). The effective population size of Reeves’s Pheasant has decreased about 99% over the last thousand years (Chang et al. Reference Chang, Wang, Chen and Zhang2011, CITES 2019). An investigation in Taibai County in Qinling Mountains in Shaanxi showed that the population density in the breeding season has a tendency to decrease: 6.1 birds / km2 in 1983, 3.5 birds / km2 in 1985, and 2.6 birds / km2 in 2001–2002 (CITES 2019). According to the report of the First National Terrestrial Wildlife Resource Survey published in 2009, there were about 23,000 Reeves’s Pheasants remaining in the wild in China. However, the surveys in 89 historical distribution sites from 2011 to 2012 found that the pheasant has disappeared from 46% of the surveyed sites and populations decline in 46 sites, and the population densities in protected areas in 2011 were significantly lower compared to those in 2003–2005 (Zhou et al. Reference Zhou, Xu and Zhang2015). Moreover, the estimation made by the IUCN was only 3,500–15,000 in 2018 (IUCN 2018). Due to the decrease in abundance, Reeves’s Pheasant was recently listed in Appendix II of CITES (CITES 2019) and upgraded as a first class national protected animal (NFGA 2021b).
The central and provincial governments have assigned great importance to the conservation of this species and established more than 60 national nature reserves (NNRs) specifically for its conservation, as the species is endemic to China and it is closely related to some traditional cultures of the country. However, the Reeves’s Pheasant population continues to decline at a rate of about 20% per decade, and its range is also shrinking dramatically even within nature reserves (Zhou et al. Reference Zhou, Xu and Zhang2015, Reference Zhou, Zhao, Connelly, Li and Xu2017). In reality, the distribution, population size, and survival of this species likely reflect the quality of the forests they inhabit (Zhang et al. Reference Zhang, Ding, Ding and Zheng2003), and it is critical to assess the nature reserves, especially the NNRs that may be important for the conservation of this species. Therefore, this study aimed to: 1) characterize the current distribution of Reeves’s Pheasant; 2) identify gaps in protecting Reeves’s Pheasant in the NNR network as the representation of existing protected areas; and 3) provide suggestions for the management of nature reserves for Reeves’s Pheasant and species or locations with similar conservation needs.
Methods
Study area and data collection
Using data on the historical distribution of Reeves’s Pheasant, current reports, and interviews with the personnel of provincial forestry departments responsible for wildlife conservation and management, we established a rough outline of the species’ distribution in China. After 1980, Reeves’s Pheasants have been documented in Anhui, Chongqing, Gansu, Guizhou, Henan, Hubei, Hunan, Shaanxi, Sichuan and Yunnan provinces or municipalities (Wu et al. Reference Wu, Li and Wang1994, Zheng Reference Zheng2015). We excluded Yunnan and Gansu province from our study as there were no reports of Reeves’s Pheasant from these two provinces in the last 30 years (Zhou et al. Reference Zhou, Xu and Zhang2015). Therefore, eight provinces or municipalities were included in this study, covering an area of 741,104 km2 and encompassing a total of 233 counties and cities (Figure 1).
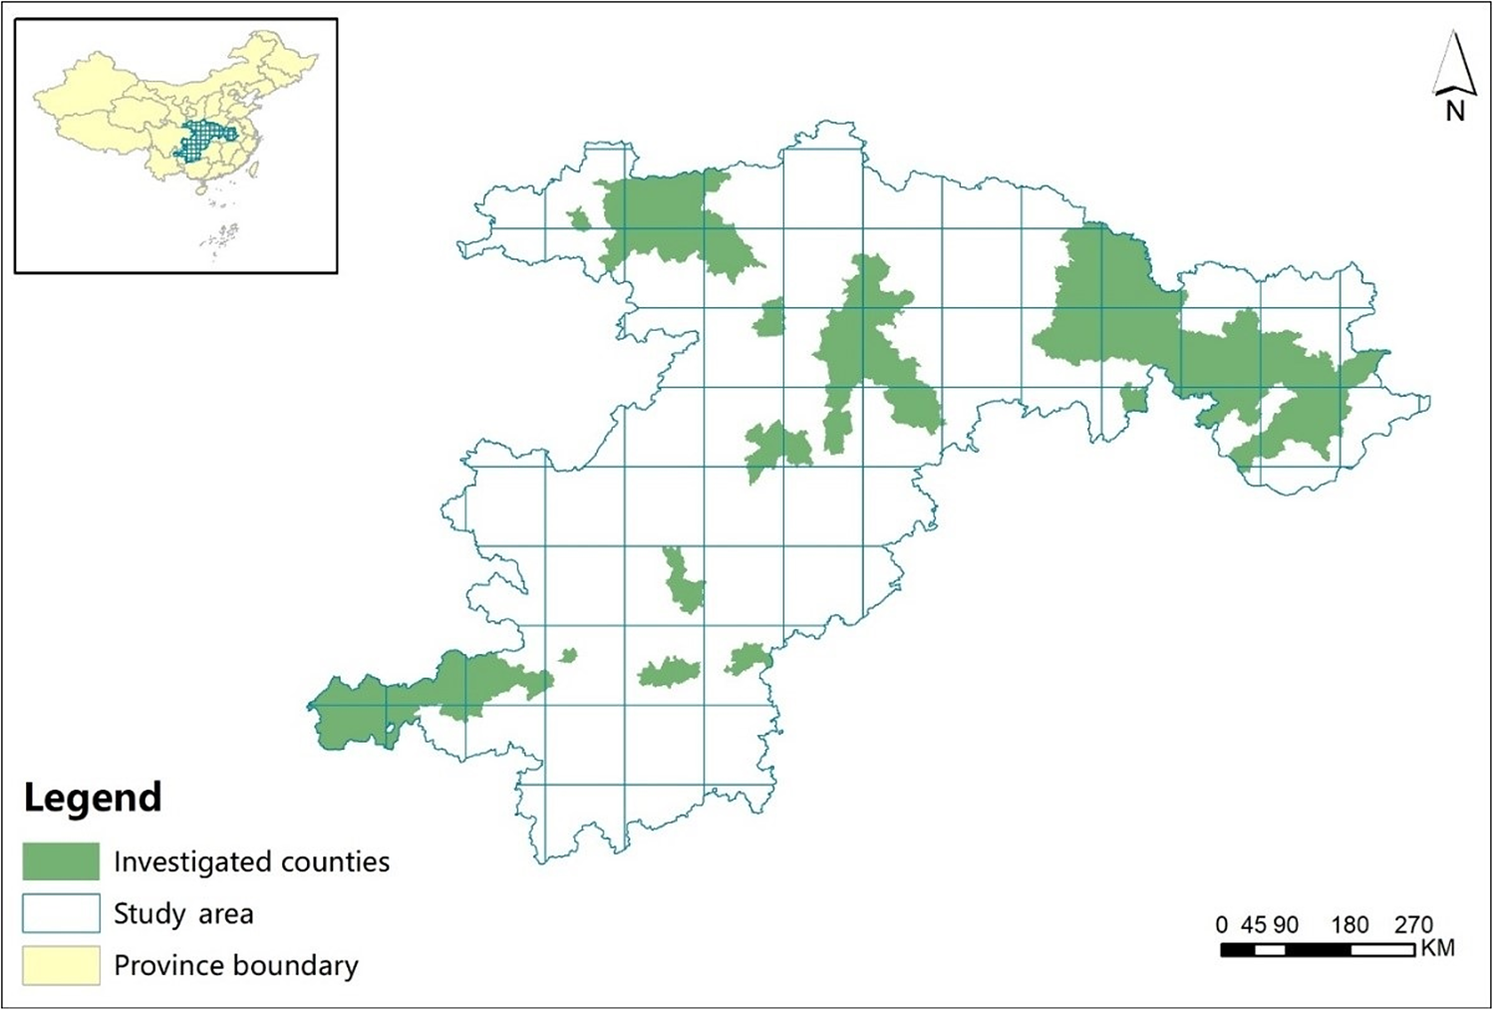
Figure 1. Location of the study area surveyed to determine the distribution of Reeves’s Pheasants in 2018–2019.
We divided the study area into grid cells of 100 km × 100 km, which ensured complete coverage of study area and the feasibility of completing field surveys within the limits of time and available funds (Figure 1). We contacted staff of county or municipal forestry bureaus to obtain detailed information of Reeves’s Pheasant for each county on monitoring and annual wildlife surveys. Based on records and surveys we excluded counties or municipalities where there was convincing evidence that the species had not been recorded for more than 25 years. As a result, we identified 49 counties or municipalities for field surveys and to reduce spatial autocorrelation, the distance between sites was kept to at least 20 km (Dormann et al. Reference Dormann, McPherson, Araujo, Bivand, Bolliger, Carl, Davies, Hirzel, Jetz, Kissling, Kuehn, Ohlemueller, Peres-Neto, Reineking, Schroeder, Schurr and Wilson2007, Zhou et al. Reference Zhou, Xu and Zhang2015).
To further ensure that our field work covered possible occurrence areas, we first interviewed 4–5 local village elders who were mostly hunters previously and had extensive knowledge of local pheasant species at each site. We verified their ability to identify Reeves’s Pheasant by showing them photographs of male Reeves’s Pheasants along with similar species such as Ring-necked Pheasant Phasianus colchicus, Golden Pheasant Chrysolophus pictus, Koklass Pheasant Pucrasia macrolopha and Temminck’s Tragopan Tragopan temminckii. We included information only from interviewees who identified Reeves’s Pheasant correctly for the field surveys. Additional informal interviews with similar procedures were conducted to reaffirm findings from the interviews. For sites where there was no evidence of Reeves’s Pheasant for more than 10 years, we considered the species locally extinct (Zhou et al. Reference Zhou, Xu and Zhang2015).
During the breeding season (March to June) of 2018 and 2019 when the birds were easier to identify, we conducted systematic surveys of Reeves’s Pheasant in the study area using similar protocols employed by Zhou et al. (Reference Zhou, Xu and Zhang2015) in the same area: line transects of 850–3,600 m length were randomly distributed within the survey area (Zhou et al. Reference Zhou, Xu and Zhang2015, Tian et al. Reference Tian, Xu and Wang2020); a fixed width of 50 m each side of the line transects was surveyed to assess abundance by direct sightings and indirect evidence (e.g. feathers, nest sites, wing-whirring sounds, etc.) of the presence of Reeves’s Pheasant. We focused surveys on forest and shrublands and excluded grasslands, wetlands, impervious surfaces, and barren lands because Reeves’s Pheasant does not use these habitats (Tian et al. Reference Tian, Xu and Wang2020).
A total of 219 line transects were surveyed. We excluded detections within 1 km to avoid pseudo-replication and spatial autocorrelation by using ArcMap 10.4 (Esri Inc., 2017) as the average maximum home range of Reeves’s Pheasant measures 1.05 km across (Zheng Reference Zheng2015, Zhou et al. Reference Zhou, Zhao, Connelly, Li and Xu2017, Tian et al. Reference Tian, Xu and Wang2020). A total of 171 occurrence locations were retained for modelling habitat suitability. The GPS coordinates of all field survey locations were recorded with an accuracy within 10 m (GPSMAP 60CSX, Garmin Inc.).
Environmental variables
The presence of Reeves’s Pheasant is affected by environmental factors, including topography, climate, land cover, and human disturbance (see Xu et al. Reference Xu, Zhang, Zheng, Zhang, Sun and McGowan2007, Zheng Reference Zheng2015, Zhou et al. Reference Zhou, Zhao, Connelly, Li and Xu2017). We used these four groups of environmental variables to model the occurrence and suitable habitat of Reeves’s Pheasant. Topographic variables (altitude, slope, and aspect) were derived from a digital elevation model (DEM) (http://srtm.csi.cgiar.org/, retrieved 9 May 2019). The slope orientation was reclassified to eight aspect classes: north, north-east, east, south-east, south, south-west, west, and north-west. We used 19 bioclimatic variables downloaded from the database of WorldClim (http://worldclim.org/). These bioclimatic variables are derived from the monthly temperature and rainfall values, representing annual trends (e.g. mean annual temperature, annual precipitation) seasonality (e.g. annual range in temperature and precipitation) and extreme or limiting environmental factors (e.g. temperature of the coldest and warmest month, and precipitation of the wet and dry quarters), and are often used in species distribution and ecological modelling (Fick and Hijmans Reference Fick and Hijmans2017). Land cover data were obtained from Finer Resolution Observation and Monitoring of Global Land Cover (FROM-GLC) (http://data.ess.tsinghua.edu.cn/, retrieved 15 April 2019); these 10 m resolution land cover maps included 10 land cover types, including Cultivated land, Forest, Grassland, Shrubland, Wetland, Water bodies, Tundra, Impervious surface, Bareland, Permanent snow and ice. Land-cover data were resampled to a resolution of 1 km for consistency with the bioclimatic data. The human influence index (HII, Version 2, 2005) data were downloaded from the Wildlife Conservation Society (WCS) and the Columbia University Center for International Earth Science Information Network (CIESIN) (https://sedac.ciesin.columbia.edu/data/set/wildareas-v2-human-influence-index-geographic). It is a global dataset of 1 km grid cells, created from nine global data layers covering human population pressure (population density), human land use and infrastructure (built-up areas, night time lights, land use / land cover), and human access (coastlines, roads, railroads, navigable rivers) (WCS and CIESIN 2005).
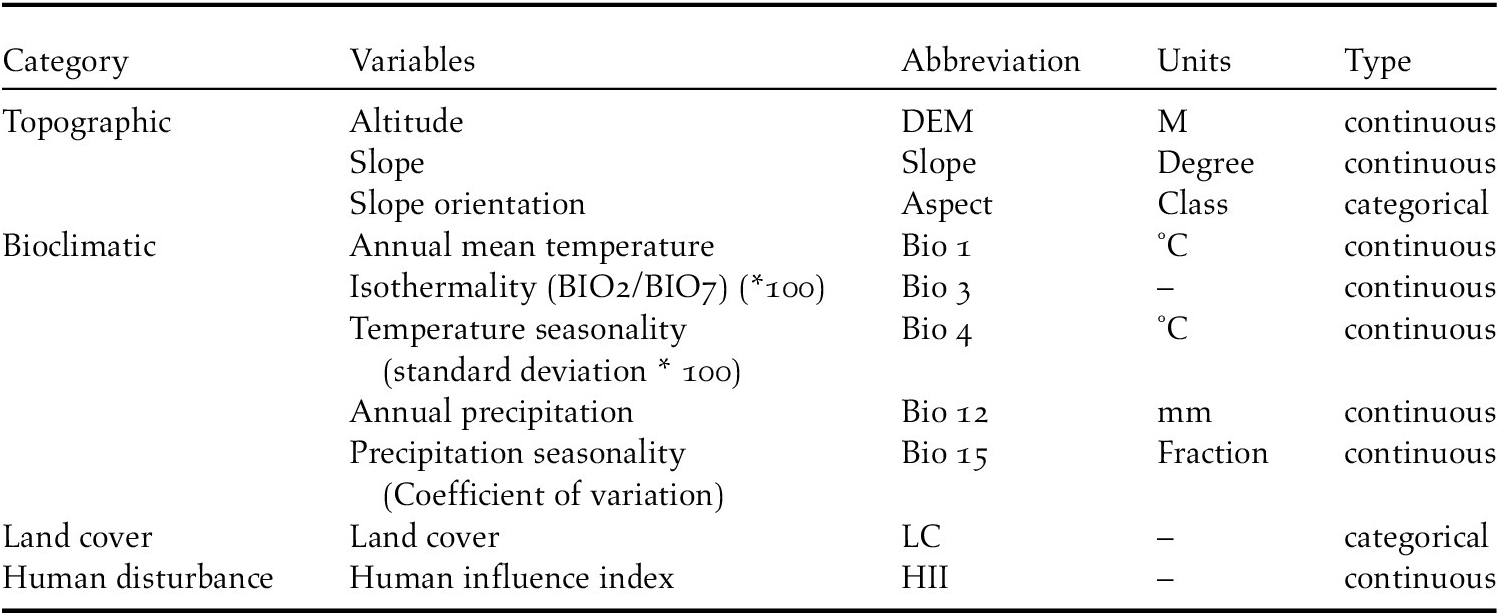
To reduce multicollinearity between model variables, we used the ‘band collection statistics’ in the ‘spatial analyst’ extension of ArcMap to calculate correlations among variables (Lu et al. Reference Lu, Jing, Lloyd and Sun2012). If two variables were found to be highly correlated (R 2 > 0.75), we removed one from modelling based on the variable that was deemed to be less relevant in to Reeves’s Pheasant and habitat management (Razgour et al. Reference Razgour, Hanmer and Jones2011). In consequence, a total of 10 variables were retained to model the occurrence and suitable habitat for Reeves’s Pheasant (Table 1). Environmental layers were treated as either continuous or categorical, depending on the variable properties. For example, land cover type and slope orientation were coded categorically, while altitude was continuous. All predictor layers had the same spatial extent, resolution, origin, and projection.
Table 1. Selected environmental variables for modelling the habitat suitability distribution for Reeves’s Pheasant.
Habitat distribution prediction
To reduce the uncertainty associated with the predictions based a single model and increase the efficacy of conservation effort, we adopted the ensemble modelling approach based on multi-model predictions (Jones-Farrand et al. Reference Jones-Farrand, Fearer, Thogmartin, Iii, Nelson and Tirpak2011) for the occurrence and suitable habitat. We used ‘dismo’ package for species distribution modelling of R 4.0.3 (Hijmans et al. Reference Hijmans, Phillips, Leathwick and Elith2014). Six modelling algorithms, including two profile methods (bioclimatic envelope algorithm [Bioclim] and domain algorithm [Domain]), two classical regression models (generalized linear models [GLMs] and generalized additive models [GAMs]) and two machine learning methods (random forest [RF] and maximum entropy [MaxEnt]), were chosen as they were reported to have high performance in species distribution assessments (Martinez-Freiria et al. Reference Martinez-Freiria, Argaz, Fahd and Brito2013, Naimi and Araújo Reference Naimi and Araújo2016). Profile methods only consider presence data, while regression and machine learning methods use both presence and absence. As confirmed absences are difficult to obtain, especially for mobile and / or secretive species, pseudo-absences are usually derived from the background data (Phillips et al. Reference Phillips, Anderson and Schapire2006, Martinez-Freiria et al. Reference Martinez-Freiria, Argaz, Fahd and Brito2013). We generated absence data using the predictor raster data and random points function in the software package to create a raster ‘mask’ such that the background random points were from the same geographic area for places where there were background values.
For Bioclim modelling, predicted values larger than 0.5 are subtracted from 1, the minimum percentile score across all the environmental variables was computed, and the final value subtracted from 1 and multiplied with two so that the results were between 0 and 1. For Domain modelling, the minimum distance between a site and any of the training points of each variable was taken; to integrate environmental variables, the maximum distance to any of the variables was generated, subtracted from one, and values below zero were truncated so that the scores were between 0 (low) and 1 (high). We used ‘logit’ as the link functions and ‘binomial’ distribution for GLMs. Our GAMs included multiple smoothing functions to model the complex patterns. We fitted MaxEnt as the profile methods (e.g. Bioclim) and provided presence points and a RasterStack of predictors. RF relies on a diverse set of classifiers with randomness in the classifier construction. We used all default settings of the software for RF modelling for predicting presence and absence.
We used 80% of occurrence points for training the models, and the remaining 20% were used to test their performance. The area under the curve (AUC) of the receiver operating characteristic (ROC) plot was used to assess the prediction accuracy of models (Phillips et al. Reference Phillips, Anderson and Schapire2006, Phillips and Dudik Reference Phillips and Dudik2008). We excluded the ‘Bioclim’ and ‘Domain’ models from final ensemble predictions because their AUC values were below 0.7 (an threshold that is commonly used to identify ‘poor’ models) and averaged the predictions from remaining models (Hijmans Reference Hijmans2012, Kindt Reference Kindt2018). We created the weights for the predictions from each model based on its AUC score by subtracting 0.5 (the random expectation) and squaring the result, which gave further weight to the models with higher AUC values. The average of the weighted predictions from different models was used as the ensemble prediction. We then converted ensemble predictions to a binary suitable (presence) and unsuitable (absence) map with the classification threshold based on the “maximum of the sum of the sensitivity (true positive rate) and specificity (true negative rate)” (Liu et al. Reference Liu, Berry, Dawson and Pearson2005, Pearson et al. Reference Pearson, Raxworthy, Nakamura and Peterson2007).
Gap analysis
Nature reserves in China are managed nationally or locally. Among these protected areas, NNRs are considered the best designed and managed because of the highest conservation priority with rich biodiversity, concentrated distribution of rare and endangered species, and less developed ecosystems. Aiming to protect species and the environment, a strict environmental protection institution system has been established based on strict prevention of sources, strict control of processes and severe punishment of consequences (The State Council of PRC 2005, Zhang et al. Reference Zhang, Luo, Mallon, Li and Jiang2017, Ma et al. Reference Ma, Chen, Melville, Fan, Liu, Dong, Tan, Cheng, Fuller, Xiao and Li2019).
The NNRs play a more important role in biodiversity conservation, national and international significance for conservation, science and scientific research compared to local (i.e. provincial and county) nature reserves (LNRs) (The State Council of PRC 2017), as LNRs (provincial and county-level reserves) are often not as well managed and generally have lower conservation value (MEE PRC 2018, Ma et al. Reference Ma, Chen, Melville, Fan, Liu, Dong, Tan, Cheng, Fuller, Xiao and Li2019). Moreover, we currently do not have data to estimate how much suitable habitat is available outside the NNR network because of the lack of clear boundaries of these protected areas (The State Council of PRC 2005, Xu et al. Reference Xu, Li, Pimm, Hull, Zhang, Zhang, Xiao, Zheng and Ouyang2016). A gap analysis was performed by overlapping the habitat suitability map based on the ensemble models with the NNR network map. By the end of 2019, there were 66 NNRs in the study area, and we excluded three wetland NNRs as Reeves’s Pheasant does not use wetland and retained 63 NNRs for further analysis. The map of NNR boundaries was digitized using data from the Ministry of Ecology and Environment (http://www.mee.gov.cn/ accessed November 2019). All mapping steps were performed in ArcMap 10.4.
Effectiveness of functional zoning
Nature reserves in China are designed to include three functional zones, core, buffer, and experimental zones (The State Council of PRC 2005, Ma et al. Reference Ma, Chen, Melville, Fan, Liu, Dong, Tan, Cheng, Fuller, Xiao and Li2019). According to the Regulations of Nature Reserves (2017), the core zone is for protecting the important natural ecosystems and suitable habitat for threatened species, the experimental zone allows for sustainable development, while between these two zones, the buffer zone serves to reduce the impact of human activities on the core zone (The State Council of PRC 2017). Trespass is not allowed in the core and buffer zones without special approval, and ecotourism and other business operations are only allowed in the experimental zone (The State Council of PRC, 2005, 2017). To understand the effectiveness of the functional zones of the existing NNRs for habitat protection of Reeves’s Pheasant, we overlayed a map of the NNR network with the distribution map of suitable habitat for Reeves’s Pheasant. We digitized the functional zones of the 63 NNRs using data from the Ministry of Ecology and Environment (http://www.mee.gov.cn/, accessed November 2019). After overlaying the maps, we calculated the area and percentage of suitable habitat in the functional zones of each NNR.
Results
Species distribution model
The ensemble model from four predictive algorithms with good discriminatory power. The weighted average area under the curve (AUC) across the four models was 0.87, comprising RF (AUC = 0.99), MaxEnt (0.89), GAMs (0.80) and GLMs (0.78) (Figure S1 in the online supplementary material).
The suitable habitat covered an area of 36,189 km2 (4.9%) (Figure 2) in the study area, The distribution of suitable habitat was largely divided into two regions, eastern (Dabie Mountains) and western (Qinling, Daba Mountains and Dalou Mountains).
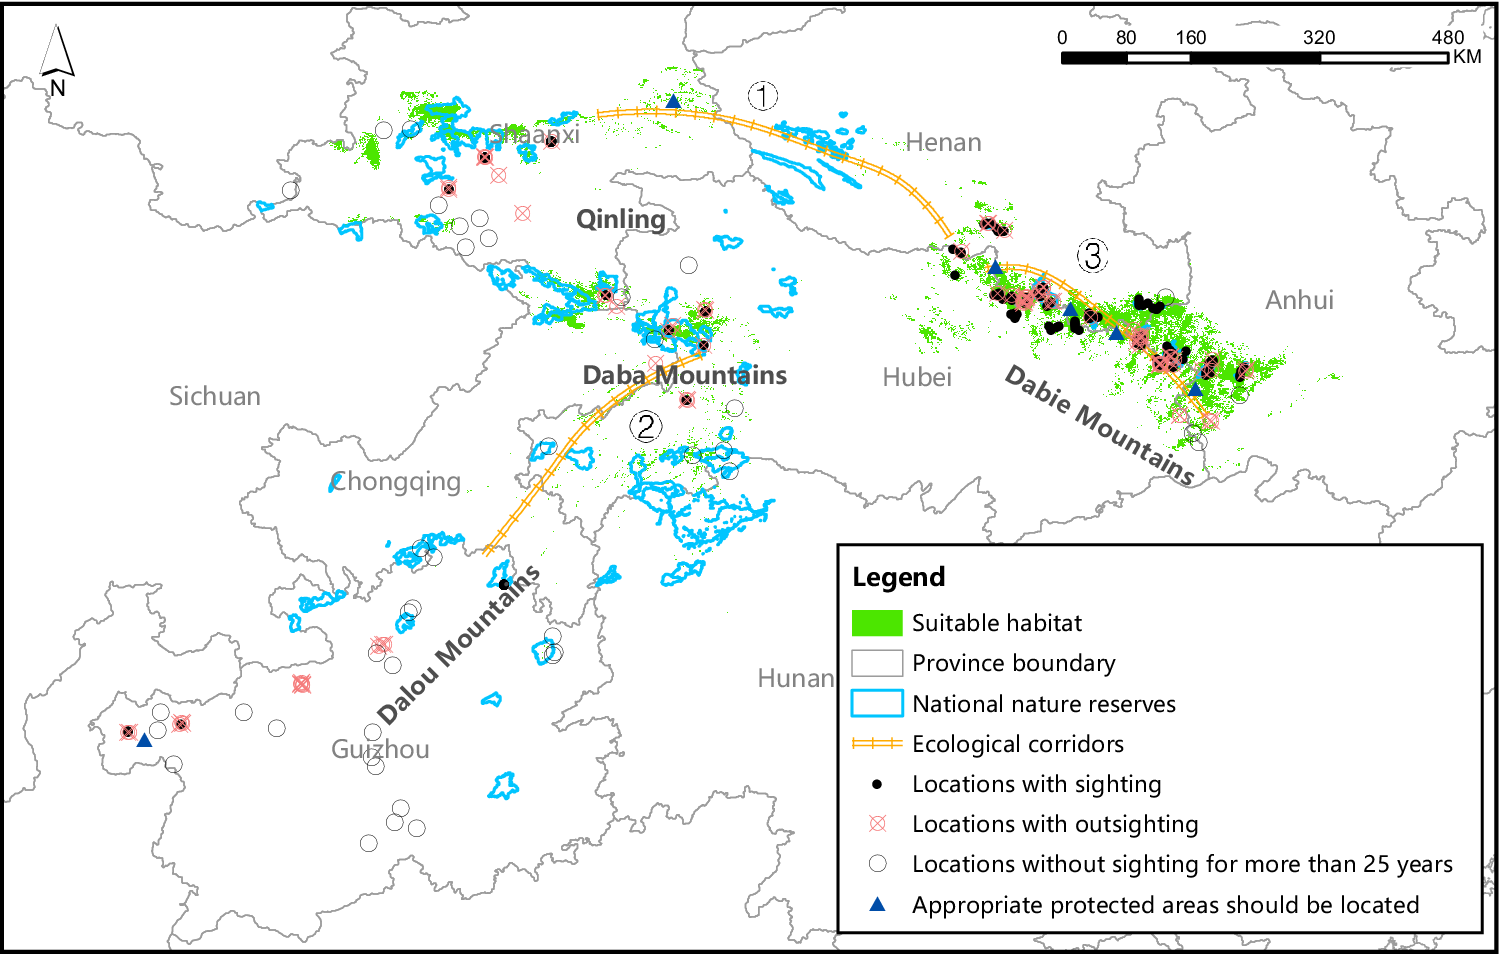
Figure 2. The NNRs, survey locations, suitable habitat, and potential ecological corridors of Reeves’s Pheasant based on the gap analysis.
Gap analysis
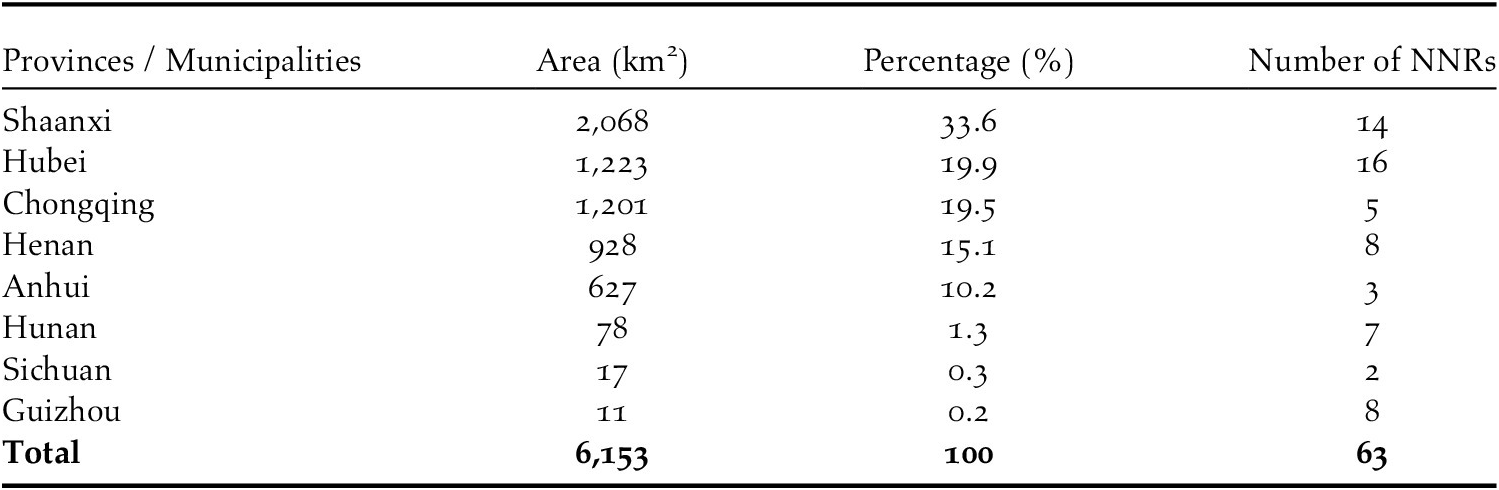
There were major conservation gaps in the suitable habitat of Reeves’s Pheasant. Only 17.0% (6,153 km2) of the suitable habitat was within the NNR network (45 NNRs), and only five provinces or municipalities (Shaanxi, Hubei, Chongqing, Henan and Anhui) of 29 NNRs had more than 10% of the suitable habitat within the NNR network (Table 2). Within the network, 45.1% the suitable habitat occurred in Dabie Mountains (including parts of Henan, Anhui and Hubei provinces) (Table 2), and only nine (14.3%) NNRs were located in the Dabie Mountains (Figure 2).
Table 2. The suitabile habitat of Reeves’s Pheasant within the national natural reserves (NNRs) network by provinces or municipalites.
Effectiveness of the functional zoning in the suitable habitat conservation
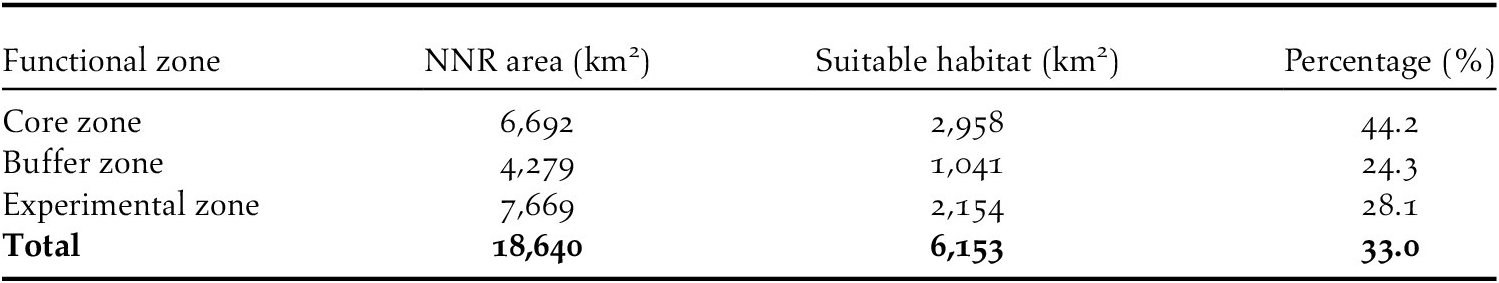
The suitable habitat for Reeves’s Pheasant accounted for less than 33.0% of the total area encompassed by the NNRs in our study area (Table 3). Of the suitable habitat of this species, the core zone accounted for the highest proportion (44.2%), followed by experimental and buffer zones, 28.1% and 24.3%, respectively (Table 3).
Table 3. The total and suitable habitat area of Reeves’s Pheasant within the national natural reserves (NNRs) by functional zone.
Discussion
Distribution of suitable habitat and conservation gaps
Nature reserves are the most important and effective refuges for wild species in China (Ma et al. Reference Ma, Chen, Melville, Fan, Liu, Dong, Tan, Cheng, Fuller, Xiao and Li2019). However, more than 80% of the suitable habitat for Reeves’s Pheasant falls outside the NNR network. The existing NNRs also do not put in as much effort as they should be to protect Reeves’s Pheasant based on our observations and existing data. Suitable habitat within the network occurred at only 45 NNRs in the study area, and was concentrated at 29 NNRs of the five provinces or municipalities (>98%). There are similar observations on other species with extensive suitable habitat occurring outside the NNR network and unprotected, such as Giant Panda Ailuropoda melanoleuca (Yang et al. Reference Yang, Qin, Xu, Busch, Yang, Gu, Yang, Wang, Dai and Xu2020), Brown-eared Pheasant Crossoptilon mantchuricum (Li et al. Reference Li, Cui, Qiu, Ding and Batool2016, Song et al. Reference Song, Mi, Yang, Sun, Sun and Xu2020), and the most concerned endangered species in China (Wen et al. Reference Wen, Gu, Wang, Lü and Zhong2015).
Our gap analysis suggested that current conservation effort for Reeves’s Pheasant at the study area is not sufficient and not effective. A great mismatch existed between the locations of suitable habitat and the placement of NNRs for Reeves’s Pheasant. Less than 15% of the area of NNRs was located in the eastern part of the Reeves’s Pheasant distribution, while nearly half of the suitable habitat was situated in the eastern part of the distribution. Compared to western part of the range, the habitat in the eastern part is more suitable for many forest birds, but the NNRs in the east are smaller and more dispersed (Wen et al. Reference Wen, Gu, Wang, Lü and Zhong2015). The small size and poor connectivity among the NNRs provide poor habitat conditions and ineffective protection, particularly for those species with larger home ranges.
Effectiveness of the NNR functional zones
The percentage of suitable habitat for Reeves’s Pheasant within NNRs on average was the lowest in the buffer zone in this study, which is against our expectation that the experimental zone with the greatest human disturbance should have the lowest available suitable habitat. This conclusion is consistent with findings by other researchers (e.g. in Hubei Dabieshan NNR), where the abundance of Reeves’s Pheasant was higher in the experimental zone than that in the buffer zone (Xu et al. Reference Xu, Zhang, Zhang, Zheng, Ruan and Zhang2005, Zheng Reference Zheng2015). This might suggest that the Reeves’s Pheasant survives relatively well in habitats with some degree of human intervention, similar to Brown-eared Pheasant (Xu et al. Reference Xu, Zhang, Zhang, Zheng, Ruan and Zhang2005, Zhou et al. Reference Zhou, Zhao, Connelly, Li and Xu2017, Song et al. Reference Song, Mi, Yang, Sun, Sun and Xu2020). On the other hand, habitat in the buffer zone may not be as pristine as the core zone (Xu et al. Reference Xu, Zhang, Zheng, Zhang, Sun and McGowan2007). The core zone is characterized by well-preserved natural ecosystems that constitute suitable habitats for rare and endangered species. However, during the establishment of the functional zoning, many NRs in China lacked scientific baseline data, such as the type and available habitat, distribution and abundance of target species, and the level and type of human disturbance (Xu et al. Reference Xu, Li, Pimm, Hull, Zhang, Zhang, Xiao, Zheng and Ouyang2016). The arbitrary division based on experience has led to a mismatch in the conservation effort and the needs of the target species such as Reeves’s Pheasant in some NNRs. The areas that constitute suitable or important habitat for endangered species might be excluded from the core zones and classified as experimental and buffer zones, with potentially negative effects on species conservation, and thus on the overall conservation effectiveness of nature reserves (Xu et al. Reference Xu, Vina, Qi, Ouyang, Liu, Liu and Wan2014).
Management implications
Our research assessed the relationship between the distribution of suitable habitat and nature reserve networks and showed gaps for effective conservation of Reeves’s Pheasant. In addition to the effort to protect more suitable habitat, connectivity has been highlighted as a biodiversity conservation priority to improve habitat integrity and reduce target species vulnerability (Li et al. Reference Li, Cui, Qiu, Ding and Batool2016, Xu et al. Reference Xu, Xiao, Zhang, Yang, Zhang, Hull, Wang, Zheng, Liu, Polasky, Jiang, Xiao, Shi, Rao, Lu, Wang, Daily and Ouyang2017). The government of China has adopted a policy to enhance the connectivity of existing NNRs by using national parks as the main structure to break the ‘man-made boundary’ of individual NNRs (Duan and Yang Reference Duan and Yang2020). The approach also includes expanding protected natural area system with new NNRs (Quan et al. Reference Quan, Ouyang, Xu and Miao2011, Xu et al. Reference Xu, Pimm, Du, Su, Fan, An, Liu and Ouyang2019), integrating surrounding protected areas (Xu et al. Reference Xu, Xiao, Zhang, Yang, Zhang, Hull, Wang, Zheng, Liu, Polasky, Jiang, Xiao, Shi, Rao, Lu, Wang, Daily and Ouyang2017, 2019), restoring habitats, and establishing ecological corridors (Doko et al. Reference Doko, Fukui, Kooiman, Toxopeus, Ichinose, Chen and Skidmore2011).
Establishing ecological corridors have been successful in protecting the threatened giant panda (Lu et al. Reference Lu, Li, Wang and Xu2019) and Marco Polo sheep Ovis ammon polii (Chen et al. Reference Chen, Li, Wang, Qamer, Wang, Yang, Wang and Yang2019), and a similar approach could be applied to other endangered species such as the Reeves’s Pheasant. We recommend establishing three ecological corridors (Figure 2). Ecological corridor 1 can be established between Henan and Shaanxi provinces for the two disjointed populations in the west and east by creating new NNRs in the gaps to improve the conservation effectiveness for Reeves’s Pheasant and associated species. The establishment of ecological corridor 1 is at a large scale to strengthen the connectivity and integrity of the eastern region dominated by forest cover and the western region dominated by karst landforms, and to improve the regional ecosystem service function as a whole. Ecological corridor 2 may be established in the western region. Fragmentation in this area is widespread, but the vegetation suitable for Reeves’s Pheasant is slowly recovering through the conservation efforts (NFGA 2021a). Ecological corridor 3 may be established in the eastern region. This area has a concentrated distribution area of Reeves’s Pheasant, but there is a trend towards fragmentation (Tian et al. Reference Tian, Xu and Wang2020). The area is dominated by forest, and the establishment of ecological corridors can increase concealment and habitat suitability. Ecological corridors 2 and 3 are on a small scale, away from areas with intensive human activities and the corridor distance is short so that species can cross in a short time (Xiao and Wang Reference Xiao and Wang2015). In 2019, the Chinese government enacted a series of measures to better protect species and habitats, including the establishment of ecological corridors (NFGA 2019). It is believed that by establishing ecological corridor, the habitat of Reeves’s Pheasant will be greatly improved in the future.
Given the increasing impact of human activities and climate change, well managed and protected NRs will become increasingly important for the maintenance of biodiversity and healthy ecosystems, upon which human well-being depends (Ma et al. Reference Ma, Chen, Melville, Fan, Liu, Dong, Tan, Cheng, Fuller, Xiao and Li2019). Although further studies of distributions and gap analysis based on multiple species are warranted, we believe that the gap analysis approach adopted by our study can be applied to other species and areas for identifying conservation needs and increasing the effectiveness of protection for the species concerned.
Supplementary Materials
To view supplementary material for this article, please visit http://doi.org/10.1017/S095927092100023X.
Acknowledgements
We thank the Forestry Departments of Anhui, Henan, Hubei, Guizhou, and Shaanxi Provinces for granting permissions and support for the surveys, and the local residents, the National Nature Reserves and state forest farms located in the Dabie Mountains for their support in field work. We would like to thank Dr. Emily Drummond at the University of British Columbia for her editing of the manuscript. We also thank Dr. Chunfa Zhou, Mr. Yuze Zhao, Mr. Jing Ma, Miss Jiajun Wu and Miss Dan Hou for their help with data collection, and Miss Chengcheng Zhang, Miss Hongyan Yao and Mr. Qian Hu for the data analysis. This research was supported by the National Natural Science Foundation of China (31872240, 31672319), the Monitoring and Assessment Project of Ministry of Ecology and Environment, China (2019HB2096001006), and the National Key Programme of Research and Development, Ministry of Science and Technology (2016YFC0503200).


