


Introduction
Agroecosystems are normally composed of interacting dynamic systems including managed agricultural land and unmanaged natural vegetation. Ecotones, the transitional areas between two different ecosystems, are unique because they usually possess physical characteristics and species from both bordering ecosystems. The field margin ecotone may be one of the most important aspects of farm landscapes for wildlife, insect and plant conservation, potentially contributing more to support biodiversity than either of the two bordering ecosystemsReference Powers and McSorley1.
Field margins (managed and unmanaged) are the most common natural habitat on farms (Fig. 1). They may be composed of a boundary zone, margin strip and farm track (if present), and the field and crop edgesReference Marshall and Moonen2. Boundary areas can include fallow fields undergoing plant succession, ditch systems, forests, fencerows, streams or formal hedgerows.

Figure 1. Principal components of field margins.
On farms, field margins provide increased biodiversity, structural diversity, habitat for wildlife and beneficial insects, and can act as protective buffers against agrochemical driftReference O'Connor, Way and Greig-Smith3–Reference Marshall8. Nevertheless, farmers are reluctant to leave natural vegetation, and these areas have been declining over the last several decades, largely due to agricultural intensification. Contemporary farmers are cultivating larger fields and thus reducing the total area of field margins. Also, the use of synthetic fertilizers and pesticides has been found to significantly affect species richness and abundance in field marginsReference Marshall8, Reference Kleijn and Verbeek9.
Farmers have often viewed field margins as reservoirs for weeds, insect pests and diseasesReference Kleijn5, Reference Marshall8, Reference Marshall10. Some empirical studies have shown that weeds occur at highest densities in the crop edge, and it was assumed that this high abundance was due to field margin weeds invading adjacent crop landReference Marshall10, Reference Wilson and Aebischer11. Investigations conducted to determine if and how weeds invade crop fields from the field marginReference Theaker, Boatman and Froud-Williams12 found a strong association between allele frequencies of Bromus sterilis species in field margins and in adjacent crop fields, indicating that the populations were genetically similar and suggesting that field margins contributed weeds to the crop field. In mid-western USA, Sosnoskie et al.Reference Sosnoskie, Luschei and Fanning13 found that elevation gradient and field shape were important factors not under the direct control of farmers that influence weed species diversity in field margins. In Canada, Boutin et al.Reference Boutin, Jobin, Bélanger and Choinère14 reported that management practices of hedgerows and adjacent crop fields were mostly responsible for the abundance of weeds in hedgerows and field margins. Natural hedgerows contained many non-weedy, perennial plant species, while in planted hedgerows about 50% of the plant species were weedsReference Boutin, Jobin, Bélanger and Choinère14.
In the last century, the practice of ‘clean farming’ was thought to be a remedy for the perceived dangers of leaving natural vegetation in the ‘farmscape’. Weed management in the field edge can be time consuming and expensive for farmers who may not have the proper equipment, such as specialized mowers and sprayers, to manage themReference Kleijn5. Also, it has been suggested that more intensive management can actually lead to exacerbating the weed problem. Most agronomic weeds are successful colonizers, and so regular disturbance of the field margin may increase weed abundanceReference Wilcox, Perry, Boatman and Chaney15.
Field margin research: implications for agriculture in southern USA
Most field margin research has been conducted in western Europe, and so data for North American ‘farmscapes’ are scarce and little or no data are available pertaining to southeastern USA. The goal of our research was to assess the relationship between plant assemblages occurring in unmanaged margin strips and areas of natural vegetation and the populations of weedy plant species in neighboring crop fields. While European research has focused on field margins with formal hedgerows as the boundary, our research examined boundary areas of natural vegetation more common in southeastern USA (fallow fields, ditch systems and neighboring forest). These field margins were compared with those where the margin strip was regularly managed (by mowing or herbicide application) and the boundary was shared by another crop field.
Our objectives focused on conditions common to many farms in southeastern USA, but were specifically applied to conditions at the Center for Environmental Farming Systems (CEFS). Over the last several years, farm staff and researchers have conjectured as to whether boundary areas of natural vegetation on the farm (especially the old field successions) were contributing weeds to the adjacent crop fields. We wanted to examine the general hypothesis that more weeds are present in crop field edges, because they are present in field margins and specifically to assess: (1) if crop edges adjacent to unmanaged field margins are associated with higher weed species richness and abundance than crop edges bordering managed areas; (2) how weeds are distributed in crop fields with respect to distance from the field edge; and (3) whether the presence of weedy species in the field margins and boundary areas can be used to predict weed levels occurring in these areas and the presence of the same species in the crop field.
A clearer understanding of the relationship between plants in the field margin and weeds in the crop field will help in the development of management recommendations for control of potential pest problems originating in the ecotone between natural and managed ecosystems.
Materials and Methods
Research site
Research was conducted in the Farming Systems Research Unit (FSRU) at the CEFS near Goldsboro, NCReference Mueller, Barbercheck, Bell, Brownie, Creamer, Hitt, Hu, King, Linker, Louws, Marlow, Marra, Raczkowski, Susko and Wagger16. The CEFS is located (35.4 north latitude, 78.1 west longitude, 41 m above sea level) within one of the major river systems of North Carolina. The Koppen climate classification is Cfa, humid, subtropical. Soils are mainly Ultisols with considerable variation in type and distribution. The dominant soil type within each replication (diagnostic soil) was either Wickham (fine-loamy, mixed, semiactive and thermic Typic Hapludult) or Tarboro (mixed, thermic and Typic Udipsamment). The design at the FSRU is a randomized complete block with three replications of five farming systems. The agricultural production systems include a conventional system with best management practices (BMP) currently used by farmers, an integrated crop and animal system and an organic system. The two remaining systems are a successional ecosystem (old field succession) and a plantation forestry/woodlot system of commercially valued forest speciesReference Boutin, Jobin, Bélanger and Choinère14. The successional areas had been fallowed since the winter of 1998 when they were planted to a rye (Secale cereale L.) cover crop. The experimental site was approximately 81 ha with individual fields ranging in size from 0.8 to 4 ha. Some of the fields on the FSRU are bounded by forest. The FSRU is also drained by a large ditch system.
Field selection and sampling procedure
Four fields were selected in the FSRU bounded by a large area of natural vegetation (old field succession, ditch system, or forest) on one side and adjoined a crop field on the other side—thus representing two types of field margins (‘unmanaged’ and ‘managed’, respectively). Each rectangular field was greater than or equal to 1.5 ha. Two more fields were selected that contained only one of the above field margins. One field had an unmanaged boundary and an unmanaged margin strip; the other field ran parallel to a managed boundary and had a managed margin strip. In all, ten field margins were selected for study: five along unmanaged margins and five along managed margins. Field histories for these fields beginning in 1999, when the FSRU was initiated are presented in Table 1.
Table 1. Field histories of fields selected for data collection at the FSRU of the CEFS, Goldsboro, NC.
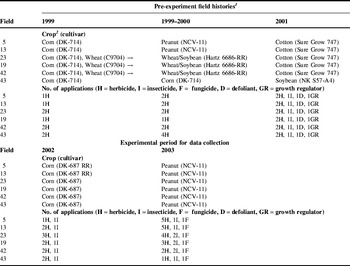
1 Cultural practices: Limestone and fertilizer applied according to soil test recommendations.
Tillage: In 1999, all fields received pre-plant disk, chisel and field conditioning. Field 5 received 1 in-row cultivation post-plant.
In 2000, fields 5 and 13 were disked and chisel plowed prior to planting, whereas the remaining fields disked and field conditioned.
Field 43 also received one in-row post-plant cultivation.
In 2001, all fields were disked, chisel plowed and field conditioned prior to planting.
Fields in corn in 2002 were disked prior to planting. In 2003, fields were disked and bedded for peanut and received one in-row cultivation.
2 Crops:Zea mays L., Triticum aestivum L., Glycine max (L.) Merr., Arachis hypogaea L., Gossypium hirsutum L.
Perpendicular to each of the ten field margins, five permanent transects spaced 10 m apart were established with sampling points set at 1, 3, 7, 15, 30 and 50 m from the field edgeReference Marshall and Moonen2 (Fig. 2). At each sampling point, a 0.30×0.75 m quadrat was placed perpendicular to the row closest to the transect point and on the neighboring row on each side. Numbers of each weed species were recorded (i.e., three quadrat observations at each transect point). These observations were later combined resulting in a measured area of 0.675 m2.

Figure 2. Diagram of field sampling points in crop fields and field margins at the FSRU of the CEFS, Goldsboro, NC, 2002–2003.
Field margin vegetation
Farm tracks between crop fields were mowed (or in previous years sprayed with nicosulfuron applied at 1.68 kg [ai] ha−1) 2–3 times per season. Margin strips between unmanaged boundaries and crop fields were allowed to grow unrestricted for the duration of the cropping season. After crop harvest, these areas were mowed to the edge of the boundary.
In addition to the aforementioned sampling points in the crop fields, transects were extended away from the crop field and into the margin strips and boundaries. Additional sampling points were set at −2.5, −5 and −8 m from the field edge to the margin strip and boundary (Fig. 2). These distances allowed observations to be made in the center of the farm track, inside the unmanaged boundary area and well inside the unmanaged boundary. For managed margins, observations were taken at the center of the farm track. At each of these points, a 0.75 m2 quadrat was used in collecting species richness as presence/absence data.
Field management and sampling dates
Within each year, all fields were planted with the same crop under conventional tillage practices. Maize (Zea mays L.) was planted in 2002 and peanut (Arachis hypogaea L.) in 2003. Herbicides were neither used prior to spring sampling dates nor for at least 6 weeks before the fall sampling date (Table 1). This procedure allowed spring weeds to germinate and be counted before any herbicides were applied and permitted sufficient time (6 weeks) from application to the fall count in September so that residual effects of the herbicides applied earlier had disappeared.
On April 17, 2002, Dekalb 687 Round-Up Ready®maize was planted in conventional-till, BMP fields on 0.76 m rows. On May 6–7, fields were censused for weed abundance and species richness and data were collected in each margin type and transect. Herbicide (glyphosate) was applied on May 8. No herbicides were applied to the fields after May 23. Maize was harvested on September 7–9, 2002 and transect data were collected again 2 weeks after harvest on September 21–22.
In 2003, fields were disked on April 10 and 3 weeks later on May 1–2 fields were sampled for weed abundance and species richness with no crop present in the field. Sampling in 2003 was scheduled to complete counts before peanut fields were to be planted and sprayed with the pre-emergence herbicide metolachlor. After all counts had been made, peanuts were planted and sprayed during the first week of June in raised beds on 0.97 m rows. No fields received herbicide application after July 8, 2003. Transect data were sampled again on September 7–8, 2003, just before the peanut canopy had completely closed over the rows.
Statistical analysis
Weed species abundance was compiled by the field, margin type (managed or unmanaged), transect, distance from the field edge and sampling date. The total counts for all species were analyzed using a stripped split-plot analysis of variance with PROC GLM17 on square root transformed data. Because of the different histories, fields were treated as levels of a fixed factor, so that conclusions are limited to the fields used in this study. Thus, the field and margin type were whole plot factors, with transects providing replication within each field by margin combination. Distance from the field edge was the subplot factor and date was treated as stripped across other factors. Mixed model F Tests were obtained by including a RANDOM statement with transects within field and margin type, distance by transect in field and margin type and date by transect in field and margin type.
Data sets were summarized by margin type and date, and nine dominant species were selected for further individual analysis: Amaranthus retroflexus L., Urochloa platyphylla (Munro ex C. Wright) R.D. Webster, Cyperus esculentus L., Digitaria sanguinalis (L. Scop.), Ipomoea spp., Lamium amplexicaule L., Mollugo verticilliata L., Senna obtusifolia L. and Sida spinosa L. No attempt was made to differentiate between Ipomeoa species. Dominant species were chosen based on abundance, consistent presence for both margin types and consistent presence over sampling dates. Similar analysis of variances (ANOVAs) were carried out on square root transformed counts for each dominant species.
Species richness (the total number of species encountered in a sample) was determined for weed species in the crop field and for plants found in the field margin and results were analyzed with PROC GLM. ANOVA on species richness was carried out separately for the crop field and field margin. Data for species richness and abundance for weeds in the crop field were then combined into two distances: near the field edge (including distances of 1, 3 and 7 m sampling points) and near the field center (15, 30 and 50 m sampling points). Shannon's species diversity indexReference Spellerberg and Fedor18 (relationship between the number of species and number of individuals) was calculated from transect data in each of the two crop field regions (field edge and field center) and values were analyzed according to the stripped split-plot ANOVA.
To determine whether an association existed between weeds appearing in the field margin and presence in the crop field, for each species, weed abundance in the crop field for each transect was converted to presence/absence data and paired with presence/absence data from the field margins. A 2×2 contingency table for paired binary data was generated using PROC FREQ17 by year and margin type for each species, and an exact two-sided test was used to test for an association between the two areas.
Data for each dominant weed species, combined across sampling dates within a year were used to test if margin type or presence in the field margin were predictors of presence of the weed in the crop field. Logistic regression using PROC GENMOD17 tested the importance of the predictors: field, margin type, presence in the field margin and year. Reduced models were chosen for each species when appropriate.
Results
Total weed abundance
With the exception of margin type, differences were observed among main effects. Nevertheless, a number of interactions were evident among the main effects (Table 2). Interactions involving field and sampling date were present and were to be expected because of specific site and management histories of individual fields and due to the variation caused by annual and seasonal effects. The most important interaction was between margin type and distance in the crop field from the field edge.
Table 2. Sources of variance for total weed abundance in crop fields at FSRU of the CEFS, Goldsboro, NC.

** Significant at 0.01 level of probability.
*** Significant at 0.001 level of probability.
NS, non-significant.
Although a significant interaction between margin type and distance from field edge was observed; the cause was due to the abundance of a particular weed species [U. platyphylla (Munro ex C. Wright) R.D. Webster] in one field with an unmanaged margin across all five transects at 15 m. In general, the total weed abundance for both managed and unmanaged margin types was observed to be greatest near the field edge and declined toward the center of the crop field (Fig. 3).

Figure 3. Density of total weed abundance by distance from the field edge for managed and unmanaged field margins across sampling dates (P<0.001) at the FSRU of the CEFS, Goldsboro, NC, 2002–2003. Data were square root transformed for analysis and means were back-transformed for presentation.
Field margin species richness and diversity
Over both years, approximately 65% of weeds were from the spring (May) sampling dates. In May 2002, 80 plant species were found in field margins; however, only 21 of those species appeared in a crop field as a weed, representing 26.3% of total species. The results were similar for 2003: of the 73 plant species found in the field margin, only 18, or 24.6%, were found as weedy species in a crop field at the spring sampling date. At least 74% of species in the field margin were not present in the crop fields surveyed. Across all sampling dates, a total of 105 plant species were identified in the field margins. Of these 105 species, 42 were found in the crop field representing 40% of total species sampled.
Species richness for weeds in the crop field along the two field margin types differed (P=0.05). Crop fields (Fig. 4) adjoining managed field margins contained a greater mean number of weed species (7.4) than those adjoining unmanaged margins (6.6). However, the number of weed species found along field margins (Fig. 4) for unmanaged (14.7) field margins was more than double that for managed (5.8) field margins (P=0.002).

Figure 4. Species richness in crop fields and field margins for managed and unmanaged field margins at the FSRU of the Center for Environmental Farming Systems, Goldsboro, NC, 2002–2003.
Shannon's species diversity index returned similar results (data not shown). A significant distance by margin interaction (P=0.002) result was detected, because diversity index means (H) were highest at the field edge (1.01), lowest in the field center (0.78) for the unmanaged field margin and similar (0.9 for both) at these two locations in the managed field margin.
Dominant species in the crop field
Nine dominant species were chosen for further individual analysis because these weeds tended to be the most common weeds at the CEFS. Of particular interest were A. retroflexus L. and U. platyphylla (Munro ex C. Wright) R.D. Webster, because these were most numerous and consistently present across all sampling dates. These nine dominant weeds constituted 84% of all weeds counted and of these nine, four species, A. retroflexus L., U. platyphylla (Munro ex C. Wright) R.D. Webster, C. esculentus L., D. sanguinalis L. and M. verticilliata L., comprised 80%.
Similar to the analysis for total weed abundance, numerous interactions between main effects were observed for the nine dominant weed species (Table 3). As previously mentioned for total weed abundance, the interactions involving field and sampling date were expected due to the nature of specific field histories and seasonal fluctuations. The significant interaction of most interest was that involving margin type and distance from the field edge. Six of the nine dominant species had significant interactions between margin type and distance while three species, C. esculentus, Ipomea spp. and S. spinosa L., were non-significant for the aforementioned interaction.
Table 3. Sources of variance for dominant weed species in the crop fields at the FSRU of the CEFS, Goldsboro, NC.

1 Bayer code: AMARE (A. retroflexus L.), URPL2 [U. platyphylla (Munro ex C. Wright) R.D. Webster], CYPES (C. esculentus L.), DIGSA [D. sanguinalis (L. Scop.)], IPOHSPP (Ipomoea spp.), LAMAM (L. amplexicaule L.), MOLVE (M. verticilliata L.), CASOB (S. obtusifolia L.) and SIDSP (S. spinosa L.).
NS, non-significant.
* Significant 0.05 level of probability.
** Significant 0.01 level of probability.
*** Significant 0.001 level of probability.
Within the first 7 m of the field edge A. retroflexus L., U. platyphylla (Munro ex C. Wright) R.D. Webster, D. sanguinalis L. and Mollugo verticillata L. were the most dominant weeds (Fig. 5). These four species and C. esculentus (data not shown) had lowest numbers toward the field center for both margin types. The remaining four species had variable distributions throughout the fields. For example, L. amplexicaule L. and S. obtusifolia L. (results not shown) had more weeds toward the center than at field edges. There was no clear pattern among these weed species with regard to distributions by field margin types. Amarathus retroflexus L. (Fig. 5) associated with managed field margins tended to have significantly higher numbers near the field margins and in the field center than the same species associated with unmanaged field margins. However, D. sanguinalis (Fig. 5) numbers did not differ toward the field center for both margin types.

Figure 5. Mean densities of U. platyphylla (Munro ex C. Wright) R.D. Webster; A. retroflexus L.; M. verticilliata L.; and D. sanguinalis (L.; Scop.) by distance from the field edge for managed and unmanaged field margins at the FSRU of the CEFS, Goldsboro, NC, 2002–2003. Data were square root transformed for analysis and means were back-transformed for presentation.
Association between weeds in the field margin and presence in the crop field
Because many of the species in the field margin were not found in the crop fields and because not all weedy species were found in the field margin, only a fraction of the total species generated 2×2 frequency tables with a majority of non-zero cells. They included: U. platyphylla (Munro ex C. Wright) R.D. Webster, A. retroflexus L., S. spinosa L., C. esculentus L. and D. sanguinalis L.
No associations were found for any of the tested species, except for D. sanguinalis (data not shown) for both managed and unmanaged margin types in 2003 (P=0.072 and P=0.017, respectively). Nevertheless, the association was not consistent over margin types, seasons or years.
Predictive power of presence in field margins
Logistic regression did not produce estimates or P-values for M. verticillata L., Ipomea spp., or L. amplexicaule L. due to large numbers of samples where these species were absent. For U. platyphylla (Munro ex C. Wright) R.D. Webster, S. obtusifolia L., D. sanguinalis L., C. esculentus L., S. spinosa L. and A. retroflexus L., field (P=0.05–0.001) was the only significant predictor of the weed appearing in the crop field (data not shown).
Discussion
Weed species abundance, richness and diversity in crop fields
The pattern of total weed abundance encountered was consistent with previous European researchReference Marshall10, Reference Wilson and Aebischer11 in which weed abundance was highest near the field edge and declined (or disappeared) as distance from the field margin increased. Abundance was similar between the two margin types with the exception of the 15 m distance from the field edge (Fig. 3). The obvious source of the interaction was a large, isolated population of U. platyphylla (Munro ex C. Wright) R.D. Webster about 15 m from the unmanaged margin in one field (Fig. 5). It was determined that crop rows approximately 15 m from the field edge may not have received herbicide applications in a previous year, resulting in an abundance of U. platyphylla (Munro ex C. Wright) R.D. Webster is this zone during the years of our study. This interaction between distance and margin type is most likely an anomaly.
Although the number of weed species found in crop fields associated with managed field margins was greater than for unmanaged field margins, it is not clear that this small difference is biologically relevant (Fig. 4). On the other hand, the fact that the number of plant species found in the margins of the unmanaged treatments was more than double that occurring in margins in the managed treatments seems logical, because a large proportion of these species (74%) did not occur as weeds in crop fields.
The significant interaction of field margin type with distance observed for Shannon's species diversity index was most likely associated with the presence of more non-weedy species occurring in the unmanaged field margins compared with the managed field margins. High levels of disturbance in the managed field margins could also have been a contributing factor.
Dominant weed species in the crop field
Although total weed abundance and its association with margin types and distances from the field edges are important considerations, weed species clearly differ in their response to such factors and thus it is perhaps more important to understand these weed-specific responses. This is particularly important with regard to the most competitive and difficult-to-control species. For example, with both margin types, A. retroflexus L. and U. platyphylla (Munro ex C. Wright) R.D. Webster had the highest number of weeds at the crop edge within the first 7 m and the lowest numbers of weeds toward the center of the field (Fig. 5). Because these two weed species had the highest total abundance (50%) of all the dominant species, these were likely the cause of the overall total weed abundance trend. Other species were lower in total abundance and had varying distributions across the field (data not shown).
Field margin species richness
Results from this experiment are consistent with earlier observationsReference Marshall10 in which 20–40% of field margin species were weedy species that commonly occurred in cultivated fields and at least 60% of plant species were found in the field margin only (i.e., not found in the cultivated field). Therefore, a majority of the plant species found in the field margin would not be considered weedy or threats to crop performance. Moreover, only a few species of weeds out of the entire assemblage were most problematic to crop production and these dominant species tended to be present regardless of margin type (Fig. 5).
Unmanaged field margins could provide higher conservation and habitat potential than managed field margins. Joenje and KleijnReference Joenje and Kleijn19 postulated that, for a newly established field margin, species richness would be high initially, followed by a period of moderate diversity and then an increase in species richness over time. KleijnReference Kleijn5 maintains that high plant species diversity is directly related to high insect diversity and low herbivore/predator ratios and that these areas can act as ecosystem regulators of insect pest problems and perhaps reduce the need for agrochemicals in the crop field. Therefore, as field margins continue to increase in plant species richness, conservation and habitat potential are expected to increase.
Association between weeds in the field margin and presence in the crop field
The association of field margins with D. sanguinalis was not predictive, and the direction of the relationship was not consistent over margin types or over sampling years. Wilcox et al.Reference Wilcox, Perry, Boatman and Chaney15 found a non-linear relationship between crop yield and weed biomass with respect to distance from the field edge, and suggested that weed competition alone could not be responsible for reduced yield in the crop edge because when yield was adjusted for weed biomass, there was still evidence of a distance effect. This suggests that other factors such as soil compaction, non-uniform application of herbicide and fertilizer could help explain reduced crop performance. They also suggest that high weed biomass in these areas may be a result of poor crop performance. Although it is possible that some individual plants of weed species in our study originated from the field margin, any perceived threat posed by unmanaged margins (compared with managed margins) appears to be unfounded.
Predictive power of presence in field margins
The field and year were effective predictors only for D. sanguinalis L. (P=0.001 and 0.01, respectively) and C. esculentus L. (P=0.05 and 0.03, respectively) appearing as weeds in the crop field. Our analysis indicated field as an appropriate predictor of the weed occurring in the crop field for most weed species. This is understandable considering that individual field histories and knowledge of past weed populations are very important when predicting what weeds will occur the following year and determining which management tactics to use. For most species, the factors of greatest interest to this research, presence in the field margin and margin type, were not associated with presence of the weed in the crop field.
Blumenthal and JordanReference Blumenthal and Jordan20 suggested that because the number of weeds considered most competitive with crops is so limited, it may be possible to reduce disturbance of natural habitats without negative consequences to the adjacent crop.
We realize that different field histories and data from a single location limit broad inferences of our data. Nevertheless, results for the fields in our study support the hypothesis that, in general, more weeds appear near the crop edge than field center, but probably not because they are present in the field margin. We argue that this occurrence is more likely because crop edges tend to be managed differently than the rest of the crop field. As fields are prepared for planting, different levels of cultivation, herbicide and fertilizer application are found at the outer edges of the field versus within the fieldReference Marshall and Moonen2. This research supports the hypothesis that natural and semi-natural habitats in the farm landscape are not necessarily associated with weed contamination of adjacent crop fields, suggesting that farms should be managed on landscape as well as field levels.


