Introduction
Indium is a critical metal that is of high demand in high-tech industries. It is used worldwide for the production of flat-panel displays and touchscreens, in the manufacture of photovoltaic cells and fibre-optics, and other important industrial applications (Mercer, Reference Mercer2015). The global primary production of In almost doubled during 2001–2011 and reached 759 t in 2015 and 655 t in 2016 (Tolchin, Reference Tolcin2017). The concentration of In in natural environments is low and In minerals are rare. Instead, it is concentrated in the principal sulfide ore-forming minerals with sphalerite being the most important (Schwarz-Schampera, Reference Schwarz-Schampera and Gunn2014). The In content in sphalerite is usually between 0.1 and 100 ppm, but can reach several wt.% in minerals formed at temperatures between 400 and 725°C in volcanic fumaroles (Chaplygin et al., Reference Chaplygin, Mozgova, Mokhov, Koporulina, Bernardt and Bryzgalov2007), or in association with roquesite (CuInS2) in hydrothermal ores subjected to recrystallisation during metamorphic events (Burke and Kieft, Reference Burke and Kieft1980). Commonly the concentration of In directly correlates with the concentration of Cu, which implies the formation of a solid solution by the coupled substitution mechanism 2Zn2+↔Cu++In3+ (e.g. Johan, Reference Johan1988; Chaplygin et al., Reference Chaplygin, Mozgova, Mokhov, Koporulina, Bernardt and Bryzgalov2007; Cook et al., Reference Cook, Ciobanu, Pring, Skinner, Shimizu, Danyushevsky and Melcher2009).
Indium is obtained as a by-product of mining and beneficiation of Zn ore. The most significant sources of In are sulfidic Zn and Zn–Cu ores of volcanogenic base-metal sulfide (VMS) deposits (Mercer, Reference Mercer2015; Schwarz-Schampera, Reference Schwarz-Schampera and Gunn2014). Many of these deposits and their modern analogues – ores of submarine hydrothermal fields – contain Au in large amounts (Bortnikov et al., Reference Bortnikov, Cabri, Vikentiev, Tagirov, Mc Mahon, Bogdanov and Stavrova2003; Melekestseva et al., Reference Melekestseva, Maslennikov, Tret'yakov, Nimis, Beltenev, Rozhdestvenskaya, Maslennikova, Belogub, Danyushevsky, Large, Yuminov and Sadykov2017). Some VMS deposits belong to world-class gold mines with more than 100 t Au (e.g. Mercier-Langevin et al., Reference Mercier-Langevin, Hannington, Dubé and Bécu2011; Vikentyev et al., Reference Vikentyev, Yudovskaya, Mokhov, Kerzin and Tsepin2004, Reference Vikentyev2015). Determination of Au concentration in submarine polymetallic sulfide ores from the Valu Fa Ridge (the Lau basin, South-West Pacific) has showed that the Au-bearing assemblages are dominated by Fe-poor sphalerite (Herzig et al., Reference Herzig, Hannington, Fouquet, von Stackelberg and Petersen1993). The content of gold in sphalerites of Ural VMS deposits varies between a few ppm and a few tens of ppm (Vikentyev, Reference Vikentyev2015). Thus, In, Cu and Au can be extracted as main (Cu) or by-product (In, Au) commodities from sphalerite-bearing sulfide ores.
Investigations of spectroscopic properties of pure and doped ZnS is mostly driven by the strive to produce technical applications of these materials (c.f., Yen and Weber, Reference Yen and Weber2004; Schnorr, 2015). Recently, doped semiconductor nanocrystals (quantum dots) have drawn significant attention due to their unique electronic and optical properties (Norris et al., Reference Norris, Efros and Erwin2008). Apple and Williams (Reference Apple and Williams1959) and Koelmans (Reference Koelmans1960) synthesised and studied ZnS phosphors activated with In and group 11 metals (Ag, Cu). It was suggested that the formation of In-bearing hexagonal ZnS (wurtzite) requires the formation of a vacancy in the cationic sublattice: 3Zn2+↔2In3+ + □ (Koelmans, Reference Koelmans1960). Incorporation of In resulted in a substantial increase of the ZnS lattice constants which confirmed the solid-solution formation. However, slow cooling from the synthesis temperature, or reheating to T > 600°C, removed fluorescence of the material. The lattice spacings of annealed samples were found to be equal to those of pure ZnS. An association between the charged In3+ ion and the vacancy in the cationic sublattice was suggested to cause the emission drop and the lattice constants decrease. Therefore, the suggested charge compensation scheme seems to be valid only when In-bearing ZnS is rapidly quenched from the formation (synthesis) temperature, whereas slow cooling or reheating (metamorphism) of natural ores results in redistribution of impurities. Note that the coupled Cu–In substitution is not a required condition for the formation of In-bearing sphalerites because both Cu- and In-bearing ZnS materials have been synthesised separately for technical applications.
The phase relations and cationic substitution mechanisms in the system ZnS–CuInS2 were studied by X-ray and neutron diffraction in Schorr and Wagner (Reference Schorr and Wagner2005), Schorr et al. (Reference Schorr, Tovar, Stuesser, Sheptyakov and Geandier2006), and references therein. It was determined that Cu and In form a partial binary solid solution Zn2x(CuIn)1–xS2 with a miscibility gap in the region 0.1 ≤ x ≤ 0.4 (in other words, the miscibility gap extends from Zn0.2(CuIn)0.9S2 to Zn0.8(CuIn)0.6S2). In the region indicated the Zn-rich cubic phase coexists with tetragonal Cu and an In-rich phase, which occurs in the form of tetragonal domains (x ≈ 0.1) in the cubic matrix (x ≈ 0.4). These data indicate that natural Cu–In-bearing sphalerite represents a solid solution which crystallises in the cubic sphalerite-type structure, and confirm the 2Zn↔(Cu + In) substitution scheme.
The atomic and electronic structures of synthetic sphalerites doped with Mn, Fe, Co and Ni were studied using X-ray absorption spectroscopy (XAS) by Ławniczak-Jabłońska and Gołacki (Reference Ławniczak-Jabłońska and Gołacki1994), Ławniczak-Jabłońska et al. (Reference Ławniczak-Jabłońska, Iwanowski, Gołacki, Traverse, Pizzini and Fontaine1995, Reference Ławniczak-Jabłońska, Iwanowski, Gołacki, Traverse, Pizzini, Fontaine and Winter1996) and Iwanowski et al. (Reference Iwanowski and Ławniczak-Jabłońska1996, Reference Iwanowski and Ławniczak-Jabłońska1997, Reference Iwanowski, Ławniczak-Jabłońska, Gołacki and Traverse1998). The authors showed that these impurities are incorporated into the cationic position of the sphalerite lattice, evaluated the metal-to-ligand distances in the doped sulfide, and calculated covalent radii of the dopants in a tetrahedral environment. Pattrick et al. (Reference Pattrick, Mosselmans and Charnock1998) studied the local atomic structure of sphalerites doped with Mn, Cu/In and Cd. The concentration of CuInS2 in synthesised sphalerites was 8–20 at.%. It was found that these metals are incorporated into the sphalerite cationic sublattice, and the S tetrahedra around Cu are compressed, while around In and other dopants they are expanded. In addition, the authors detected that In/In and Cu/In clustering occurs at these high concentrations of dopants (note that much lower admixture concentrations are pertinent for natural sphalerites). Similar results on the interatomic distances in the first coordination shells of In and Cu were reported in Fieber-Erdmann et al. (Reference Fieber-Erdmann, Rossner, Holub-Krappe, Eyert and Luck1999) where several samples of Zn2x(CuIn)1–xS2 (x = 0.04–1) thin films deposited on soda-lime glass substrates were studied by means of extended X-ray absorption fine structure (EXAFS) spectroscopy.
The local atomic structure of ZnS phosphors doped with Cu and Mn was studied by EXAFS spectroscopy by Warkentin et al. (Reference Warkentin, Bridges, Carter and Anderson2007). An important result of this study is that Mn substitutes for Zn in the cubic ZnS lattice, whereas Cu is present in the ZnS matrix mainly in the form of CuS clusters with only a small fraction of Cu substituting for Zn. The EXAFS data analysis suggests that the CuS clusters are integrated into the ZnS matrix and “do not have a completely random orientation, i.e. there is no any amorphous layer between the CuS-like nanocrystallites and the host crystal” (Warkentin et al., Reference Warkentin, Bridges, Carter and Anderson2007). The formation of CuS nanosized precipitates in the ZnS matrix was confirmed by an EXAFS study of Cu-doped ZnS nanoclusters reported in Corrado et al. (Reference Corrado, Jiang, Oba, Kozina, Bridges and Zhang2009). The XAS studies of trace elements (Ge, Cu and Mn) in natural sphalerites are limited to the X-ray absorption near edge structure (XANES) spectra because of small grain sizes, their zoned character, and low concentration of the admixtures (Cook et al., Reference Cook, Ciobanu, Brugger, Etschmann, Howard, de Jonge, Ryan and Paterson2012, Reference Cook, Etschmann, Ciobanu, Geraki, Howard, Williams, Rae, Pring, Chen, Johannessen and Brugger2015; Belissont et al., Reference Belissont, Muñoz, Boiron, Luais and Mathon2016; Bonnet et al., Reference Bonnet, Cauzid, Testemale, Kieffer, Proux, Lecomte and Bailly2017).
The objective of the present study is to determine the state (local atomic environment, position in the host mineral structure, valence state) of In and the group 11 metals (Cu and Au) in sphalerite, including the possibility of In–In, Au–Au, Au–In and Cu–In clustering in Au–In- and Cu–In-bearing sphalerites. In our recent study of the synthetic analogues of minerals (Tonkacheev et al., Reference Tonkacheev, Chareev, Abramova, Yudovskaya, Minervina and Tagirov2015) we found that, similar to Cu and In, the concentrations of Au and In in sphalerite are directly correlated. In order to determine the properties of In and Au in sphalerite, we introduced these impurities into synthetic pure and Fe-bearing sphalerites and studied the synthesised crystals using XAS. In addition, the other elements which are usually present in natural sphalerites (Mn, Cd and Se) were added to one sample of synthetic Au–In-bearing sphalerite in order to verify if they can affect the state of Au and In. A sample of natural Cu–In-bearing sphalerite (+Cd, Fe and Mn), formed at 725°C in active fumaroles at the Kudriavy volcano (Iturup Island, Russia), was used to study the state of Cu and In using XAS. The use of synthetic Au–In-bearing crystals with elevated concentrations of admixtures enabled us to acquire not only XANES spectra, but to obtain good quality EXAFS results and, as a result, properly characterise the local atomic environment of In and Au. An important advantage of the use of Au, the heaviest group 11 stable atom, is that in the case of Au–In clustering the contribution of the Au atom to the In K-edge EXAFS spectra can be recognised by spectra analysis in contrast to the comparably light atom of Cu, which cannot be discriminated from Zn or Fe. The High Energy Resolution Fluorescence Detection mode was employed (HERFD-XAS, Glatzel and Bergman, Reference Glatzel and Bergman2005) to measure Au-bearing samples. The measurement of HERFD-XANES spectra allowed observation of important spectral features not manifested in Total Fluorescence Yield (TFY) detection (Tagirov et al., Reference Tagirov, Trigub, Kvashnina, Shiryaev, Chareev, Nickolsky, Abramova and Kovalchuk2016; Trigub et al., Reference Trigub, Tagirov, Kvashnina, Chareev, Nickolsky, Shiryaev, Baranova, Kovalchuk and Mokhov2017).
Results of our experiments show that In in sphalerite exists in the solid-solution state. The state of Cu and Au are different: Cu is in the solid solution, whereas Au, despite homogeneous distribution and possibility of charge compensation substitution, mostly forms Au2S clusters with only small fractions of the Au solid solution. The reasons for the contrasting behaviour of the cations are discussed below and applied to interpretation of the state of trace elements in natural Zn ores.
Methods
Methods of synthesis
The crystal growth experiments were performed as described in Chareev et al. (Reference Chareev, Osadchii, Shiryaev, Nekrasov, Koshelev and Osadchii2017) using (1) the gas transport method, and (2) the salt flux technique (KCl/NaCl eutectic mixture, Chareev, Reference Chareev2016, Chareev et al., Reference Chareev, Volkova, Geringer, Koshelev, Nekrasov, Osadchii, Osadchii and Filimonova2016). In the gas transport method NH4Cl was used as a transport agent. The initial phases (~0.5 g of ZnS – commercial ultrapure reagent (wurtzite), with FeS up to 10 wt.%), and, if necessary, several milligrams of MnS, CdS, ZnSe and In2S3 were powdered and loaded into a silica glass ampoule (8 mm ID, 11 mm OD, ~110 mm long) together with Au wire and either ~ 5 mg of transport agent or salt flux which filled the rest of the ampoule volume. The loaded ampoules were evacuated, sealed, and placed into a horizontal tube furnace which was then heated to the synthesis temperature over a period of 2–3 h, and then kept at this temperature for 20–30 days. The temperature gradient in the furnace was 50–100°C, and the measured temperature at the hot end of the ampoules was 850°C. At the end of the experiment the ampoules were quenched in cold water. Sphalerite crystals were deposited at the cold end.
Gold sulfide Au2S(cr) was synthesised by sulfidising an aqueous Au cyanide solution at an ambient temperature as described in Tagirov et al. (Reference Tagirov, Baranova, Zotov, Schott and Bannykh2006).
Analytical methods
The morphology of the synthesised minerals was studied using scanning electron microscopy (SEM), phase compositions were obtained using X-ray diffraction (XRD), chemical composition was determined by means of electron probe micro-analysis (EPMA) and laser ablation inductively coupled mass spectrometry (LA-ICP-MS). The EPMA and LA-ICP-MS analyses were performed on polished sphalerite grains mounted in epoxy. The SEM studies were undertaken using a JSM-5610LV electron microscope equipped with an INCA-450 energy-dispersive spectrometer. EPMA were performed using JEOL JXA-8200 WD/ED combined electron probe microanalyser equipped with five wavelength-dispersive X-ray spectrometers. For Zn, Cu, Fe, Cd, In and S the operating conditions were: 20 kV accelerating voltage, 20 nA beam current and counting time of 10 s. The lines and crystals used were: Zn, Cu and Fe: Kα (LiF crystal); Cd: Lα (PET); In: Lα (PETH); and S: Kα (PETH). Calibration reference materials were: chalcopyrite CuFeS2 (for Fe), pure sphalerite ZnS and greenockite CdS (for Zn, S and Cd), and InSb (for In). The concentration of Au in synthetic sphalerite samples was determined using the LiF crystal accounting for the background dip immediately adjacent to the AuLα line from the short-wavelength side (Self et al. Reference Self, Norrish and Milnes1990). The detection limit (2σ) for Au was 0.01 wt.% at 100 nA beam current and a counting time of 100 s. In the natural sample the PETH crystal and Mα line were used. The detection limit (2σ) for Au was 0.003 wt.% at 300 nA beam current and a counting time of 200 s.
Concentrations of 197Au and 113In isotopes in the synthesised sphalerite crystals, and the distribution modes (homogeneous/inhomogeneous) of Au and In were determined using a New Wave 213 laser (ESi) coupled with the Thermo Scientific X Series 2 quadrupole ICP-MS. The laser pulse frequency was 10 Hz with the power of 6–8 J/cm2 and beam size of 40–60 µm. The analysis was carried out for 30 s preceded by 20 s for the gas blank. The ablation was performed in He + 6% H2 (0.6 L/min) atmosphere. The gas carrying ablated material to the ICP mass spectrometer was mixed with Ar (0.8 L/min). Sulfide reference material MASS-1 (Wilson et al., Reference Wilson, Ridley and Koenig2002) was used as an external calibration standard for both In and Au together with in-house pyrrhotite Fe0.9S. Isotopes 68Zn or 33S were used as internal standards. The detection limit for Au (2σ) was 0.1 ppm. A scan speed of 5 µm/s was used for analyses along linear pathways.
X-ray absorption spectroscopy (XAS)
X-ray absorption experiments (i.e. collection of X-ray absorption spectra in the energy range near the core-level of the specified element) were performed at the European Synchrotron Radiation Facility (ESRF) in Grenoble, France; and Kurchatov Synchrotron Radiation Source (KSRS) in Moscow, Russia. An X-ray absorption spectrum comprises XANES data (~50–80 eV from the absorption edge) that provides information about the electronic structure and coordination geometry (Mottana, Reference Mottana, Beran and Libowitzky2004), and EXAFS data (~1000 eV from the absorption edge), that provides information on the radii of coordination shells and coordination numbers (Galoisy, Reference Galoisy, Beran and Libowitzky2004) around the absorbing atom. In our investigation X-ray absorption spectra were recorded in two modes: TFY (In, Fe, Zn and Cd) and HERFD (Au). Details on the physical principles and experimental realisation of TFY and HERFD-XAS methods are given elsewhere (see, for example, Glatzel and Bergman, Reference Glatzel and Bergman2005; Glatzel et al., Reference Glatzel, Weng, Kvashnina, Swarbrick, Sikora, Gallo, Smolentsev and Mori2013; Kvashnina and Scheinost, Reference Kvashnina and Scheinost2016). The HERFD mode yields spectral features much more intense compared to the TFY (Glatzel et al., Reference Glatzel, Weng, Kvashnina, Swarbrick, Sikora, Gallo, Smolentsev and Mori2013) which is of crucial importance for Au-bearing sulfides with predominantly covalent bonding and smooth XANES character (c.f., Tagirov et al., Reference Tagirov, Trigub, Kvashnina, Shiryaev, Chareev, Nickolsky, Abramova and Kovalchuk2016).
The Au L 3-edge spectra were collected at the high-brilliance X-ray absorption/X-ray emission spectroscopy undulator beamline ID26 (Gauthier et al. Reference Gauthier, Sole, Signorato, Goulon and Moguiline1999) of the ESRF. The storage-ring operating conditions were 6.0 GeV and the ring current was varied between 150 and 200 mA. The incident energy was selected using the <111 > reflection from a double Si crystal monochromator. Rejection of higher harmonics was achieved by three Pd mirrors positioned at an angle of 2.5 mrad relative to the incident beam. The incident X-ray beam had a flux of ~2×10¹³ photons s–1 on the sample position. The spectra were measured in HERFD mode using an X-ray emission spectrometer (Glatzel and Bergman, Reference Glatzel and Bergman2005; Kvashnina and Scheinost, Reference Kvashnina and Scheinost2016). The sample, the analyser crystal and the photon detector (silicon drift diode) were arranged in a vertical Rowland geometry. The Au L 3-edge HERFD-XAS spectra were obtained by recording the intensity of the Au Lα1 emission line (9713 eV) as a function of the incident energy. The emission energy was selected using the <555 > reflection of four spherically bent Ge crystal analysers (1 m curvature radius) aligned at a Bragg angle of 78°. A combined (incident convoluted with emitted) energy resolution of 1.5 eV was determined as the full width at half maximum of the elastic peak. The intensity was normalised to the incident flux. Energy calibration was carried out using the L 3-edge excitation energy of Au (11,919 eV) by recording the spectra of Au foil before measuring each sample.
The In and Cu K-edge spectra were recorded at the Rossendorf Beamline BM20 of the ESRF. The storage-ring operating conditions were 6.0 GeV and 80–100 mA. The photon energy was scanned from 27700 to 28570 eV (In) and 8600 to 9900 eV (Cu) using the Si(111) monochromator coupled to Rh-coated mirrors for the collimation and reduction of higher harmonics. Energy calibration was performed using the K-edge excitation energy of In (27,940 eV) and Cu (8979 eV) metal foil. The spectra of the metal foils, placed immediately after the samples between the 2nd and 3rd ionisation cameras, were recorded in transmission mode simultaneously with the spectra of the samples. The spectra of reference substances were collected in transmission mode while the spectra of sphalerite samples were recorded in TFY mode using a 13-element high-throughput Ge-detector. The total energy resolution (incident energy and core-hole lifetime broadening) has been evaluated as 8.8 eV. The detected intensity was normalised to the incident photon flux.
The Zn, Fe and Cd K-edge spectra were measured at the Structural Materials Science station (Chernyshov et al., Reference Chernyshov, Veligzhanin and Zubavichus2009) of the KSRS. The storage-ring operating conditions were 2.3 GeV and 80–100 mA. A Si(111) monochromator was used and the energy calibration was performed using the K-edge absorption energy of Zn, Fe and Cd foils. The X-ray absorption spectra of Zn in sphalerite samples were registered in transmission mode and the spectra of Fe and Cd in fluorescence mode using an avalanche photodiode (FMB OXFORD). The spectra of standards (pure synthetic minerals FeS2 and CdS) were recorded in transmission mode.
EXAFS spectra fitting
The EXAFS (χ exp(k)) data were analysed using the IFEFFIT package (Ravel and Newville, Reference Ravel and Newville2005). Following standard procedures for pre-edge subtraction and spline background removal, the structural parameters [interatomic distances (R i), coordination numbers (N i) and Debye–Waller factors (σ2i)] were determined via the non-linear fit of theoretical spectra to the experimental ones with the equation
Theoretical spectra were simulated using photoelectron mean free-path length λ(k), amplitude F i(k) and phase shift φi(k) parameters calculated ab initio using the program FEFF6 (Zabinsky et al., Reference Zabinsky, Rehr, Ankudinov, Albers and Eller1995).
Density Functional Theory (DFT) calculations
The objective of these calculations was to investigate the substitution mechanisms in In- and Au-bearing sphalerites by modelling the local atomic environments of these elements with subsequent comparison of simulated and experimental XAS data, and to describe their charge states. In addition, a series of calculations was performed for Cd-bearing sphalerite. Details of quantum chemical DFT calculations are described in Tagirov et al. (Reference Tagirov, Trigub, Kvashnina, Shiryaev, Chareev, Nickolsky, Abramova and Kovalchuk2016) and Trigub et al. (Reference Trigub, Tagirov, Kvashnina, Chareev, Nickolsky, Shiryaev, Baranova, Kovalchuk and Mokhov2017). The software package QUANTUM ESPRESSO (Giannozzi et al., Reference Giannozzi, Baroni, Bonini, Calandra, Car, Cavazzoni, Ceresoli, Chiarotti, Cococcioni, Dabo, Corso, de Gironcoli, Fabris, Fratesi, Gebauer, Gerstmann, Gougoussis, Kokalj, Lazzeri, Martin-Samos, Marzari, Mauri, Mazzarello, Paolini, Pasquarello, Paulatto, Sbraccia, Scandolo, Sclauzero, Seitsonen, Smogunov, Umari and Wentzcovitch2009) was used for the calculations. We employed a projector-augmented wave all-electron description of the electron–ion–core interactions (Blöhl, Reference Blöhl1992; Kresse, Reference Kresse1999) and the Perdew–Burke–Ernzerhof exchange-correlation functional. The self-consistent field (SCF) method with a 100 Ry kinetic energy cut-off for the plane waves, a 1500 Ry charge density cut-off, and a SCF tolerance >10–9 was applied in the electronic structure calculations. The optimisations of the crystal structure and supercell parameters were performed using the Broyden–Fletcher–Goldfarb–Shanno algorithm (Fletcher, Reference Fletcher1987) for atomic coordinates with convergence threshold 10–3 Ry/au for forces and 10–4 Ry for energy. The relaxation of the atomic positions and cell parameters were performed in a supercell that contained 3 × 3 × 3 unit cells. The topological atomic charges were determined by means of the quantum theory of atoms in molecules (QTAIM, Bader, Reference Bader1990; Bader, Reference Bader1991). The local atomic charges were calculated by integrating the charge density within Bader volumes around the atoms (Otero-de-la-Roza et al., Reference Otero-de-la-Roza, Blanco, Martín Pendás and Luaña2009; Otero-de-la-Roza et al., Reference Otero-de-la-Roza, Johnson and Luaña2014).
Results and discussion
Concentration and distribution of admixtures
The morphology of the crystals of synthetic and natural sphalerites is shown in Figs 1a and b, respectively. Back-scattered electron images of synthetic and natural crystal grains mounted in polished sections are shown in Figs 2a and b, respectively. Time-resolved spectra of the LA-ICP-MS signal recorded for synthetic Au–In sphalerites is shown in Fig. 3. Compositions of crystals are listed in Table 1.
Fig. 1. (a) Optical microscope image of an aggregate of synthetic Au–In-bearing sphalerite crystals (Sample 1661). Concentrations of admixtures: 1.9 wt.% Fe; 0.22 wt.% In; and 0.25 wt.% Au. Field of View = 0.3 mm × 0.4 mm. Photo by T. Pashko. (b) Back-scattered electron images of crystals of natural Cu–In-bearing sphalerite (Sample 501).
Fig. 2. Examples of back-scattered electron images of sphalerite grains. (a) Synthetic Au–In sphalerites. Several inclusions of metallic Au captured during precipitation of sphalerite are seen in the image of Sample 1450 (only grains free of Au inclusions were selected for the XAS experiment). (b) Natural Cu–In sphalerite. All the grains of sphalerite are homogeneous within the resolution of the scanning electron microscope, the composition of the samples is given in Table 1.
Fig. 3. Laser ablation-ICP-MS time-resolved spectra of line analysis across sphalerite grains. The compositions of samples are given in Table 1.
Table 1. Compositions of synthetic and natural sphalerites used in XAS experiments. Concentrations are given in wt.% (± 2σ).
1 Salt flux synthesis method; 2 gas transport synthesis method; 3 data of Chaplygin et al. (Reference Chaplygin, Mozgova, Mokhov, Koporulina, Bernardt and Bryzgalov2007), the range of measured concentrations is given in parentheses; 4 determined in the present study; n/d – not determined.
As a result of the synthesis experiments, aggregates of crystals with a grain size between 0.1 and 1 mm were obtained (Fig. 1a). The XRD pattern of synthesised samples corresponded to the pure sphalerite PDF#5-566. High-temperature (850°C) sphalerites contained extremely high (up to 0.5 wt.%) concentrations of In and Au. Both In and Au were found to be dispersed in the ‘invisible’ state by optical and electron microscopy (Fig. 2a). The concentrations of these admixtures in the synthesised crystals are close to each other and directly correlated (Table 1). The homogeneous character of In and Au distribution patterns is confirmed by (1) a small variation of measured concentrations (see uncertainties of measured concentrations in Table 1), and (2) the ‘flat’, smooth character of LA-ICP-MS time-resolved spectra which indicates the absence of micronuggets of In- and Au-bearing phases (Fig. 3). At the same time, some crystal aggregates were covered with metallic Au which was transported together with other metals and deposited at the cold end of the ampoule. Analyses by SEM revealed that these aggregates typically contained inclusions of Au inside the sphalerite grains (Fig. 2a). Therefore, during the preparation of samples for the XAS experiment, only grains where the surface was free of metallic Au were selected using binocular microscopy. The absence of the spectral features of metallic Au in the recorded XAS spectra demonstrated that the concentration of this form of Au in the selected samples was negligible.
The natural sample (Fig 1b) is composed of sphalerite, probably with a minor admixture of the hexagonal phase – wurtzite (results of XRD analysis are shown in fig. 5 in Chaplygin et al., Reference Chaplygin, Mozgova, Mokhov, Koporulina, Bernardt and Bryzgalov2007). The distribution of elements in the sphalerite grains is homogeneous (Fig. 2b). Apart from admixtures of In, Cu and Mn (<1 wt.% of each element), the sample contains Cd (7 wt.%) and Fe (3 wt.%) (Table 1). Note also that μm-sized Au crystals were commonly observed on the surface of grains of sphalerite and wurtzite–greenockite sampled at the Kudriavy volcano (see fig. 3c in Chaplygin et al., Reference Chaplygin, Mozgova, Mokhov, Koporulina, Bernardt and Bryzgalov2007). The concentration of ‘invisible’ Au in the natural sphalerite sample was 7 ppm.
XANES spectroscopy
The In, Cu, Cd K-edge XANES and Au L 3-edge HERFD-XANES spectra of sphalerite samples are compared to the reference substances in Fig. 4. Energy positions of the edge jump and the first intense feature known as the ‘white line’ are listed in Table 2. The Zn and Fe K-edge spectra are shown in Supplementary Fig. S1. To facilitate discussion of XAS results, Fig. 5 shows the crystal structure of sphalerite with an indication of the coordination polyhedra around a cation.
Fig. 4. (a) Indium K-edge XANES spectra of In–Au-bearing sphalerites and standards (In2O3 and In2S3); (b) Au L 3-edge HERFD-XANES spectra of Au ± In-bearing sphalerites and standards (Au and Au2S); (c) Cd K-edge spectra of the natural sphalerite and standards (CdS and CdCsBr3); (d) Cu K-edge XANES spectra of In–Cu-bearing natural sphalerite (Kudriavy volcano) and standards (Cu, CuFeS2 and CuInS2). Vertical dashed lines indicate positions of the most intense spectral features of sphalerite samples.
Fig. 5. (a) The unit cell of cubic ZnS. Large grey balls are Zn atoms, small white balls are S atoms. (b) First (S4 tetrahedron) and second (Zn12 cuboctahedron) coordination shells of Zn in cubic ZnS. (c) Three coordination shells of Zn in ZnS. Red lines correspond to S–S edges, black lines correspond to Zn–Zn edges.
Table 2. Positions of edge jump (e.j.) and the first intense feature (white line, WL) of In K-edge, Au L 3-edge, Cu K-edge, and Cd K-edge spectra of synthetic Au±In- and natural Cu–In-bearing sphalerites and standards (as determined by the IFEFFIT program). Uncertainty of the energy values is ±0.5 eV.
Iron and zinc K-edges
Admixtures of In, Au and Cu affect neither coordination geometry of Zn/Fe, nor the Fe oxidation state (Fig. S1, left and right panels). We note, however, that XANES spectroscopy is not sensitive to minor changes of the oxidation state of the Fe admixture, which can be determined unambiguously by additional experiments with Mössbauer spectroscopy.
Indium K-edge
The edge jump and white line positions of In K-edge spectra are identical, independent to the concentration of In, Fe and Au in all synthetic Au–In-bearing sphalerites. This means that the concentration of Fe, Au and In itself, has a negligible effect on the local atomic environment and the valence state of In. At the same time, the edge jump and white line positions are different from those of the In2O3 and In2S3: they are shifted by 1 eV to lower energies in comparison with In2O3, and, on the contrary, by ~0.4 eV to higher energies compared to In2S3 (Table 2). This small shift is close to the uncertainty of the excitation energy, but was observed for all the sphalerite samples. Accordingly, the chemical state of In in sphalerite is different from the oxide and sulfide forms. In contrast to In2O3 and In2S3, the spectra of In-bearing sphalerites and CuInS2 look similar, which suggests the similarity of the nearest-to-In atomic geometry of sphalerite and In-chalcopyrite (roquesite).
The edge jump position of Cu–In-bearing sphalerite (Sample 501) is similar to the Au–In-bearing samples, but the white line position is located at a slightly higher energy (ΔE = 0.5 eV). The white line intensity is also different: it is lower than that of Au–In sphalerites which results in smoother character of the spectra. These differences are most probably due to the difference in composition of the natural sphalerite sample, which contains a high concentration of Cu (3 wt.%, Table 1) that can affect the electronic structure of the material and modify the shape of XANES spectra.
We can interpret the observed edge jump energy position in the sphalerites by assuming that the oxidation state of In is intermediate between In2O3 and In2S3, which means that the formal oxidation state of In in sphalerite is +3. The slightly higher energy of the edge jump position in In-bearing sphalerite in comparison with In2S3 can be ascribed to stronger In–S interaction in the state of the solid solution, which results in a more effective negative charge transfer from In to S similar to CuInS2. The latter would result in a shorter In–S distance in In-bearing sphalerite and CuInS2 compared to In2S3. An additional argument in favour of the compression of the 1st coordination shell is that the minimum of the XANES spectra, which separates white line and the 2nd spectral feature, is located at much higher energy of ~27,980 eV for In-bearing sphalerite than for In2S3 (~27,972 eV).
Gold L3-edge
The Au L 3-edge HERFD-XANES spectra of sphalerites differ from the spectra of Au and Au2S. The edge jump and white line positions are shifted to higher energies compared to the Au2S spectra. The position of the second spectral feature also exhibits a large positive shift by ~3 eV. The low white line intensity in comparison with Au3+ state (e.g. Tagirov et al., Reference Tagirov, Trigub, Kvashnina, Shiryaev, Chareev, Nickolsky, Abramova and Kovalchuk2016) suggests that the formal oxidation state of Au is +1. The shape of the white line feature of sphalerite spectra, unlike Au2S, is highly asymmetric which can be explained by the presence of several different geometries of the local atomic environment of Au. At the same time, the shape and positions of the spectral features are identical for In-rich and In-free sphalerites, which suggests the absence of In/Au clustering. This important conclusion was tested via EXAFS spectra analysis.
Copper K-edge
There are some small but notable differences of the spectrum of Cu–In-bearing sphalerite from the spectrum of CuInS2, which are clearly distinguishable in the enlarged portion of Fig. 4d. The edge jump of natural sphalerite (Sample 501) is slightly (by 0.5 eV) shifted towards lower energies (Table 2). At the same time, the second spectral feature with the maximum at ~8997 eV is located at higher energy than the second feature of CuInS2. In general, the shapes of XANES spectra of natural Cu–In-bearing sphalerite and CuInS2 are not identical, which implies that some differences exist between the states of Cu in these phases.
The differences between the spectra of sphalerite, CuInS2, and the spectrum of chalcopyrite CuFeS2 are much more pronounced. The pre-edge feature, which is present in the spectrum of CuFeS2, is absent in the spectra of CuInS2 and natural sphalerite. The formal electronic structure of Cu is [Ar] 3d 10 for Cu1+, and [Ar] 3d 9 for Cu2+. Therefore, the spectral features of the Cu K-edge XANES correspond to dipole-allowed excitations to the empty 4p level for Cu1+ and, in addition, the pre-edge structure is most likely to correspond to the transitions from 1s to hybridised 3d-4p states. The same pre-edge feature is observed in the XANES Cu K-edge spectrum of covellite where the formal oxidation state of Cu is close to +1.3 (Tagirov et al., Reference Tagirov, Trigub, Kvashnina, Shiryaev, Chareev, Nickolsky, Abramova and Kovalchuk2016). Increase of the Cu oxidation state in CuFeS2 in comparison with CuInS2 results in a positive shift of the edge jump and white line positions of CuFeS2 (Table 1). Therefore, the formal oxidation state of Cu in chalcopyrite falls between +1 and +2, which is associated with the formal oxidation state between +2 and +3 for Fe. The absence of the pre-edge feature in the spectra of CuInS2 and Cu–In-bearing sphalerite implies that the oxidation state of Cu is +1, which is consistent with the oxidation state +3 for In.
Cadmium K-edge
The shape of the Cd K-edge XANES spectra of natural sphalerite and positions of the main spectral features are different from those of the spectra of reference substances (CdS(cr) and CdCsBr3). This means that the local atomic environment of Cd differs from CdS(cr) – greenockite. The formal oxidation state of Cd is +2. The ‘effective’ oxidation state of Cd in sphalerite, which is indicative for the electronic structure of the substance, is lower (less positive) than the oxidation state in both the references as the edge jump position is shifted to lower energies (Table 2), and the white line is of lower intensity (Fig. 4).
EXAFS spectra fitting
Results of EXAFS spectra fitting obtained using the ARTEMIS program of the IFEFFIT software package for Zn, Fe, In, Cu and Cd K-edges, and for the Au L 3-edge are given in Table 3 and compared with the experimental spectra in Fig. 6 (In K-edge), Fig. 7a (Au L 3-edge), Fig. 7b (Cu K-edge) and Fig. 8 (Cd K-edge). Figures S2 and S3 show Zn and Fe K-edge spectra, respectively.
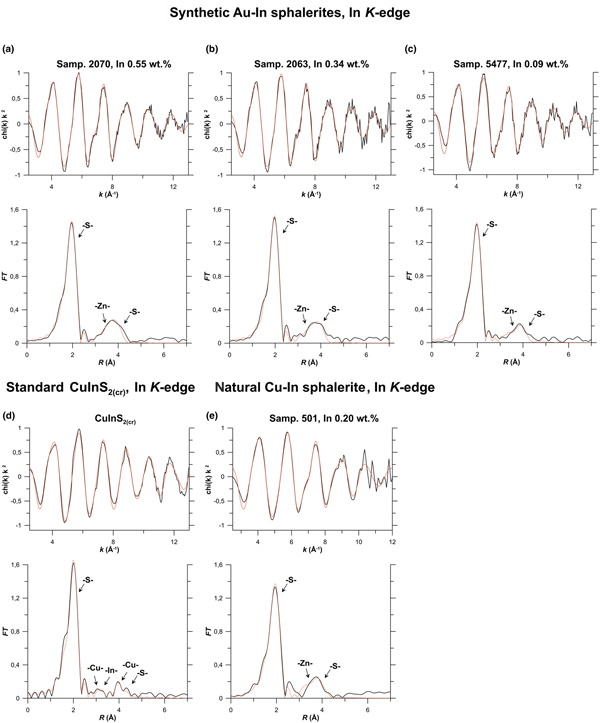
Fig. 6. Results of In K-edge EXAFS spectra fitting. Synthetic Au–In sphalerites, Samples: (a) 2070; (b) 2063; and (c) 5477. Natural Cu–In sphalerite: (d) Sample 501; and (e) standard – roquesite CuInS2(cr). Top: k 2-weighted background-subtracted EXAFS spectra, Bottom: Fourier transforms (FT) of the k 2-weighted EXAFS spectra (not corrected for phase shift). Black lines – experiment, red lines – fit results. Scattering atoms are indicated near FT peaks, MS – multiple-scattering contributions. Results of the fitting are listed in Table 3.
Fig. 7. Results of Au L 3-edge and Cu K-edge EXAFS spectra fitting. (a) Au L 3-edge: synthetic Au–In sphalerites for Samples 1450, 1661 and standard Au2S(cr). (b) Cu K-edge: natural Cu–In sphalerite (Sample 501), and standards chalcopyrite CuFeS2(cr) and roquesite CuInS2(cr). For the legend see caption to Fig. 6, MS – multiple-scattering contributions.
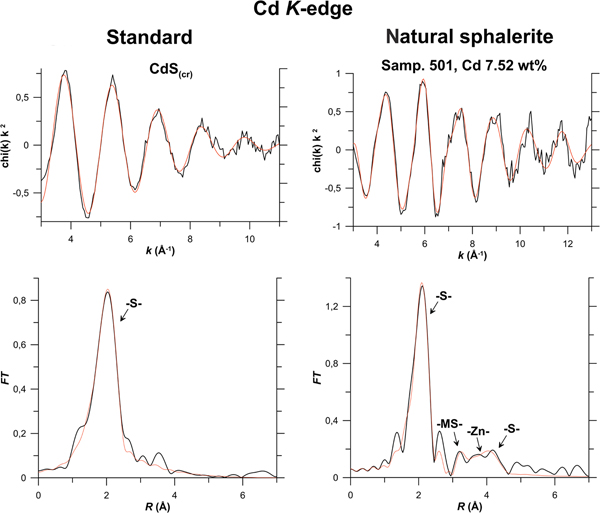
Fig. 8. Results of Cd K-edge EXAFS spectra fitting of natural sphalerite (Sample 501), and standard synthetic CdS(cr). For the legend see caption to Fig. 6; MS – multiple-scattering contributions.
Table 3. Zn, Fe, In, Cu, Au and Cd local atomic structure in sphalerite determined by EXAFS fitting using the IFEFFIT package (fit in k-space unless otherwise indicated, k 2 weighting). Numbers without uncertainties were fixed during the fit. Uncertainties are calculated by the ARTEMIS program.
1S 02 = 0.85 (ZnS); 2S 02 = 0.75 (FeS2); 3sphalerite structure from Jamieson and Demarest (Reference Jamieson and Demarest1980) was used as initial model for EXAFS fitting, S 02 = 0.95 was calculated from fitting of In2S3 model spectra; 4S 02 = 0.75 (CuInS2); 5Au2S structure (Ishikawa et al., Reference Ishikawa, Isonga, Wakita and Suzuki1995) was used as initial model for EXAFS fitting, the value of S 02 = 0.84 calculated from fitting of Au2S model spectra was used for fitting of Au–In-sphalerite spectra; 6MS: Au–Au –S–Au; 7MS: Au–S–Au–S–Au; 8S 02 = 0.95 (CdS); 9MS: Cd–Zn–S–Cd.
Zinc and iron K-edges
The local atomic structures around Zn and Fe (coordination numbers and interatomic distances) are identical within the uncertainty of the experimental data, and correspond to pure sphalerite (Zn,Fe)S (top of Table 3).
Indium K-edge
The best fit of the experimental spectra of Au–In and Cu–In-bearing sphalerites was achieved when In substitutes for Zn in the sphalerite lattice. Analysis of the experimental spectra yields no difference in the local atomic environment of In regardless of the composition of minerals (Table 3, Fig. 6). In the structure of sphalerite a cation is tetrahedrally coordinated by S atoms; the 2nd coordination shell consists of 12 Zn atoms, and the 3rd coordination shell contains 12 S atoms (Fig. 5). Preliminary fitting of the experimental spectra were performed with calculation of the coordination numbers of atoms in the 2nd and 3rd coordination shells. The calculated values of N varied between 10 and 19, but the uncertainty of the single values was quite large. Therefore, during the final fits these values were fixed in accordance with the sphalerite structure parameters (N = 12).
Data in Table 3 indicate that the In–S distance increased by 0.12 Å with respect to the crystal structure of pure sphalerite in the 1st coordination shell, by 0.09–0.1 Å for Zn atoms in the 2nd shell, whereas the In–S distance for the 3rd coordination shell is close to that of pure ZnS. Thus, our data demonstrate that the distortion of the sphalerite crystal structure, caused by the replacement of Zn with In, decreases for distant coordination shells and disappears at R > 4.6 Å. This observation is consistent with results obtained for semiconducting In- and Ga-bearing materials with tetrahedral coordination polyhedra (Schnohr, Reference Schnohr2015). The admixture of Fe (up to 10 wt.%) and Cd (up to 7.5 wt.%) does not change the structural parameters of In.
Regardless of the high Au concentrations, we did not observe a contribution of this heavy atom to In K-edge EXAFS spectra up to the 3rd coordination shell. These results imply the possibility of the formation of In-bearing solid solution in sphalerite without the Au–In clustering. Generalising these results to all the group 11 metals we suggest that the charge compensation coupled substitution scheme, 2Zn2+↔(Cu,Ag,Au)1++In3+, may take place in sphalerite without formation of roquesite (CuInS2) and, probably for Ag, laforêtite (AgInS2) components in solid solution. This implies that In and the group 11 metals are statistically (randomly) distributed within the sphalerite matrix. The R In–S = 2.46 ± 0.01 Å determined in the present study for the first coordination shell of Au–In- and Cu–In-bearing sphalerites agrees within uncertainty levels with the value determined for synthetic Cu–In-bearing phases in Pattrick et al. (Reference Pattrick, Mosselmans and Charnock1998) and Fieber-Erdmann et al. (Reference Fieber-Erdmann, Rossner, Holub-Krappe, Eyert and Luck1999), as well as with the R In–S in roquesite.
Gold L3-edge
The nearest neighbours of Au in sphalerite are S atoms with N S ≈ 2.5. The Au–S distance of 2.35 Å is higher than in Au2S where Au is linearly coordinated with S atoms (N S = 2, R Au–S = 2.30 Å, Table 3 and Fig. 7a). In contrast to In, for which the structural parameters can be obtained up to the 3rd coordination shell with 12 S atoms, the absence of a distinct maximum of the Fourier transform for Au L 3-edge EXAFS spectra at R > 2.5 Å implies that the second coordination shell of Au is of a disordered nature. The mentioned values of N and R, the complex line shape of HERFD-XANES spectra with broad asymmetric white lines (Fig. 4), as well as disordered distant coordination shells, might be interpreted as the presence of at least two different forms of Au. Comparing these data with results reported in the literature for Cu-bearing (In-free) sphalerites (Warkentin et al., Reference Warkentin, Bridges, Carter and Anderson2007) and taking into account the similarity of Cu and Au chemical properties, we suggest that these forms can be Au2S clusters (R Au–S ~ 2.3 Å) and a small admixture of the Au solid solution with higher Au–S distance (R Au–S ~ 2.5 Å in accord with DFT calculations, see section ‘DFT calculations and atomic charges’). We note here that the crystal structures of CuS and Au2S are different, but at the nanoscale level both geometric and electronic factors are important in stabilisation of the (nano)clusters (c.f., Tofanelli and Ackerson, Reference Tofanelli and Ackerson2012). The pronounced increase by ~0.2 Å of the Au–S distance in Au solid solution with respect to the Zn–S distance in pure sphalerite can be explained by a large difference in the ionic radii of these metals (0.6 Å for Zn vs 1.37 Å for Au, Shannon, Reference Shannon1976). Apart from chemical analogy with Cu, the following facts argue for the presence of Au2S clusters: (1) the coordination number N s is close to 2; (2) the interatomic distance R Au–S is close to 2.3 Å; and (3) the size of the Au-bearing inclusions is submicroscopic (Fig. 2a). Our data, however, do not allow us to determine whether the Au2S clusters were formed at the synthesis temperature, or formed as a quench product of the solid solution breakdown. Similarly to CuS in Cu-bearing sphalerite (Warkentin et al., Reference Warkentin, Bridges, Carter and Anderson2007), the Au2S clusters can be integrated into the sphalerite host matrix in accordance with the crystallographic axes of the sphalerite structure, which can stabilise the metastable gold sulfide.
The absence of a contribution from the In atom in the distant coordination shells of Au is an additional argument for the absence of the Au–In clustering. We can speculate that at high temperatures Au existed mostly in the solid-solution state, decomposing upon cooling into Au2S clusters. Evidence might be (1) the concentration of Au in sphalerite is proportional to the In content (these elements can form an isomorphous solid solution via the charge compensation scheme), and (2) Au2S is a metastable phase which decomposes at high temperatures (Tagirov et al., Reference Tagirov, Baranova, Zotov, Schott and Bannykh2006). However, the characterisation of Au in sphalerite at high temperatures can only be determined unambiguously by in situ spectroscopic experiments on sphalerite being heated to the formation (synthesis) temperature.
Copper K-edge
In contrast to Au, the Cu K-edge EXAFS spectrum is best described by the solid-solution model with N S ≈ 4 (Table 3). The Fourier transform of EXAFS spectra in the region of distant coordination shells (R > 3 in Fig. 7b) is different from those of reference substances – CuFeS2 and CuInS2. The distant coordination shells of Cu in Cu–In-bearing sphalerite are disordered in contrast to the reference substances. This is the common feature of Cu–In- and Au–In-bearing sphalerites. The distance to the S atoms in the 1st coordination shell is 2.30 Å which is shorter by 0.04 Å than the Zn–S distance in pure sphalerite.
Cadmium K-edge
As indicated by data presented in Fig. 8 and Table 3, the best fit of the Cd K-edge EXAFS spectrum is attained for the solid-solution model. The contributions of the distinct atomic groups are clearly distinguishable up to the 3rd coordination shell of Cd. As in the case of In, the 1st coordination shell of the cation exhibits considerable expansion of 0.17 Å compared to the pure sphalerite structure, the 2nd coordination shell expands by 0.14 Å, whereas the expansion of the 3rd shell is much less pronounced: the Me–S distances of Cd-bearing and pure sphalerite are identical within the experimental uncertainty. No Cd–Cd clustering is observed which means that Cd is randomly distributed within the sphalerite matrix. Note that the absence of the contributions from the distant coordination shells in the spectrum of CdS(cr) can be related to the low quality of the material which was obtained by means of reaction of aqueous Cd acetate solution with hydrogen sulfide in a hydrothermal reactor, and has not been subjected to ageing.
DFT calculations and atomic charges
Results of relaxation of atomic structures performed using the DFT method are given in Table 4. As can be seen in the last two columns of Table 4, an excellent agreement (within 0.02–0.03 Å) is observed between the simulated structure of pure sphalerite ZnS and interatomic distances calculated from the XRD data, as well as with results of the EXAFS spectra fitting (Table 3). These data demonstrate the high accuracy of the DFT method in modelling of sphalerite-type structures. For In the EXAFS model (Table 3) was adequately reproduced by DFT simulation for the solid solution formed via the scheme 2Zn↔(In + Au) with In and Au atoms located far from each other (without Au–In clustering). In this case the difference between DFT calculation and EXAFS spectra fitting is 0.02, 0.01 and 0.04 Å for the 1st, 2nd, and 3rd coordination shells, respectively. For the case when In and Au are placed in the adjacent cationic positions there is considerable splitting of interatomic distances in the 1st and 2nd coordination shells of In and Au. This splitting would result in unrealistically high values of Debye–Waller parameters which were not observed in the EXAFS model. The same scheme can be applied to Cu–In-bearing sphalerites although the splitting is less pronounced (0.05 Å for in the 1st coordination shell of In in Cu–In-bearing sphalerite vs. 0.07 Å for the In–Au-bearing one, Table 4). This splitting is still significant for the value of Debye–Waller parameter.
Table 4. Interatomic distances in sphalerite with and without In, Au and Cu dopants determined by DFT calculations. Literature data on interatomic distances for the unrelaxed pure sphalerite structure are given at the bottom of the table.
Another possibility to obtain the charge compensation is the scheme 3Zn2+↔2In3++□, where □ is the cationic sublattice vacancy. The second part of Table 4 indicates that results of DFT calculations for this compensation scheme, when two In atoms and a vacancy are located far from each other, are close to the EXAFS data (Table 3). This scheme, however, cannot explain the direct correlation between In and Au contents and, therefore, can be rejected.
In the case of Au, the agreement between the DFT simulation and EXAFS fit is poor. This means that the most of Au is not in the solid-solution state, but, as has been shown by the EXAFS spectra fitting, presents in the form of Au2S clusters. The minor contribution of the solid-solution Au is reflected in the increase of the Au–S distance in the 1st coordination shell of Au determined by the EXAFS spectra fitting, and increase of the number of the sulfur atoms nearest to Au (in the solid-solution state R Au–S = 2.5 Å and N S = 4, Table 4).
The agreement between the DFT simulation and EXAFS spectra fitting of Cd-bearing sphalerite is fairly good (within 0.01 Å for the 1st coordination shell and 0.02 Å for the 3rd one). For the 2nd coordination shell the calculated distance differs from the EXAFS model by 0.07 Å which is close to the EXAFS fit uncertainty of 0.06 Å. This calculation confirms the solid-solution state of Cd.
The results of the Bader analysis of electron density performed using QTAIM are summarised in Table S1. The partial atomic charge of In in sphalerite is more positive than that of In in InS and In2S3 (+1.2 ± 1.3 e for In-bearing sphalerites vs. +0.7 ± 0.8 e for In sulfides). The more positive charge is consistent with analysis of In K-edge XANES spectra and reflects the more efficient transfer of the negative charge from In to ligands (S) in the solid-solution state. The positive charge of Au slightly decreases when it is incorporated into the sphalerite structure in comparison with Au2S, whereas the charge of Cu in sphalerite is much more positive compared to the charge of Au (+0.52 e for Cu vs. +0.17 e for Au). This is explained by the fact that Au is the most electronegative metal (χ(Au) = 2.54) whose electron affinity is higher than that of Zn, In and Cu. It is interesting to note that the charges of In, Au and Cu are almost independent to the mechanism of their incorporation into the structure of sphalerite. This means that in sphalerite the redistribution of delocalised electrons due to isomorphic substitutions takes place not only between the nearest atoms, but involves remote atoms located far from the admixture within the bulk sphalerite structure, which is consistent with the absence of Cu–In and Au–In clustering.
Concentration and state of admixtures in sphalerite
In general, one can say that sphalerite can host high (up to economic) concentrations of admixtures of many critical and strategic elements in the solid-solution state. All admixtures, which were determined at trace/minor level in sphalerite samples studied in the present work (Cd, Mn, In, Cu, Au and Se), are distributed homogeneously within the host mineral matrix. The concentration of critical elements (Cd, In, Au and Se) in sphalerite, formed at high temperature, can reach a level of a few tenth of wt.% (a few wt.% for Cd). These data imply that the concentration of the admixtures in the solid-solution state increases with increasing temperature. At the ore formation temperature the solubility of dopants, apart from the temperature, is governed by the difference in the ionic radii with the main component (Zn). The concentration of heterovalent dopants in sphalerite also depends on the concentration of the adjacent admixture (In in the case of Cu and Au).
Results of the present study demonstrate that at low concentrations (<1 wt.%) inherent to natural sphalerites, In is in the solid-solution state independently of the adjacent metal type (Cu or Au). There are some indications that the formation of the sphalerite solid solution can take place without In–In, Au–Au, Au–In and Cu–In clustering, which means that all these elements are distributed randomly in the sphalerite matrix. These indications are: (1) the differences in the Cu K-edge XANES spectra of Cu–In-bearing natural sphalerite and CuInS2; (2) an absence of the heavy-atom contributions to the EXAFS signal corresponding to the 2nd coordination shell of In and Cu (Au in the case of In K-edge spectra, and In in the case of Cu K-edge one); and (3) according to DFT simulations, Cu–In clustering would produce a notable splitting of interatomic distances which was not observed in the results of Cu and In K-edge EXAFS spectra fitting. We note, however, that these indications are indirect, and the problem of clustering in the sphalerite solid solution needs further examination.
Similarly In, with an ionic radius of 0.62 Å (Shannon, Reference Shannon1976) is close to Zn (0.6 Å), Cu (ionic radius 0.6 Å) withstands cooling and at ambient temperature exists in the solid-solution state. Direct correlation between the concentrations of Au and In in the synthesised sphalerite crystals imply that Au is also present in the solid-solution state at the synthesis parameters up to Au concentrations of a few tenth of wt.%. The Au solid solution, however, decomposes during cooling with the formation of Au2S clusters because of the large ionic radius of Au (1.37 Å, octahedral coordination, there is no data for tetrahedral geometry). The presence of the second, minor form of Au, which is detected in sphalerite together with the Au2S clusters and can be assigned to the solid solution, is indicated by: (1) the number of the nearest to Au S atoms N S > 2, whereas N S = 2 in Au2S; (2) the Au–S distance in the 1st coordination shell R Au–S = 2.35 Å, which is higher than the R Au–S = 2.30 Å in Au2S; and (3) the complex shape of the white line of Au L3-edge XANES spectra. The ratio of Au solid solution to Au2S clusters, calculated using the average value of R Au-S ~ 2.35 Å, obtained by means of the EXAFS spectra fitting, equals 0.05. This calculation implies that at ambient temperature Au in Au–In-bearing sphalerites exists in the solid-solution state at concentrations up to a few tens of ppm. Therefore, Au in natural Cu–In-bearing sphalerite sampled at Kudriavy volcano can be expected to be in the solid-solution state (the Au concentration is 7 ppm).
Our results demonstrate that all metals of group 11 of the periodic system (Me = Cu, Ag and Au) can form an isomorphous solid solution in sphalerite via the charge compensation scheme 2Zn2+↔Me ++Me 3+, where Me 3+ is a metal in +3 oxidation state. Apart from In3+ it can be a cation of another chalcophile element, for example, Tl3+, As3+, Sb3+, Bi3+, or Fe3+. The most probable candidate for this substitution is As3+ with ionic radius close to the radius of Zn2+ (0.58 Å (As) vs. 0.6 Å (Zn)). Because ionic radii of the other elements listed above in +3 oxidation state differ significantly from the radius of Zn2+ (0.76 Å (Sb), 0.75 Å (Tl), and 0.49 Å (Fe)) the solid solutions, formed at high temperature, will be of narrower composition range compared to In. The solid solutions involving these elements either decompose upon cooling, or represent a metastable phase which has not undergone a breakdown due to slow kinetics. The state of Ag in sphalerite, however, has to be determined by EXAFS spectroscopic experiments preformed on Ag- and Ag–In-bearing minerals. This is an ongoing study in our laboratory.
Formation of the solid solution 2Zn2+↔Au++Fe3+ is confirmed by high concentrations of Au (0.02 wt.% Au) in In-free Fe-bearing sphalerite, Sample 1440. The shape of Au L 3 HERFD-XANES spectra of this sample is similar to the spectra of Au–In sphalerite which implies similar speciation of Au, but the Au concentration is ~10 times lower because of the lower concentration of Fe3+ compared to In3+. The reason for the low Fe3+ concentration is considerable difference in ionic radii of Fe3+ and Zn2+. The concentration of Fe3+ in Sample 1440 can be estimated as ~0.005 wt.% from the suggested substitution mechanism. However, during cooling and decomposition of the solid solution with the formation of Au2S clusters, the Fe3+ also may change its oxidation state to Fe2+. The true oxidation state of Fe in sphalerites at ambient temperature can be revealed only by means of Mössbauer spectroscopy.
Conclusions
For the present study we synthesised crystals of In and Au-bearing sphalerite (Zn,Fe)S with dopants in concentrations of 0.03–0.5 wt.%. Results of EPMA and LA-ICP-MS chemical analyses showed that both In and Au are distributed homogeneously within the sphalerite matrix. X-ray absorption spectroscopy was applied in order to determine the local atomic environment and the valence state of In and Au in the synthesised crystal samples, which were compared to the natural Cu–In-bearing sphalerite sampled at the Kudriavy volcano (Iturup Island, Russia). In accordance with XANES spectroscopy these elements are present in sphalerite in +3 (In) and +1 (Au, Cu) formal oxidation states. At ambient temperature In exists in sphalerite in the solid-solution state where it replaces Zn. Analysis of EXAFS spectra shows that the bond lengths of In increase (with respect to pure ZnS) from 2.34 to 2.46 Å in the 1st coordination shell (where In is tetrahedrally coordinated by S), from 3.83 to 3.92 Å in the 2nd coordination shell (N Zn = 12), and is close to the Me–S distance of the pure sphalerite for the 3rd coordination shell (N S = 12, R In-S = 4.46–4.48 Å). Gold, in contrast to In, mainly exists in the form identified as Au2S clusters with average R Au–S ≈ 2.3 Å, and a small portion of the second form with R Au–S ≈ 2.5 Å which is attributed to the Au solid solution. The second coordination shell of Au is of disordered nature. The Au2S clusters, most probably, are the quench product of high temperature Au–In-bearing solid solution which was stable at the synthesis temperature. Copper in natural sphalerite is in the solid-solution state. The Cu–S distance in the 1st coordination shell is equal to 2.30 Å which is 0.04 Å lower than the Zn–S distance in pure sphalerite, whereas the distant coordination shells, like Au–In sphalerites, are of disordered character. Cadmium is distributed randomly within the natural sphalerite matrix and exists in the solid-solution state. The 1st coordination shell of Cd expands by 0.17 Å compared to the pure sphalerite structure, the 2nd coordination shell expands by 0.14 Å, whereas the Cd–S distance in the 3rd coordination shell is close to the Zn–S distance of pure sphalerite. These data demonstrate that the homogeneous character of a trace-element distribution, which is often observed in natural sulfide minerals, doesn't confirm formation of the solid solution, but can be explained by the presence of clusters or nano-sized particles disseminated in the host mineral matrix such as Au2S clusters. These clusters/particles can be formed because of the breakdown of the solid solution that was stable at the ore formation conditions. The final state of trace elements, which corresponds to ambient conditions, depends on the difference of the ionic radii between the trace element and the main component of the sulfide mineral (Zn in sphalerite in the present case), the presence of the conjugated charge-compensating element (In, Fe), and the trace-element concentration. When the ionic radii of trace and main components are close to each other, and the concentration of trace element is low enough, the metastable solid solution can withstand cooling like Cu–In-bearing sphalerites. If the difference in the ionic radii is considerable and trace elements are present in relatively elevated concentrations, most of the solid solution decomposes, and only a small portion of the trace element is present in the solid-solution state, as has been observed in the Au–In-bearing sphalerites. In natural sphalerites the concentration of Au and Ag (the other group 11 metal) rarely exceed a few tens of ppm and they coexist with Fe3+, In3+, or other metals in +3 oxidation state. Therefore, one can suggest that in natural sphalerites both Au and Ag are mostly present in the solid-solution state formed by the charge compensation scheme 2Zn2+↔Me + + Me 3+.
Acknowledgements
The authors thank the ESRF scientific council for the beamtime allocation under proposal Nos 20-01-782, ES-703 (ROBL) and ES-184 (ID26), and STM beamline team (KSRS) for technical support during the experiment. The help and support of Joerg Exner (ROBL) is greatly appreciated. We are grateful to Vera Abramova and Elena Minervina for chemical analyses of synthesised minerals using LA-ICP-MS methods. We would like to acknowledge the three anonymous reviewers and the Associate Editor for important comments that improved the quality of the manuscript. This study was supported by the Russian Science Foundation grant No. 14-17-00693-П (XAS experiments with Au–In sphalerites), Russian Science Foundation grant No. 18-77-00078 (XAS experiments with Cu–In sphalerite and DFT calculations), and Russian Foundation for Basic Research grant No. 16-05-00938 (crystal growth experiments). Quantum chemical calculations have been carried out using computing resources of the Federal collective usage centre Complex for Simulation and Data Processing for Mega-science Facilities at NRC “Kurchatov Institute” (ministry subvention under agreement RFMEFI62117X0016), http://ckp.nrcki.ru/. Chemical analyses were performed at the “IGEM-Analytica” Center for Collective Use.
Supplementary material
To view supplementary material for this article, please visit https://doi.org/10.1180/mgm.2019.10