


Introduction
Low-temperature plasmas are widely used in various technologies (Bogaerts et al., Reference Bogaerts, Neyts, Gijbels and van der Mullen2002). One of the most important is the application of plasma processes in the microelectronics industry. For fabrication of integrated circuits, several steps are typically plasma-based (Lieberman, Reference Lieberman, Schluter and Shivarova1999). The other very important application is deposition of thin films (Konuma, Reference Konuma1992; Kumar & Ando, Reference Kumar and Ando2010) allowing for the production of layers having unique properties such as hydrogenated silicon layers or diamond-like carbon. Another important process is plasma etching (Manos & Flamm, Reference Manos and Flamm1989; Samukawa & Mieno, Reference Samukawa and Mieno1996), including reactive etching connected with creation of volatile products like FW6, GeF4, or SiF4. This effect can be utilized for plasma etching of tungsten, germanium, silicon, or other materials containing these elements such as SiC (Plank et al., Reference Plank, Blauw, van der Drift and Cheung2003) or glass (Lallement et al., Reference Lallement, Gosse, Cardinaud, Peignon-Fernandez and Rhallabi2010). Plasma etching is widely used for manufacturing of MEMS (microelectromechanical systems), microfluidic devices, optical diffractive components, X-ray diffractive or refractive optics, etc. Plasma treatment can be also employed for surface activation and functionalization of polymers (Yoshida et al., Reference Yoshida, Hagiwara, Hasebe and Hotta2013). Such treatment can change wettability, adhesion characteristics, and biocompatibility of polymers by direct changing of the surface chemical compositions (Hegemann et al., Reference Hegemann, Brunner and Oehr2003; Kull et al., Reference Kull, Steen and Fisher2005; Lai et al., Reference Lai, Sunderland, Xue, Yan, Zhao, Folkard, Michael and Wang2006). Crosslinking of the polymer chains can result in the formation of three-dimensional molecular networks, by which the polymer layer became an insoluble material (Tajima & Komvopoulos, Reference Tajima and Komvopoulos2006). Fluorination of polymers by plasma treatment can result in hydrophobic surfaces preserving bulk properties of the exposed material (Rangel et al., Reference Rangel, Bento, Kayama, Schreiner and Cruz2003; Korotkov et al., Reference Korotkov, Goff and Ricou2007). The SF6 plasma treatment allows one to obtain the so-called black silicon with minimized reflection losses. Low reflectance of the silicon surface is very important for optoelectronic devices, in particular, for high-efficiency solar cells (Xia et al., Reference Xia, Liu, Zhong and Li2012). Low-temperature plasmas are also utilized for the spectrochemical analysis. In particular, it was shown by various authors that the excitation of atomic or molecular species in cold plasmas is a powerful method for such analysis. The method was used for a large variety of analytical tasks, such as the determination of noble metals (Liang et al., Reference Liang, Zhang, Lei, Zhang and Jin1995), the determination of the rare-earth elements (Duan et al., Reference Duan, Li, Tian, Zhang and Jin1994) or the determination of Hg with the aid of continuous cold vapor generation (Camun-Aguilar et al., Reference Camun-Aguilar, Tereiro-Garcia and Sanchez-Uria1994). In this case, the sample aerosol was introduced into the low-temperature plasma and the emission spectra of the excited species were measured and analyzed.
For the creation of plasmas, used for these purposes, plasma generators based on electrical discharge, working in a stationary regime, are used. They allow one to create plasmas of low temperature (Te ~ 104 K) and low electron density (n e ~ 1011–1013 cm−3) (Ogura et al., Reference Ogura, Yamada, Sato and Okamoto1997). Even in case of plasmas produced under atmospheric pressure the electron density, does not exceed significantly these values. In our previous works, an alternative method of low-temperature plasmas creation was proposed. The method is based on photoionization of gases with extreme ultraviolet (EUV) or soft X-ray (SXR) pulses, delivered by laser-produced plasma (LPP) sources. A possibility to create plasmas of significantly higher electron density, comparing with plasmas produced using standard generators, even exceeding 1018 cm−3 (Bartnik et al., Reference Bartnik, Wachulak, Fok, Fiedorowicz, Pisarczyk, Chodukowski, Kalinowska, Dudzak, Dostal, Krousky, Skala, Ullschmied, Hrebicek and Medrik2015), was demonstrated.
Most of our earlier works concerned investigation of low-temperature plasmas induced by irradiation of a small portion of gas, by a focused EUV/SXR beam. Such systems are very convenient, due to a high fluence of the focused radiation and a possibility of spectral measurements being not affected by the strong radiation from the laser-produced Xe plasma. The problem is, however, that the EUV/SXR collectors are being degraded due to deposition of decomposition products of irradiated materials on the reflective surface. Hence, for some applications, it would be reasonable to eliminate the collecting systems. In principle it is possible, by irradiation of the injected gas, using the intense EUV/SXR radiation in the vicinity of the laser plasma. In this case, at a short distance from the plasma, of the order of 1 cm, the radiation fluence can be comparable with the focused radiation.
In this work, a comparative study of low-temperature plasmas, created employing both irradiation schemes, was conducted. Spectral investigations in the EUV and UV/VIS range were performed. Based on the numerical simulation of the molecular spectra, electron, vibrational, and rotational temperatures were estimated.
Experimental arrangements
For the comparative studies, two irradiation systems based on different LPP sources were used. The first one (system no. 1) employed a 10-Hz LPP EUV source, based on a double-stream gas-puff target, and the 4 ns/0.8 J Nd:YAG laser (NL 303 HT, EXPLA, Lithuania). The target was formed by pulsed injection of xenon gas into a hollow stream of helium (Xe/He target) by employing an electromagnetic valve system, equipped with a double nozzle setup. The laser-focusing conditions were adjusted to obtain maximum intensity in the EUV spectral region. The EUV radiation was focused using a gold-plated grazing incidence ellipsoidal collector, manufactured by RITE s.r.o., Czech Republic. The collector allowed for effective focusing of the radiation in the wavelength range λ = 9 – 70 nm. Although the Xe plasma emission spans a wide wavelength range, the most intense emission is in the narrow spectral region centered at λ = 11 nm. The EUV fluence in a focal plane of the collector reached 100 mJ/cm2 at the center of a focal spot. An full-width at half-maximum (FWHM) of the intensity distribution across the focal spot was 1.4 mm. Detailed description of the source and parameters of focused EUV radiation can be found elsewhere (Bartnik et al., Reference Bartnik, Fiedorowicz, Jarocki, Kostecki, Szczurek and Wachulak2011). The focused EUV beam was used for ionization of the nitrogen gas, injected into the interaction region perpendicularly to an optical axis of the irradiation system, using an auxiliary gas puff valve. The valve was equipped with a tube-shaped nozzle, with an outlet located 2.5 mm from the optical axis of the EUV illumination system. The gas density, delivered to the interaction region, could be changed within the range of approximately 1 – 10% of the atmospheric density. More details concerning the injection system can be found in (Bartnik et al., Reference Bartnik, Lisowski, Sobczak, Wachulak, Budner, Korczyc and Fiedorowicz2012).
The other experimental setup (system no. 2) was based on a 10-Hz LPP EUV/SXR source employing the 10 ns/10 J Nd:YAG laser system (NL 129, EXPLA). Also in this case, for the plasma creation, the Xe/He target was used. The LPP system was optimized to deliver maximum emission in the EUV spectral region. The most intense emission was in the narrow spectral region centered at λ = 11 nm, however, a significant part of the radiation was emitted in a broad spectral range λ ~ 1–20 nm. In this case, no collector was employed for formation of the EUV beam. To obtain a sufficiently high radiation flux in the interaction region, a small portion of the nitrogen was injected into the vicinity of the LPP. The gas was injected using an auxiliary gas puff valve synchronized with the laser pulses. Its density in the interaction region could be also regulated within the range of 1–10% of the atmospheric density. The radiation fluence of the same value as in the first experimental setup was obtained at a distance of approximately 6 mm from the plasma.
Schemes of the experimental arrangements and spectra of the radiation, generated by the corresponding EUV/SXR sources, are presented in Figures 1 and 2, respectively. For both cases spectral measurements of the emitted radiation were performed employing a homemade spectrograph (Bartnik et al., Reference Bartnik, Fiedorowicz, Jarocki, Kostecki, Szczurek and Wachulak2011), based on a free-standing transmission grating 5000 lines/mm and a back-illuminated charge-coupled device (CCD) camera. A spectrum of the radiation, used for the creation of the low-temperature nitrogen plasmas, focused using the EUV collector, is presented in Figure 2a. A spectrum of an unfocused radiation, employed in the second irradiation system, is shown in Figure 2b. It should be noticed that the latter spectrum contains a short-wavelength part down to a wavelength of approximately 1 nm. The spectrum of the radiation focused using the EUV collector does not contain this part, due to reflective properties of the collector surface.
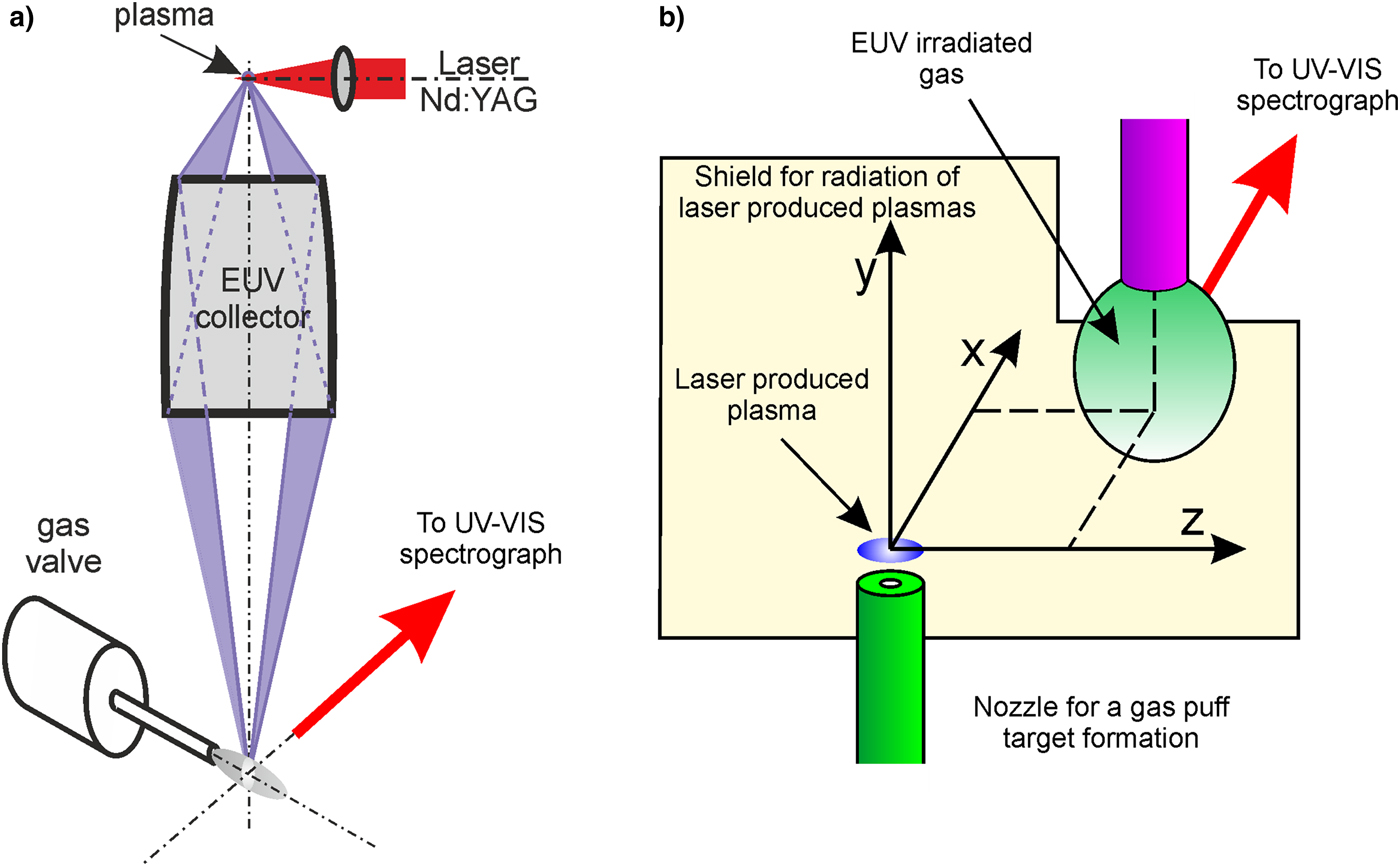
Fig. 1. Schemes of experimental arrangements employed for the creation of low-temperature plasmas: (a) containing the ellipsoidal EUV collector (system no. 1), (b) without any collector (system no. 2).
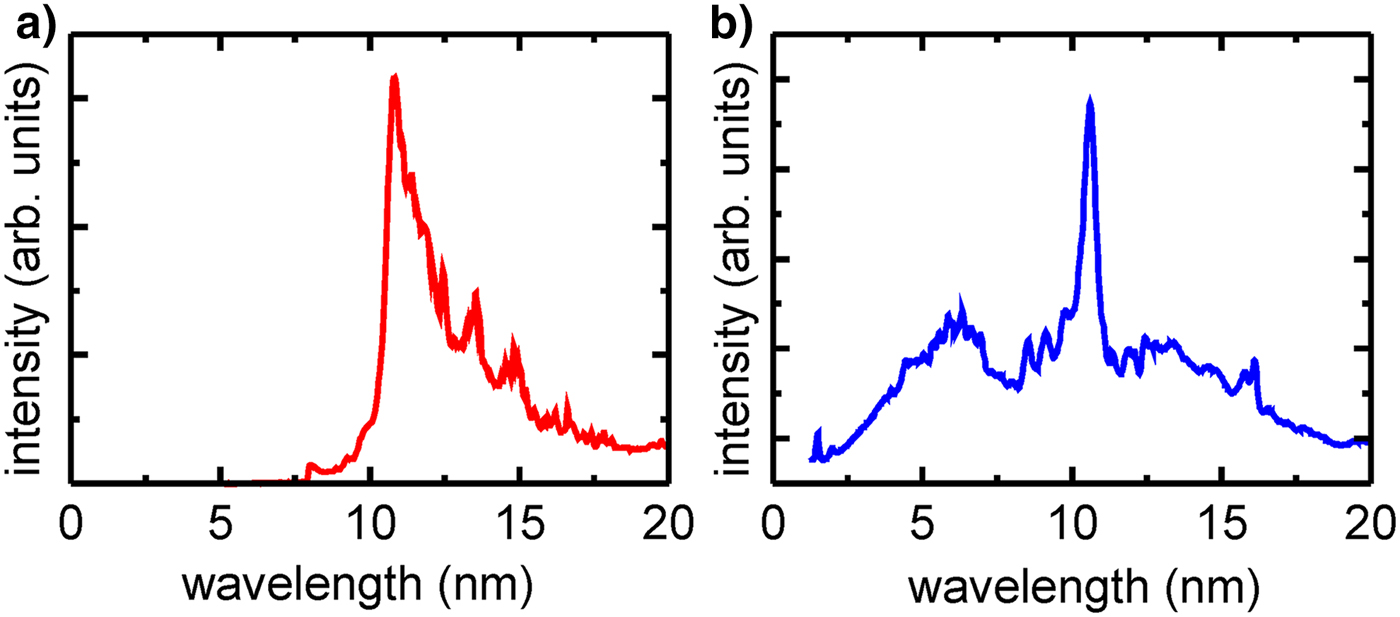
Fig. 2. Spectra of the radiation delivered by the LPP EUV sources employed in two experimental arrangements: (a) system no. 1, Xe plasma radiation reflected from the EUV collector; (b) system no. 2, direct Xe plasma radiation.
Additionally, in case of the system no. 2, temporal measurements of the radiation pulse were performed employing an AXUV-HS1 detector with filters corresponding to various wavelength ranges. Four absorption filters: Zr 250 nm thin foil, CaF2 crystal, BK7, and Schott KG5 glass windows were used for selection of the EUV, UV/VIS/ infrared (IR), VIS/IR, and VIS ranges, respectively. Additionally, a laser line filter for λ = 1064 nm, FWHM = 3 ± 0.6 nm (FL 1064-3, Thorlabs) was employed for detection of the laser scattered light. In Figure 3a, the EUV signal recorded in the wavelength range λ ≈ 6 − 17 nm is presented. Its FWHM τEUV,2 ≈ 15.2 ns is comparable with the pulse width of the driving laser. A temporal dependence for the UV radiation in the wavelength range λ ≈ 0.13 − 0.28 μm was determined by subtraction of the VIS/IR signal from the UV/VIS/IR signal. Its time profile is shown in Figure 3b. The FWHM, in this case, is a little bit longer comparing with the EUV pulse, τUV,2 ≈ 20 ns. Quite different is a temporal profile of the radiation pulse recorded in the VIS range, presented in Figure 3c. An intensity maximum in this case is reached at the time of approximately 150 ns and the signal time decay is 3 µs. As could be expected, except the plasma emission, there is also a small contribution of the scattered laser light (Fig. 3d). Similar measurements were performed also for the irradiation system no. 1. In this case, due to the shorter laser pulse, the EUV and UV pulses were also shorter τEUV,1 ≈ 8 ns and τUV,1 ≈ 17 ns respectively.

Fig. 3. Time profiles of radiation emitted from the laser-produced Xe plasma, recorded in the system no. 2, using the AXUV-HS1 detector with different filters: (a) Zr 250 nm; (b) UV radiation time profile obtained by subtraction of the signal recorded with the BK7 glass from the signal recorded with the CaF2 crystal; (c) Schott KG5 glass; (d) FL 1064-3, Thorlabs.
Spectral investigation of the EUV induced low-temperature plasmas was performed mainly in a UV/VIS range (λ = 200–780 nm), using an Echelle Spectra Analyzer ESA 4000. Its spectral resolution was λ/Δλ ≈ 20 000. To avoid strong radiation from the LPP, a specially prepared metallic plate, shown in Figure 1b, was mounted between the plasma and the spectrograph. Apart from that, the measurements were performed with a temporal resolution which allowed one to register exclusively spectral lines originating from the EUV-induced plasmas, and not from the expanding laser plasmas. Additionally, time-integrated measurements in the EUV range were performed using a toroidal grating spectrograph (TGS, McPherson, Model 251). A spectral range of the spectrograph was λ = 10–95 nm and its resolution for the wavelength λ = 50 nm was approximately λ/Δλ ≈ 500. The spectra were recorded using a back-illuminated CCD detector (Princeton Instruments Inc.) cooled down to a temperature of −65 °C. Due to a lack of the temporal resolution, the spectra were affected by emission lines originating from the expanding LPP.
Experimental results
Irradiation of the nitrogen gas, injected into the vacuum chamber, by intense EUV/SXR radiation resulted in various excited states in neutral or ionic species. Electrons released as a result of photoionization or Auger emission had sufficient energies for further ionization or excitations. It allowed one to create not only molecular, but also atomic ions. Radiative decay of the excited atomic ions resulted in EUV spectra obtained in both experimental configurations. Typical spectra for both cases are presented in Figure 4.

Fig. 4. Time-integrated EUV spectra acquired for low-temperature nitrogen plasmas created using different experimental arrangements: (a) system no. 1, (b) system no. 2.
The spectra contain a few emission lines, corresponding to radiative transitions in N II ions from the excited states 2s 22p3d, 2s 22p4d, and 2s2p 3. There is also a single line corresponding to the 2s 22p–2s 23s transitions in N III ions. As could be expected, in case of the experimental configuration shown in Figure 2b the spectrum contains additionally He I and He II lines, originating from the photoionized He gas surrounding the laser-produced Xe plasma. The relative intensities of the N II lines, obtained using the irradiation system no. 1, shown in Figure 4a, are an order of magnitude higher comparing with the corresponding intensities recorded employing the system no. 2 (Fig. 4b). It should be pointed out, however, that the spectra were acquired by the accumulation of a significantly different number of spectral signals, 4000 and 20, respectively. It means that in fact the N II line emission in the system no. 2 is much higher, over an order of magnitude exceeding the corresponding emission in the system no. 1. This strong difference is partially connected with irradiation of a large area of the N gas stream, in the irradiation system no. 2. Contrary to the system no. 1, in the system no. 2, the irradiated area is not limited by the diameter of the focused EUV beam. In this case, the radiation detected by the EUV spectrograph originates from a few times larger volume of the N plasma comparing to the plasma produced in the system no. 1.
The single and double charged nitrogen ions are created mainly by the EUV photons delivered to the N gas or by electrons released due to the photoionization process. As mentioned above except these ions also molecular ions can be created. Excitation of the molecular species  ${\rm N}_2^{+} $, N2 resulted in molecular spectra in the UV/VIS range. A typical survey emission spectra corresponding to these species, obtained using both irradiation systems are presented in Figure 5.

Fig. 5. A survey emission spectra corresponding to these  ${\rm N}_2^{+}$, N2 species, obtained using different experimental arrangements: (a) system no. 1, (b) system no. 2.
Also, in this case, spectral intensity of the emitted radiation in the system no. 2 exceeded, by over an order of magnitude, the corresponding emission in the system no. 1. What is important, however, that spectral distributions acquired in a wide wavelength range, in both cases do not differ much. Relative intensities of the corresponding, most intense emission bands are almost identical. There are only small differences concerning structures of the corresponding spectral bands. It means that parameters of the N plasmas, created in these two, very different systems, are very similar. Spectral measurements performed for different time delays in respect to the driving EUV pulse, indicating that the spectrum remained almost unchanged during a relatively long time of approximately 200 ns. It suggests that at least partial pLTE (local thermodynamic equilibrium) was achieved and some thermodynamic parameters such as electron, vibrational, and rotational temperatures can be estimated.
Analysis of the spectra was based on the published data (Lofthus & Krupenie, Reference Lofthus and Krupenie1977) and numerical simulations performed using a Specair code (SpectralFit company, France). The spectra contain characteristic features, corresponding to spectral bands of the N2, C 3Πu − B 3Πg, and the  ${\rm N}_2^{+}$,
  $B^2\Sigma _u^ + - X^2\Sigma _g^ + $ electronic systems. A series of Specair simulations indicate that their relative intensities are strongly affected by the electron temperature T e. A good fit to the experimental spectra was obtained for the electron temperature T e = 1860 K. In Figure 6, the corresponding spectrum is presented.
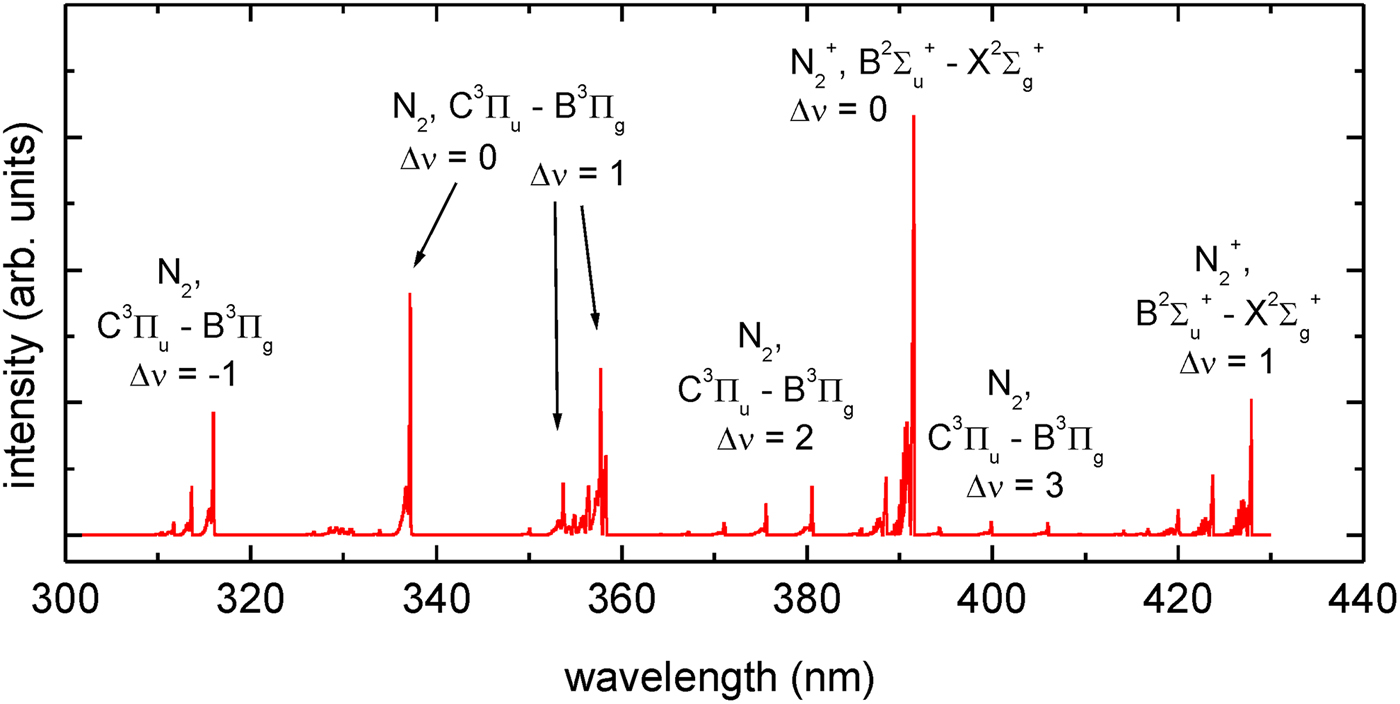
Fig. 6. The molecular spectrum, corresponding to the survey spectra presented in Fig. 5, obtained from numerical simulations performed using the Specair code.
Due to the low resolution, the experimental and calculated spectra depicted in Figure 5, do not allow to present their detailed vibrational–rotational fine structure. The spectra, however, were acquired with much higher resolution, allowing to register this structure. In Figure 7a, a part of the high-resolution spectrum, acquired using the system no. 1, corresponding to the  ${\rm N}_2^{+}$,
  $B^2\Sigma _u^ + - X^2\Sigma _g^ + $, electronic system with Δυ = 1, recorded in the wavelength range λ = 419 − 429 nm, is presented.
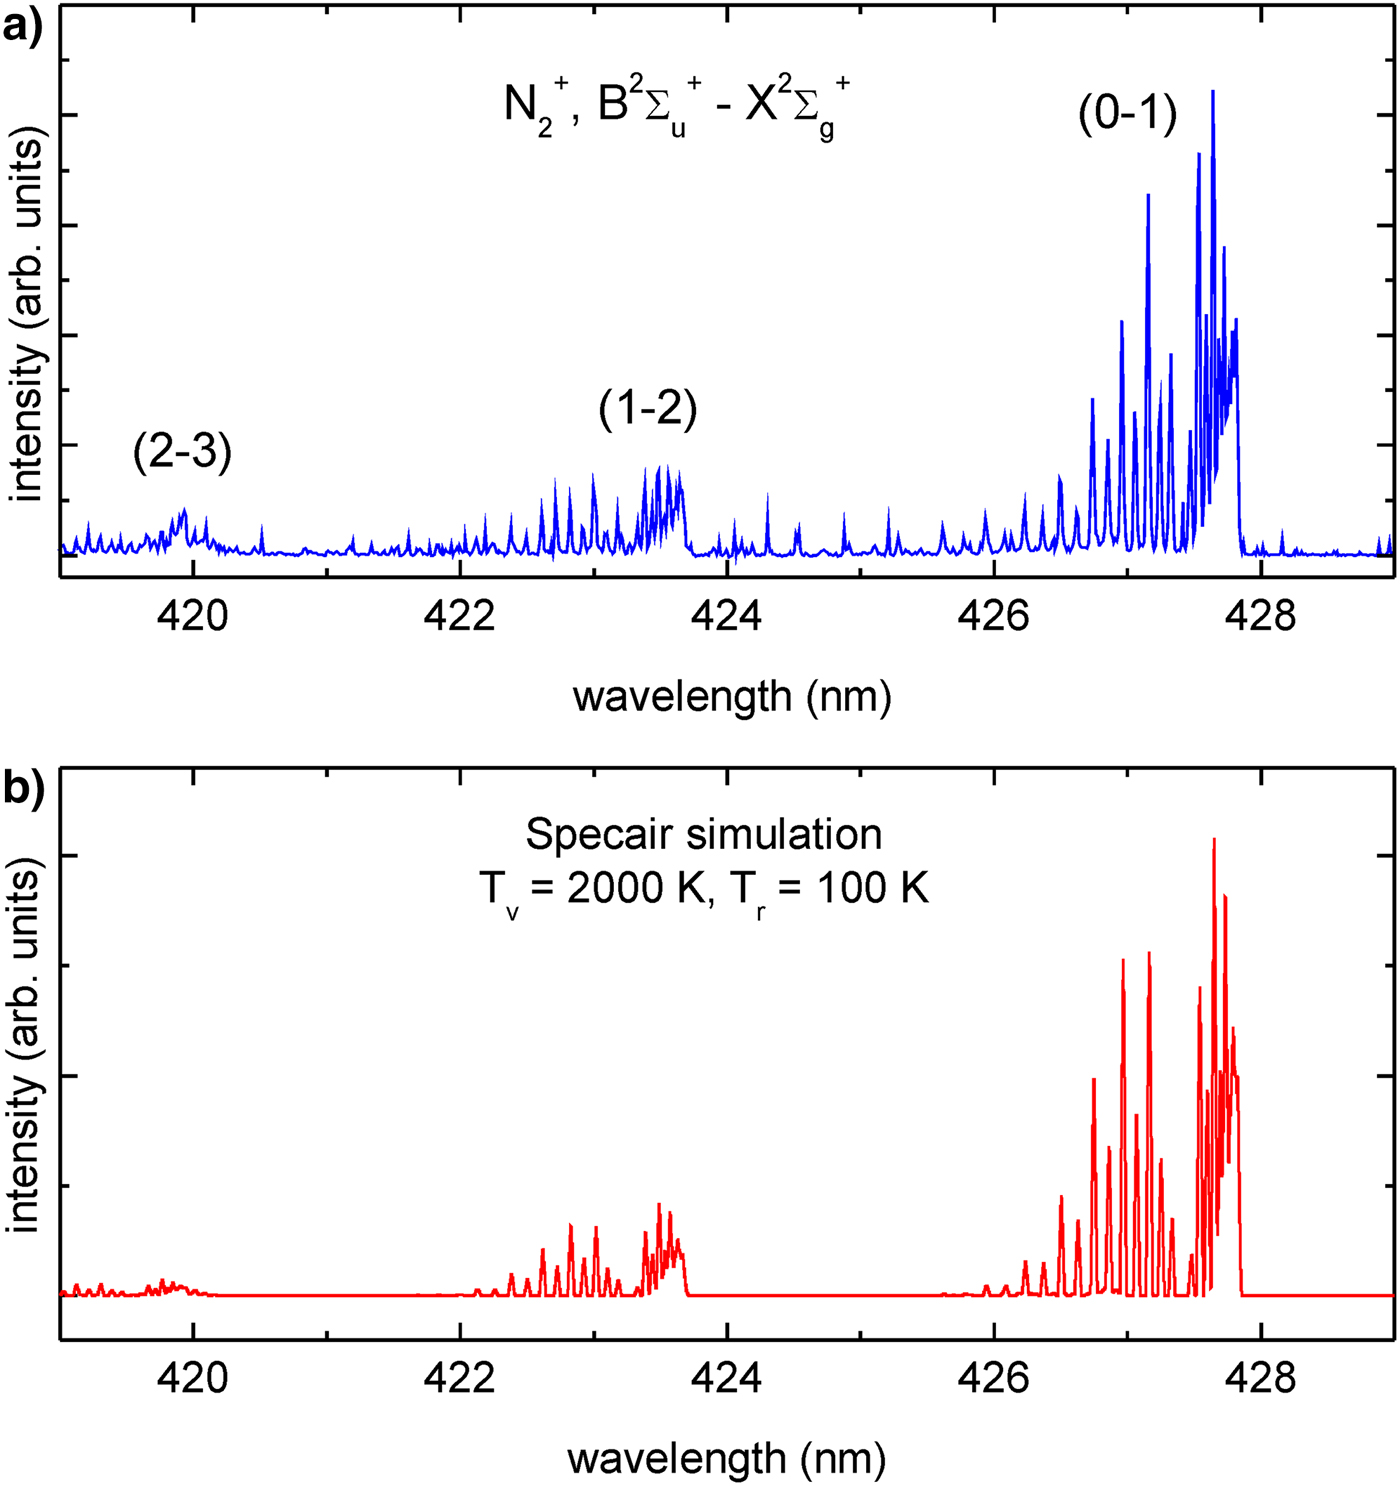
Fig. 7. The high-resolution spectrum corresponding to the  ${\rm N}_2^{+}$,
  $B^2\Sigma _u^ + - X^2\Sigma _g^ + $, electronic system with Δυ = 1: (a) experimental spectrum recorded using the system no. 1, (b) simulated spectrum.
In this case, the vibrational–rotational structure of three emission bands (0–1), (1–2), and (2–3) is clearly visible. Numerical simulations, performed for this part of the nitrogen plasma spectrum, indicate that changes of the vibrational temperature T v affect mainly the relative intensities of the band heads. The rotational temperature T r is responsible for the fine structure connected with the split of the emission bands into the superimposed fine spectrum of rotational states. A comparison of the simulated spectra with the experimental spectrum allowed for estimation of the corresponding temperatures. The best results were obtained for T v ≈ 2000 K and T r ≈ 100 K, respectively. A spectrum obtained for these temperatures is presented in Figure 7b. Analogous simulations and fitting to the experimental spectrum, performed for other bands, gave similar values of the temperatures.
Significantly different vibrational–rotational spectra were obtained from the nitrogen plasmas created using the system no. 2. In Figure 8a, a part of the spectrum recorded in the wavelength range λ = 419 − 429 nm, analogous to the spectrum from Figure 7, is presented. It can be noticed that the intensity ratios of the (1–2) and (2–3) band heads to the (0–1) head intensity are higher, which indicates for the higher vibrational temperature. Significantly different, comparing with the spectrum shown in Figure 7, is also the fine spectrum related to the rotational states. The difference is especially visible at wavelengths close to the band heads. From the numerical simulations, performed using the Specair code, the vibrational and rotational temperatures in this case are T v ≈ 4000 K and T r ≈ 200 K, respectively. The corresponding spectrum is presented in Figure 8b.

Fig. 8. The high-resolution spectrum corresponding to the  ${\rm N}_2^{+}$,
  $B^2\Sigma _u^ + - X^2\Sigma _g^ + $, electronic system with Δυ = 1: (a) experimental spectrum recorded using the system no. 2, (b) simulated spectrum.
The UV/VIS spectrometer, employed in the experiments, allowed for temporal measurements. Such measurements were performed using the irradiation system no. 2. Series of spectra were measured with a 50 ns step. Generally, the shapes of the spectra do not change much; the essential difference concerns their spectrally integrated intensities. In Figure 9a, a temporal dependence of relative intensities of the (0–0) emission bands corresponding to the C 3Πu − B 3Πg and  $B^2\Sigma _u^ + - X^2\Sigma _g^ + $ electronic systems, is presented. The spectra were integrated over a wavelength range λ = 336.98 − 337.2 nm and λ = 391.08 − 391.5 nm, respectively. Such integration performed for consecutive spectra are the experimental points marked in the graphs. As can be noticed, temporal dependences in both cases are very similar, the emission increases within a time of approximately
  $t_{{\rm N}_{\rm 2}} \sim 150\,{\rm ns}$ and decreases during the next 100 ns. The essential difference concerns amplitudes of the time profiles.
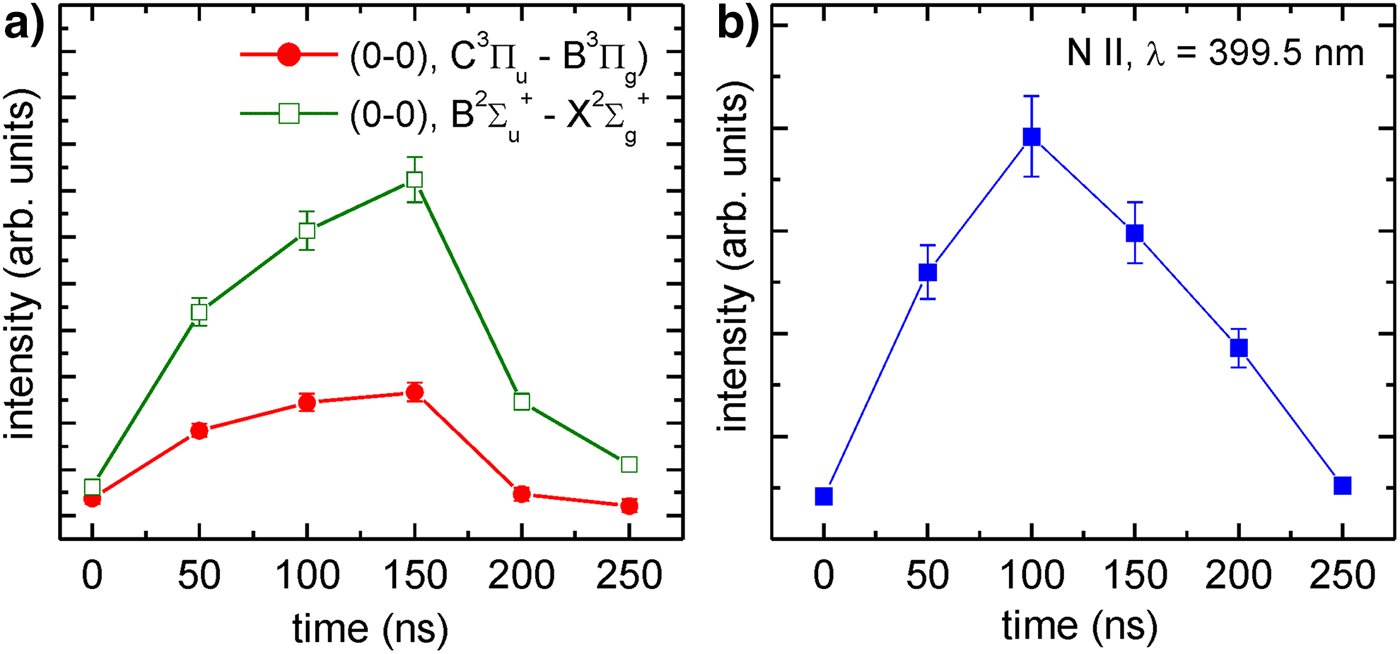
Fig. 9. Temporal dependence of the nitrogen plasma emission measured in the system no. 2: (a) (0–0) emission bands corresponding to the C 3Πu − B 3Πg and  $B^2\Sigma_u^{+} - X^2\Sigma_g^{+}$ electronic systems, (b) emission line corresponding to the
  $2s^22p3s(^1P_{\rm 1}^{\rm o} ) - 2s^22p3p(^1D_2)$ transitions.
It should be noted that the spectra, shown in Figure 5, consist of molecular bands corresponding to N2 and  ${\rm N}_2^ + $ species. There is a lack of N I or N II spectral lines, except a single line at the wavelength of λ = 399.5 nm, corresponding to the
  $2s^22p3s(^1P_1^{\rm o} ) - 2s^22p3p(^1D_2)$ transitions in single-charged ions. According to the NISTFootnote 1 database, this line is the most intense one from the N II lines. Despite this, a spectral intensity of the line is an order of magnitude lower comparing to the molecular lines. In Figure 9b, a temporal dependence of the relative intensity of this line is depicted. A maximum of the intensity, in this case, is earlier compared with the molecular band emission, at the time
  $t_{{\rm N}\;\;{\rm II}}\;\;\sim 100\;\;{\rm ns}$. In both cases, however, the emission time is much longer comparing with the driving EUV pulse presented in Figure 3a.
Temporal measurements were conducted for the fixed distance d = 5 mm between the LPP and the outlet of the nozzle for the nitrogen injection. Additionally, spectral measurements were performed for different distances within the range d = 5 − 20 mm. In Figure 10, three graphs obtained for the spectrally integrated (0–0) emission bands corresponding to the C 3Πu − B 3Πg and  $B^2\Sigma _u^ + - X^2\Sigma _g^ + $ electronic systems and the
  $2s^22p3s(^1P_1^{\rm o} ) - 2s^22p3p(^1D_2)$ spectral line, are presented. It should be pointed out that the distance dependence obtained for the molecular spectra is significantly different compared with the analogous dependence for the individual N II line.
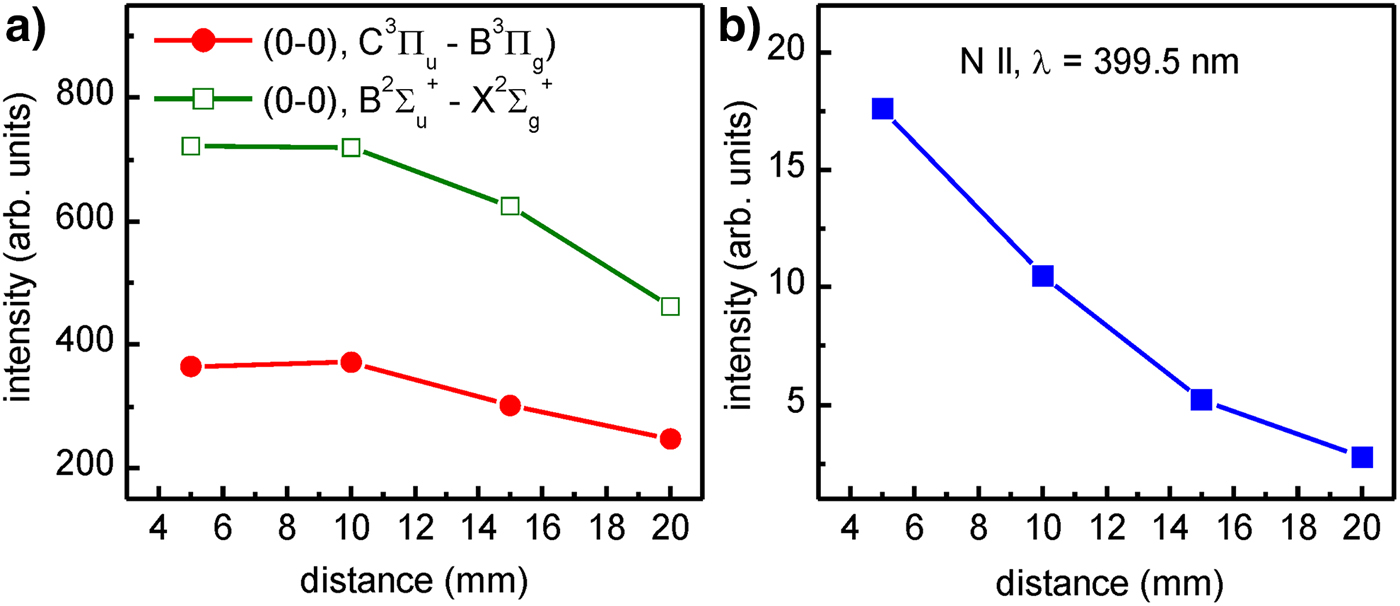
Fig. 10. Spectrally integrated intensities measured for different distances between the laser produced Xe plasma and the outlet of the nozzle for the nitrogen injection: (a) (0–0) emission bands corresponding to the C 3Πu − B 3Πg and  $B^2\Sigma _u^ + - X^2\Sigma _g^ + $ electronic systems, (b) emission line corresponding to the
  $2s^22p3s(^1P_{\rm 1}^{\rm o} ) - 2s^22p3p(^1D_2)$ transitions.
Discussion of the results
Both irradiation systems used in the experimental investigations allow one to create low-temperature plasmas emitting radiation with similar spectral distributions. The most important advantage of using the system no. 1 is a spatial separation of the LPP and the photoionized plasmas. In this case, exclusively the focused EUV beam can ionize the gas injected into the interaction region, hence, induce the low-temperature plasma. The most important disadvantage of this method is a necessity to employ the focusing EUV collector. Such collector is being continuously degraded by plasma and ablation products in case of interaction with some materials. Apart from that, the interaction region is limited to a small volume of approximately 1 mm3. Hence, for some practical applications of low-temperature plasmas created this way it would be reasonable to use the irradiation system without the collector, such as the system no. 2. In this case, additionally to photon-induced processes, other ionization and excitation channels have to be taken into account. One of the possibilities could be the electron impact ionization or excitation by electrons emitted from the laser-produced Xe plasma. These electrons, however, are at least partially absorbed in the He buffer gas surrounding the Xe plasma. The He gas density at a distance 1.5 mm from the nozzle outlet where the Xe plasma is created can be estimated to be n He > 1019 cm−3 at the Xe–He edge (Bartnik et al., Reference Bartnik, Fiedorowicz, Rakowski, Szczurek, Bijkerk, Bruijn and Fledderus2001). A cross-section for an electron impact ionization is σe ≈ 1 − 3 × 10⁻¹⁷ cm2 for energies 103–102 eV, respectively (Ralchenko et al., Reference Ralchenko, Janev, Kato, Fursa, Bray and de Heer2008); hence, the absorption length can be estimated as (σ enHe)−1 < 0.1 mm. Actually, the atomic density is decreasing with a distance from the Xe–He edge; hence, this distance is a few times larger. Nevertheless, contribution of the electrons emitted from the Xe plasma, within the time of the intense EUV emission can be regarded as negligible. On the other hand, the He gas is partially ionized and the released electrons can interact with the N2 gas leading to its ionization or excitation. Another possible channel is connected with the partial mixing of the He and N2 gases during formation of the Xe/He gas puff target and injection of the N2 gas. The EUV irradiation of such a mixture can ionize or excite the He atoms. In this case, molecular nitrogen ions can be generated in the Penning ionization:
 $${\rm H}{\rm e}^{^\ast} + {\rm N}_2 \to {\rm N}_2^ + + {\rm He} + {\rm e}.$$
 Some of the nitrogen ions are in the electronically excited state  ${\rm N}_2^ + \left( {B^2\Sigma _u^ + } \right)$ (Bibinov et al., Reference Bibinov, Fateev and Wiesemann2001), that can decay due to transition:
 $${\rm N}_2^ + (B^2\Sigma _u^ + ) \to {\rm N}_2^ + (X^2\Sigma _g^ + ) + h{\rm \upsilon}. $$
 It should be pointed out, however, that the He admixture into the injected nitrogen was not significant at approximately 200 ns after the EUV driving pulse. A relative spectral intensity of the most intense He I line at the wavelength λ = 587.6 nm was over an order of magnitude smaller compared with the  ${\rm N}_2\;{\rm or}\;{\rm N}_2^ + $ lines. Strong emission lines corresponding to He and Xe species appear after 500 ns. They originate from the expanding laser plasma. An origin of the intense He I lines recorded in the EUV range (Fig. 4b) is the same.
From Figure 9 it can be noticed that maximum of the  ${\rm N}_2\;{\rm or}\;{\rm N}_2^ + $ emission intensity is at the time of approximately 150 ns, much shorter compared with the appearance of the intense Xe and He lines from the expanding LPP. It means that the
  ${\rm N}_2\;{\rm or}\;{\rm N}_2^ + $ emission is not connected with collisional excitation by the Xe/He plasma ions. On the other hand, the emission time of the radiation corresponding to the
  ${\rm N}_2\;{\rm or}\;{\rm N}_2^ + $ species is much longer compared with the EUV or UV driving pulses shown in Figure 3a and 3b, respectively. It suggests that the EUV/UV photons ionize the nitrogen molecules creating
  ${\rm N}\;{\rm I,}\;{\rm N}\;{\rm II,}\;{\rm or}\;{\rm N}_2^ + $ species, which can be subsequently excited by free electrons or photons from the visible range. In case of neutral N2 molecules, they have to be initially excited by the UV photons or electrons with an energy exceeding 7 eV to the metastable B 3Πg state. Further excitation to the C 3Πu state is possible by the electron impact excitation or photoexcitation with visible or near-ultraviolet (NUV) light. Similarly, emission of the N II line at the wavelength λ = 399.5 nm is connected with the spontaneous transition to the metastable
  $2s^22p3s(^1P_1^{\rm o} )$ state that can be re-excited by free electrons or photons from the VIS range. In all these cases the EUV/UV radiation pulse, with the time duration of 10–20 ns, is necessary only for initial ionization of the N2 molecules or excitations to the metastable states. Further excitations followed by the spontaneous emission are induced by free electrons or NUV photons. Temporal measurements performed employing the system no. 1, where the laser-produced and the photoionized plasmas could not interfere, gave similar results. It confirms that in both cases, the main mechanisms of the low-temperature plasma formation, were similar.
Some difference between plasmas created using these two irradiation systems concerns the molecular spectra. Although the survey UV/VIS spectra are very similar, structures of the emission bands obtained for nitrogen plasmas created using both systems, are significantly different, as well as vibrational and rotational temperatures, determined from the numerical simulations of the recorded spectra. The corresponding temperatures are approximately two times higher in case of the irradiation system no. 2. This can be connected with the contribution of additional mechanisms of ionization and excitation of the N2 molecules described above.
Important results concern the measurements performed using the system no. 2 for different distances between the Xe/He plasma and the N2 gas injected into the vacuum chamber. The results presented in Figure 10a indicate that spectrally integrated emission, corresponding to the selected bands of the  ${\rm N}_{\rm 2}\;{\rm and}\;{\rm N}_2^ + $ species, does not change with the distance, as much as could be expected. On the other hand, a strong decrease of the relative intensity with the distance concerns the N II emission (Fig. 10b). It means that for production of the
  ${\rm N}_{\rm 2}\;{\rm and\;} \;{\rm N}_2^ + $ molecular species, the intensity of the driving radiation is close to the optimum: further intensity increase can result in higher ionization degree, hence, a decrease of the molecular emission.
Based on the experimental results, some advantages and disadvantages of both systems can be formulated. The most important advantage of using the system no. 1 is a good spatial separation between the laser produced and the photoionized plasmas. In such case, conditions of the photoionized plasma creation are well defined. Apart from that, spectra obtained for these plasmas, are not affected by the LPP radiation. The most important disadvantage of this system is the necessity of employing the expensive focusing collector which is continuously degraded. This results in a continuous decrease of the EUV fluence in the focal area. Such problem can be eliminated using the irradiation system no. 2. The irradiation conditions, in this case, are not changing with time. On the other hand, conditions of the low-temperature plasma creation are not so clear. Additional influence of the electron or ion streams emitted from the LPP should be considered. Nevertheless, parameters of the low-temperature plasmas created in both systems are similar; hence, for some applications the simpler system (system no. 2) can be employed.
Summary
In this work results of investigations of low-temperature plasmas produced by ionization of the N2 gas with intense EUV radiation pulses, are presented. Experiments were performed employing two different irradiation systems based on LPP EUV sources. One of them was equipped with the EUV collector, allowing to form the focused radiation beam, the second one was used without any optics. The N2 gas was delivered into the interaction region synchronously with the ionizing pulses. The resulting low-temperature plasmas were investigated using the EUV and UV/VIS spectroscopy. Emission lines corresponding to excited states in singly charged ions, molecular ions, and neutral molecules were detected. Additionally, the temporal evolution of the emission from ionic and molecular species was presented. It was shown that the lifetime of the EUV induced plasma is an order of magnitude longer comparing to the time duration of the driving pulse. Numerical simulations of the molecular spectra allowed one to determine vibrational and rotational temperature of the nitrogen plasma. It was shown that in both cases plasmas of similar parameters can be produced.
Acknowledgements
This work was supported by the National Science Centre, Poland, grant agreement no. UMO-2016/23/B/ST7/00949, and partially by European Union's Horizon 2020 Programme (LASERLAB-EUROPE) grant agreement no. 654148.


