


Introduction
A growing literature suggests that DSM-IV alcohol abuse and dependence criteria (and other alcohol-related behaviors) fall along a single underlying continuum of alcohol involvement (e.g. Kahler & Strong, Reference Kahler and Strong2006; Proudfoot et al. Reference Proudfoot, Baillie and Teesson2006; Saha et al. Reference Saha, Chou and Grant2006). In recent years, researchers have noted the lack of criteria assessing the less severe end of the continuum (Langenbucher et al. Reference Langenbucher, Labouvie, Martin, Sanjuan, Bavly, Kirisci and Chung2004) and have suggested adding specific patterns of drinking or indicators of alcohol consumption to our conceptualization of alcohol use disorders (AUDs; Saha et al. Reference Saha, Chou and Grant2006, Reference Saha, Stinson and Grant2007; Li et al. Reference Li, Hewitt and Grant2007). Results from general population item response theory (IRT) studies have indicated that consumption variables may be well suited to measure this region. Whereas most research has focused largely on the 5 + /4 + (Wechsler & Austin, Reference Wechsler and Austin1998) conceptualization of heavy episodic drinking (HED) (Saha et al. Reference Saha, Stinson and Grant2007; Hasin & Beseler, Reference Hasin and Beseler2009; Beseler et al. Reference Beseler, Taylor and Leeman2010; Borges et al. Reference Borges, Ye, Bond, Cherpitel, Cremonte, Moskalewicz, Swiatkiewicz and Rubio-Stipec2010), indices of drinking ‘too much too fast’ also have been examined. These indices, which include high-level HED [12 or more drinks/occasion (Borges et al. Reference Borges, Ye, Bond, Cherpitel, Cremonte, Moskalewicz, Swiatkiewicz and Rubio-Stipec2010); 20 or more drinks/occasion (Krueger et al. Reference Krueger, Nichol, Hicks, Markon, Patrick, Iacono and McGue2004)] as well as alternate thresholds for frequent HED (Krueger et al. Reference Krueger, Nichol, Hicks, Markon, Patrick, Iacono and McGue2004; Saha et al. Reference Saha, Stinson and Grant2007; Kahler et al. Reference Kahler, Strong, Papandonatos, Colby, Clark, Boergers, Niaura, Abrams and Buka2008), also tend to fall towards the less severe region (although with greater severity than the 5 + /4 + HED measure). Several investigations have modeled indices of ‘too much too often’, generally assessed using a frequency measure [e.g. drinking on a weekly basis (Kahler et al. Reference Kahler, Strong, Papandonatos, Colby, Clark, Boergers, Niaura, Abrams and Buka2008, Reference Kahler, Hoeppner and Jackson2009); drinking on a monthly basis or daily basis (Kahler et al. Reference Kahler, Hoeppner and Jackson2009)]; these items tend to have severity estimates similar to measures of alcohol-related consequences. Finally, some studies find that items reflecting subjective effects, such as getting drunk, can be scaled along the same continuum of alcohol involvement (Krueger et al. Reference Krueger, Nichol, Hicks, Markon, Patrick, Iacono and McGue2004; Kahler et al. Reference Kahler, Hoeppner and Jackson2009), although drunk is lower in severity than 5 + /4 + HED and hence is perhaps less informative than other measures of consumption. This body of literature is largely based on IRT modeling techniques such as two-parameter IRT and one-parameter Rasch models (Rasch, Reference Rasch1960; Birnbaum, Reference Birnbaum, Lord and Norvick1968; Wright & Masters, Reference Wright and Masters1982) that presuppose an underlying latent continuum (and this is generally verified by support for a one-factor structure). Thus, there is evidence to support a single continuum of alcohol involvement, with (non-extreme) consumption indictors located within the lower end of the dimension.
An alternate possibility is that alcohol involvement is best characterized by discrete subtypes of users. Yet, research using latent class analysis (LCA) also has supported a severity gradient underlying alcohol dependence and abuse (Heath et al. Reference Heath, Bucholz, Slutske, Madden, Dinwiddie and Dunne1994; Bucholz et al. Reference Bucholz, Heath, Reich, Hesselbrock, Kramer, Nurnberger and Schuckit1996; Chung & Martin, Reference Chung and Martin2001). That is, empirically derived ‘types’ or classes of AUDs/problems tend to differ among each other based upon increasing likelihood of endorsing all symptoms and not qualitatively distinct configural differences (e.g. with some types being high on variable x but low on variable y with another low on variable x and high on variable y). However, despite the large number of these studies using LCA and other empirical, categorical approaches to diagnosis, relatively few typological studies have incorporated consumption measures. This is somewhat surprising in that proposed clinical subtypes (e.g. Jellinek, Reference Jellinek1960) viewed consumption patterns in the context of symptoms of dependence (e.g. inability to abstain, loss of control). A meaningful question is whether there is further information in the subtyping of alcohol involvement that can be gleaned with the addition of consumption indicators. Several recent studies have examined this idea using data from National Epidemiologic Survey of Alcohol and Related Conditions (NESARC). Keyes et al. (Reference Keyes, Geier, Brant and Hasin2009) found that adding a measure of at-risk drinking (HED; 5 + /4 + drinks/occasion) as an additional (eighth) criterion to DSM-IV alcohol dependence [or as a twelfth criterion to AUD (abuse and dependence)] would result in an increase in prevalence of corresponding diagnosis, suggesting that information can be gained from including a measure of alcohol consumption. Additionally, Sacco et al. (Reference Sacco, Bucholz and Spitznagel2009) used LCA to examine profiles of alcohol involvement among older adults (age 60 years and older) who were current drinkers; they included 11 items reflecting past-year symptoms of DSM-IV alcohol abuse/dependence as well as two consumption items (more than seven drinks per week and more than five drinks/occasion) that had been defined as indicators of risky drinking in older adults. Based on endorsement of these 13 indicators, the latent classes represented levels of severity, although the greatest distinction between the low-risk and moderate-risk groups was the consumption item > 7 drinks/week.
Thus, although there is evidence that measures of alcohol consumption, dependence and abuse may be valid indicators of qualitatively different subtypes, they also seem to fall along a continuum of alcohol involvement. The present study attempts to resolve this issue by the use of factor mixture models (FMMs), a relatively new class of analytic models, that permit the researcher to make comparisons about the extent to which a given behavior is dimensional versus categorical (Lubke & Muthén, Reference Lubke and Muthén2005; Clark et al. Reference Clark, Muthén, Kaprio, D'Onofrio, Viken, Rose and Smalley2009). These models are based on an overarching framework, the dimensional–categorical spectrum, which posits that latent structures of psychological constructs are at once both categorical and continuous (Masyn et al. Reference Masyn, Henderson and Greenbaum2010). Thus, FFMs are a hybrid of latent class and common factor models, and population heterogeneity is captured simultaneously by continuous and categorical latent variables. Whereas latent class models assume no within-class variability, the FMM allows for within-class variation in the intensity of the behavior through the use of one or more continuous latent variables. In contrast, in common factor analysis (FA), item covariation is modeled along one or more underlying continuous dimensions (factors), assuming a homogeneous population. Competing FA, LCA and FMM models can be compared using standard model fit indices.
FMMs have been applied to abuse and dependence criteria for alcohol, tobacco, cannabis and prescription opioid use (Muthén, Reference Muthén2006; Muthén & Asparouhov, Reference Muthén and Asparouhov2006; Kuo et al. Reference Kuo, Aggen, Prescott, Kendler and Neale2008; Baillie & Teesson, Reference Baillie and Teesson2010; McBride et al. Reference McBride, Teesson, Baillie and Slade2011; Wu et al. Reference Wu, Woody, Yang, Pan and Blazer2011; Gillespie et al. Reference Gillespie, Neale, Legrand, Iacono and McGue2012). Findings are mixed with regard to whether the fit of hybrid FMM is superior to LCA and FA models. Two studies examining symptoms of alcohol and cannabis use disorders (Baillie & Teesson, Reference Baillie and Teesson2010) and cannabis use disorder (Gillespie et al. Reference Gillespie, Neale, Legrand, Iacono and McGue2012) reported no improvement in fit for categorical latent class analysis nor FFMs combining continuous and categorical parameters compared with continuous factor analysis models (concluding the existence of a single latent factor). Using a nationally representative Australian sample, McBride et al. (Reference McBride, Teesson, Baillie and Slade2011) applied these models to lifetime AUD criteria, as well as three items assessing HED. They found the best model to be a simple structure one-factor model of AUD severity. Together, the results of these studies suggest that indices of alcohol and cannabis abuse and dependence can be considered as dimensional, with the disorders arrayed along a dimension of severity.
In contrast, other studies report superior fit for FFMs over models with solely categorical or continuous latent variables. Using NESARC data, Muthén & Asparouhov (Reference Muthén and Asparouhov2006) demonstrated that symptoms of tobacco dependence were best captured by a unidimensional three-class FMM, including a normative zero class and two non-zero classes that differed in severity, relative to both LCA and factor analysis (IRT)Footnote 1 Footnote † models. Similarly, Kuo et al. (Reference Kuo, Aggen, Prescott, Kendler and Neale2008) found that a FMM of alcohol dependence with one underlying factor and three classes had superior fit over both LCA models and factor models. Wu et al. (Reference Wu, Woody, Yang, Pan and Blazer2011) showed that symptoms of abuse and dependence of prescription opioids were best captured by a two-class FMM that included a severely affected group and a less severely affected group. Finally, Muthén (Reference Muthén2006) compared LCA, FA and FMMs, as well as latent class factor analysis models (LCFA; models which allow for class differences in the severity of the underlying factor) using NESARC data, for the 11 alcohol dependence and abuse criteria (but no indices of consumption). A two-class single-factor FMM showed the best fit, although the LCFA with no within-class variability and class-invariant thresholds also showed good fit.
Based on the body of work supporting typologies of alcohol involvement, we expected to observe several distinct subtypes. As noted by Keyes et al. (Reference Keyes, Geier, Brant and Hasin2009), the inclusion of alcohol consumption indicators in our models may create more etiologically heterogeneous diagnoses. However, based on prior research showing a severity gradient to latent classes of AUD, we also expected to detect within-class variation in alcohol involvement severity that was captured by a factor structure. Given that unaccounted for covariation within the class structure can be modeled by a continuous latent variable, we would expect to detect a smaller number of classes in a FMM than a LCA model, but with the inclusion of alcohol consumption measures, we expected to find more than the two classes observed by Muthén (Reference Muthén2006).
Overview
The present study uses data from both waves of the NESARC study to test and compare continuous, categorical and hybrid models of past 12-month alcohol involvement based on three types of indicators of alcohol involvement: alcohol dependence, alcohol abuse and alcohol consumption. By including the latter, it extends the work by Muthén (Reference Muthén2006) that examined the structure of alcohol dependence and abuse in NESARC data. We also extended prior work by McBride et al. (Reference McBride, Teesson, Baillie and Slade2011) by using current (12-month) AUD criteria rather than lifetime criteria, in order to ensure that drinking patterns and problems reflected the same 12-month time period, and to permit use of wave 2 data (in which repeat lifetime data were not collected) for replication. Our study also extends the Muthén (Reference Muthén2006) study in that it replicates our models using data from wave 2 of NESARC. We also examined the stability of class membership and change on the dimension within a class across waves.
Method
Participants and procedure
The sample consisted of participants in the 2001–2002 NESARC (Grant et al. Reference Grant, Moore and Kaplan2003) study, a national, population-based face-to-face interview of 43093 non-institutionalized US citizens aged 18 years and older. Participants were sampled according to 2000–2001 census data, although young adults (aged 18–24 years) and blacks and Hispanics were oversampled by design; the data set was weighted to account for oversampling and non-response (see Grant et al. Reference Grant, Moore and Kaplan2003). The response rate was 81.0% for wave 1 and 86.9% for wave 2 (calculated among those eligible for re-interview). At wave 2 (2004–2005), attempts were made to re-contact and re-interview participants; a total of 34653 individuals provided wave 2 data (80.4% of the original sample of 43093 individuals).
For the present study, we excluded lifetime abstainers (4660 who reported never having consumed alcohol at both wave 1 and wave 2; 10.8%), and given our interest in characterizing past 12-month patterns of alcohol involvement at each assessment, we also removed participants who did not consume alcohol in the prior 12 months at both wave 1 and wave 2 (an additional 4879 at wave 1; 11.1%), resulting in a final sample size of 33644 at wave 1Footnote 2 . The final sample size at wave 2 (excluding lifetime abstainers and those who did not report past 12-month drinking at both wave 1 and wave 2) was 25186.
Lay interviewers from the US Bureau of Census conducted door-to-door interviews (see Grant et al. Reference Grant, Moore and Kaplan2003, for more information about the study procedures). Data were collected using computer-assisted personal interviewing techniques that were programmed with automatic skip outs and consistency checks.
Measures
Demographics
Gender, race/ethnicity and age were assessed in the wave 1 interview. The sample composition, weighted to reflect the US population rates, was 50.1% male and the racial groupings used for the purposes of this study were white, non-Hispanic (72.5%), black, non-Hispanic (10.5%), American Indian/Alaska Native, non-Hispanic (2.1%), Asian/Native Hawaiian/Pacific Islander, non-Hispanic (3.8%), and Hispanic or Latino, any race (11.1%). Age was categorized as follows: age 18–20 years (5.9%); age 21–24 years (7.3%); age 25–29 years (9.1%); age 30–39 years (20.6%); age 40–49 years (21.3%); age 50–59 years (15.7%); and age 60 + years (20.2%).
Assessment of alcohol involvement
Past 12-month alcohol abuse and dependence criteria were measured through a structured interview, the Alcohol Use Disorders and Associated Disabilities Interview Schedule-DSM-IV Version (AUDADIS-IV; Grant et al. Reference Grant, Dawson and Hasin2001). The AUDADIS-IV, designed for lay interviewers, includes multiple items for each abuse and dependence criterion. In all, seven dependence criteria were assessed, corresponding to larger/longer; tolerance; persistent desire to cut down or quit or being unable to do so; continued use despite physical or psychological problems; withdrawal; spend lots of time drinking or recovering; give up important activities to drink. The four abuse criteria included hazardous drinking; continue to drink despite interpersonal problems; interfered with roles; legal troubles.
We also included five indicators of past 12-month alcohol consumption. Three of the indicators were derived from a four-level variable reflecting frequency of use – drinking on a daily or nearly daily basis, drinking on a weekly basis, drinking on a monthly basis. In addition, a variable reflecting HED was coded as positive if the respondent endorsed ever drinking five or more drinks per occasion (men) or four or more drinks per occasion (women). Finally, we included a binary variable reflecting whether the respondent ever got drunk. The three frequency indicators were treated as a categorical four-level variable in analyses (corresponding to daily, weekly, monthly, and less than monthly), although we conceptualize them as three indicators of drinking frequency. Table 1 presents the items and their weighted prevalence rates for waves 1 and 2.
Table 1. Description of items and weighted prevalence rates at waves 1 and 2
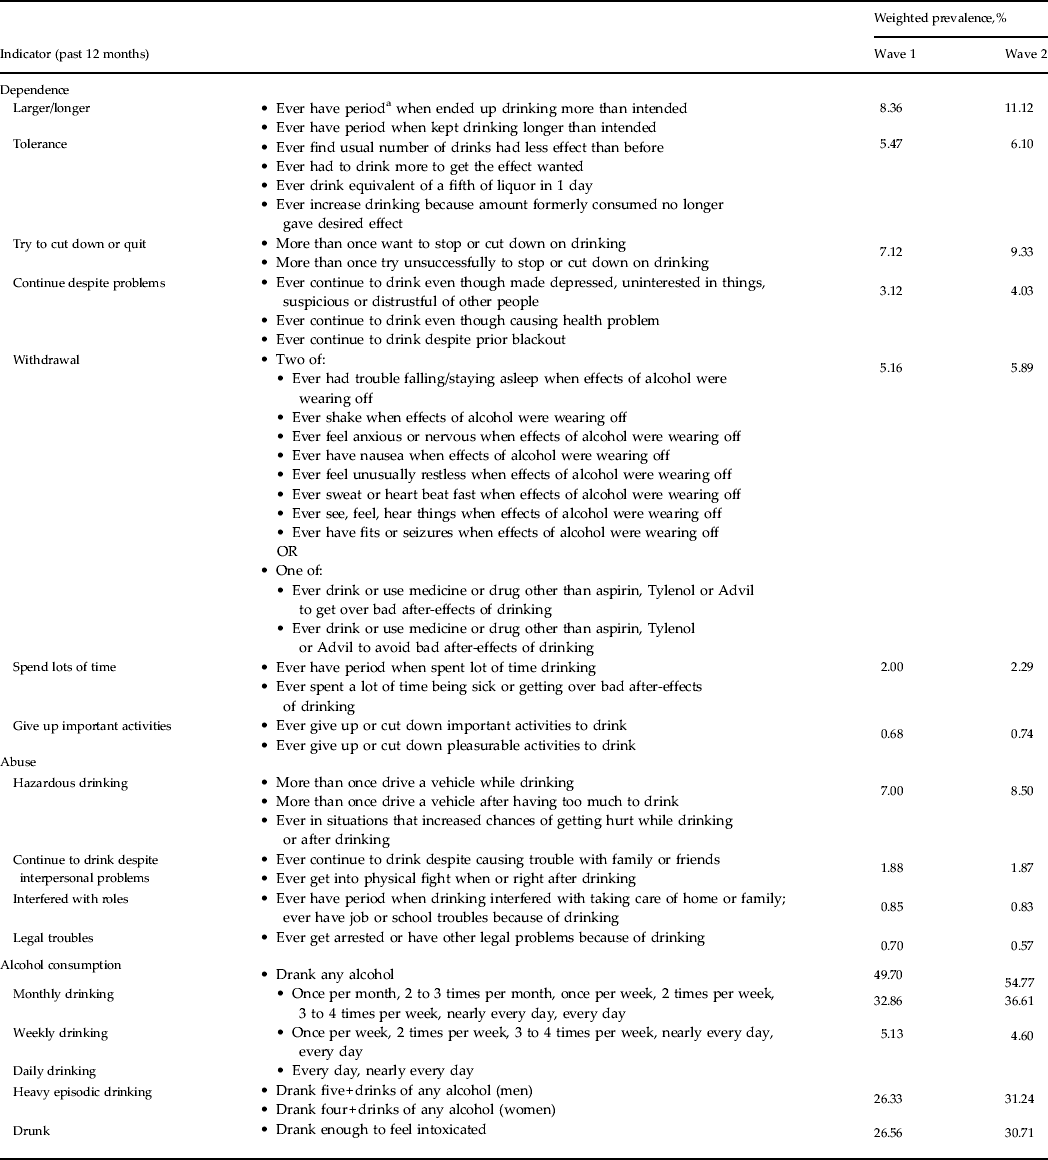
a In the past 12 months.
Analytic strategy
FA
The first step of our model comparison procedure was to conduct exploratory factor analysis (EFA). We conducted EFA using maximum likelihood estimation with a Geomin rotated function (Cudek & MacCallum, Reference Cudeck and MacCallum2007; Schmitt, Reference Schmitt2011).
LCA
Next, we explored the structure of the data using LCA (Bartholomew, Reference Bartholomew1987; McCutcheon, Reference McCutcheon1987), which identifies discrete, error-free latent variables (classes) underlying the observed data. In LCA, mutually exclusive discrete latent variables, or classes, are extracted from two or more discrete observed variables. In the present case, the latent classes are particular subtypes or groups of people who display similar patterns of endorsement across the indices of alcohol involvement. The parameters produced in a latent class solution include class membership probabilities, which reflect the proportion of individuals who are categorized in a given class, and item endorsement probabilities, which represent the probability of endorsement of a specific item given membership in a particular class.
FMMs
Finally, we conducted FMMs, a model that synthesizes EFA and LCA. As with LCA, the model parameters include class membership probabilities and item endorsement probabilities; additional parameters include factor means and variances. We adopted a strategy for selection of FMMs based on Clark et al. (Reference Clark, Muthén, Kaprio, D'Onofrio, Viken, Rose and Smalley2009), who provide guidelines for selecting and interpreting FMMs. Our model-building process was comprised of three models, beginning with a less restrictive model and moving to more restrictive (and typically computationally intensiveFootnote 3 ) models. Note that a FMM translates to a traditional LCA model when the factor (co)variance is zero. Likewise, when using categorical manifest variables, a FMM with one latent class translates to a factor analytic model (Clark et al. Reference Clark, Muthén, Kaprio, D'Onofrio, Viken, Rose and Smalley2009).
The first model is the latent class factor analytic (LCFA) model (FMM1). As with LCA, there is no within-class variability, but this model permits the factor mean to vary across classes. With LCFA models, it can be tested whether class differences arise due to having different amounts of a given behavior. The second model (FMM2) estimates factor variances, constrained to be equal across class, and permits item thresholds to vary across class (i.e. weak factorial invariance). In this model, the classes are based on the responses to those items rather than the differences in the underlying factor, where the items are assumed to measure a different construct for each of the classes. The third model (FMM3) permits the factor loadings to vary across class, indicating that the severity dimension is not being measured the same way across all classes, violating the assumption of factorial invariance (e.g. the indices of alcohol consumption may define the factor to a greater degree in one class versus another)Footnote 4 .
Model estimation
Models were estimated using Mplus version 7.0 (Muthén & Muthén, 1998–2012). Models were run with (at minimum) automatically generated random start values with 100 initial-stage random sets of starting values and 10 final-stage optimizations, using full information maximum likelihood estimation to account for missing data, which were assumed to be missing at random.
Model fit was evaluated with reference to the Bayesian information criterion (BIC; Schwarz, Reference Schwartz1978) fit index. For LCA and FMM analyses, we also examined a likelihood ratio test for relative improvement in fit, the Vuong–Lo–Mendell–Rubin test (VLMR; Lo et al. Reference Lo, Mendell and Rubin2001).
Because two waves of NESARC were available for analysis, we also considered the replicability of solutions across waves by conducting a parallel set of analyses for wave 2 data. In addition, we evaluated the stability of the best-fitting model over time.
Results
We conducted our analyses in three steps: (1) factor analysis; (2) latent class models; and (3) FFMs. This was done using wave 1 data and replicated using wave 2 data.
Model estimation with wave 1 data
FA
We conducted EFAs for one- through to four-factor solutions (the five-factor solution failed to converge). The two-, three- and four-factor models yielded factor structures that were difficult to interpret or factors that were so highly correlated that there was no clear discrimination of factors. In the four-factor solution, two factors were characterized by only singleton indicators (tolerance for one factor, legal troubles for the other). Similarly, in the three-factor solution, one factor was characterized only by tolerance, and there were cross-loadings for HED and drunk in the other two factors. Finally, in the two-factor solution, the correlation between the two factors was very high (r = 0.88). Eigenvalues also supported a one-factor solution (λ 1 = 9.70, λ 2 = 0.82, λ 3 = 0.64, λ 4 = 0.55, λ 5 = 0.43). In sum, findings from this analysis suggest that meaningful factors cannot be defined, and that a single factor is sufficient for describing variability in the continuum of alcohol involvement. Factor loadings ranged from 0.78 (cut down) to 0.93 (interfered with roles), with the exception of the four-level frequency variable (λ = 0.68). Our FMM models proceed from this decision to use a one-factor modelFootnote 5 .
LCA
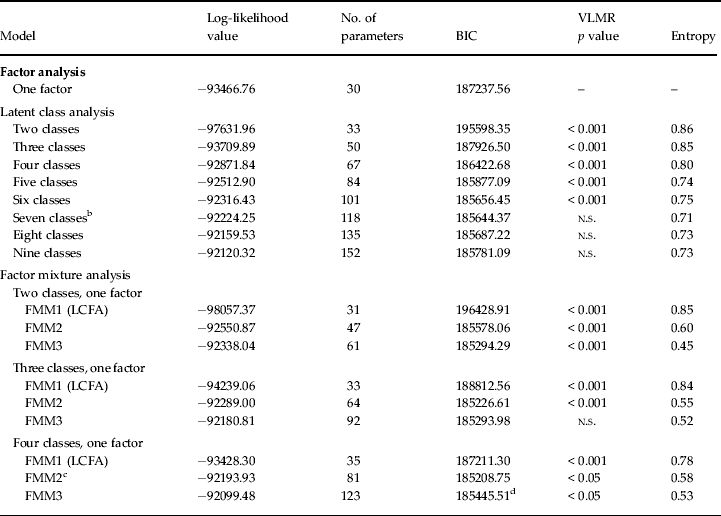
We examined two- through to nine-class LCA solutions. The seven-class solution was best according to both the BIC and the VLMR test (see Table 2). The pattern of endorsement probabilities for each class are as follows: infrequent drinkers (57%); regular moderate drinkers (16%); non-dependent heavy drinkers (11%); minimally dependent risky drinkers (9%); low dependent drinkers (4%); moderate dependent drinkers (16%); high dependent drinkers (1%). Both infrequent and regular moderate drinkers had very low probabilities of endorsing the dependence and abuse criteria and low probability of getting drunk. The regular moderate drinkers had moderate probability (p = 0.40) of engaging in HED, moderate probability (p = 0.60) of consuming alcohol on a weekly basis and high probability of consuming alcohol on a monthly basis. In contrast, the infrequent drinkers had a moderate probability of consuming alcohol on a monthly basis but very low probabilities of HED, getting drunk, or drinking more frequently than monthly. The non-dependent heavy drinkers looked very similar to the regular moderate drinkers in terms of criteria endorsement but had a greater likelihood of engaging in HED and a very high likelihood of getting drunk. The minimally dependent risky drinkers had high probability of HED, getting drunk, and regular (weekly and monthly) drinking, and had low (but non-zero) likelihood of endorsing many alcohol dependence criteria (particularly larger/longer, but also tolerance, cut down and withdrawal) and the alcohol abuse criterion of hazardous use. The low, moderate and heavy dependent drinker groups each showed endorsement of the dependence and abuse criteria, with an elevation in severity gradient but little variation in pattern of endorsement. Consumption did not appear to differentiate these groups; however, abuse criteria did.
Table 2. Model fit comparisons of factor analysis, latent class analysis and factor mixture models of alcohol consumption, dependence and abuse indicators for wave 1 NESARC data a
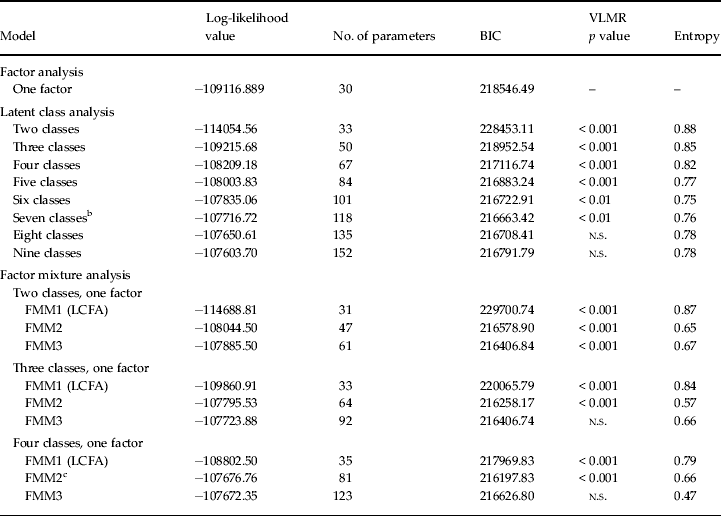
NESARC, National Epidemiologic Survey of Alcohol and Related Conditions; BIC, Bayesian Information Criterion; VLMR, Vuong–Lo–Mendell–Rubin test of relative improvement in fit; n.s., non-significant; FMM, factor mixture model; LCFA, latent class factor analysis.
a n = 33644.
b The seven-class solution was best according to both the BIC and the VLMR test.
c The four-class second model (FMM2) was the best-fitting model according to the BIC.
FMMs
We estimated three FFMs, as laid out in the analytic strategy, for two-, three- and four-class solutions (see Table 2)Footnote 6 . The four-class second model (FMM2) was the best-fitting model according to the BIC (BIC = 216197.83) and the VLMR test indicated that the four-class FMM2 model fit significantly better than the three-class FMM2 model (p < 0.001). Additionally, entropy, a measure of the average highest predicted probability of class membership that signifies the extent to which a model is effectively distinguishing individuals (with values near 1.0 indicating high certainty in classification), was higher for the four-class solution than the three-class model (0.66 v. 0.57). Thus, we selected the four-class FMM2 model; Fig. 1 portrays endorsement probabilities for each class. The four classes can be described as follows: infrequent drinkers (52%); regular moderate drinkers (23%); minimally dependent drinkers (16%); and alcohol use disordered drinkers (9%). As with the LCA, the infrequent drinkers were characterized primarily by monthly consumption of alcohol, and the regular moderate drinkers again displayed moderate probability of engaging in HED and consuming alcohol on a weekly basis and high probability of consuming alcohol on a monthly basis. In contrast to the classes identified by LCA, the alcohol use disordered drinkers were primarily characterized by very high endorsement of hazardous use and low to moderate endorsement of dependence criteria. The minimally dependent drinkers were very similar to the alcohol use disordered drinkers in consumption, but showed lower endorsement of dependence criteria and near zero endorsement of hazardous use and other abuse criteria.
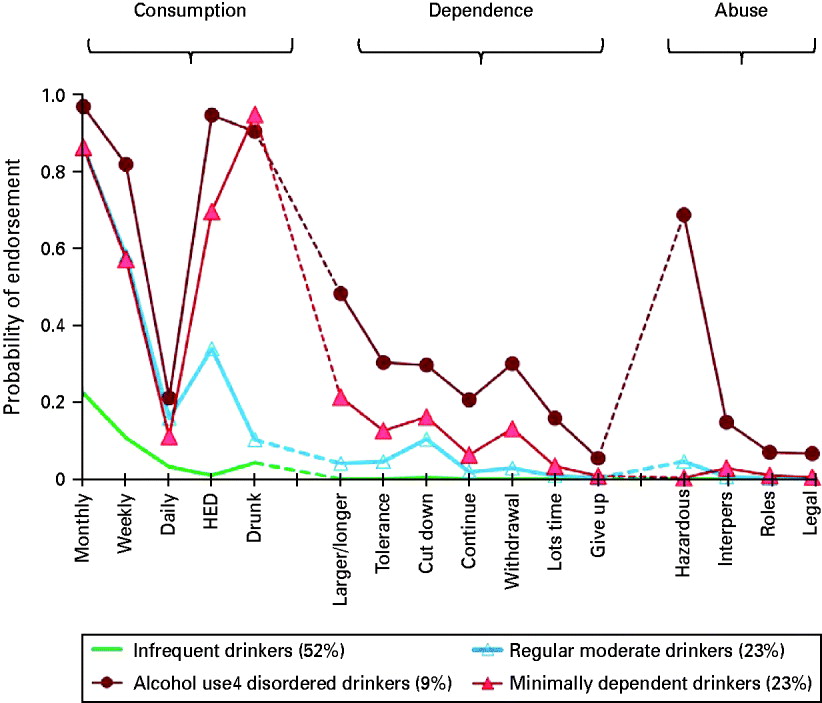
Fig. 1. Endorsement probabilities for each of the four classes for the second factor mixture model (FMM2) for indices of alcohol dependence, abuse and consumption at wave 1, weighted by estimated class probabilities. HED, Heavy episodic drinking; Interpers, continue to drink despite interpersonal problems. For a full description of indicators, see Table 1.
As might be expected, item thresholds were greatest for the infrequent drinking class (signifying low probability of item endorsement) and were somewhat higher for the regular moderate drinking class than the other dependent drinking classes.
Validation against AUD and alcohol dependence diagnosis
We examined class membership as a function of whether the participant was diagnosed with past 12-month AUD (n = 3327; 9.9%) and alcohol dependence (n = 1484; 4.4%). Individuals were assigned to most likely class based on highest posterior probability of membership, and associations with AUD/dependence status were examined. Data were weighted by probability of most likely class membership. As shown in Table 3, although the alcohol use disordered class comprised 7% of the full sample, those with past 12-month AUD (67.6%) and alcohol dependence (57.5%) were over-represented in this class; minimally dependent drinkers were also over-represented among those with past 12-month alcohol dependence.
Table 3. Prevalence of class membership and mean estimated factor scores as a function of past 12-month alcohol use disorder and alcohol dependence a
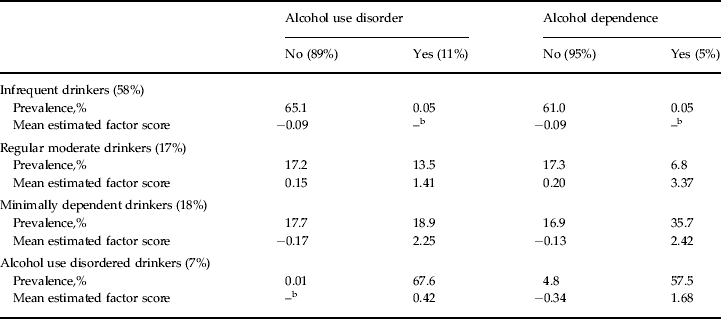
a n = 33644. Data are weighted by probability of most likely class membership.
b The mean factor scores for these cells are represented by three or fewer individuals and are non-interpretable.
We also examined whether individuals with AUD and alcohol dependence had greater severity of alcohol involvement within a class. Within-class variation in the respondent's endorsement probabilities correspond to the (within-class) factor scores for each respondent. That is, an individual with factor score values above the mean has higher endorsement probabilities than what is shown in Fig. 1. Table 3 shows the mean estimated factor scores for those with and without a diagnosis. In general, those with past 12-month AUD and alcohol dependence had higher factor scores, suggesting increased levels of alcohol involvement among those who were affected.
Model replication with wave 2 data
FA
Using wave 2 data, we estimated EFA models for one- through to four-factor solutions. The two-and three-factor models yielded factors characterized by singleton indicators and the four-factor model failed to converge. Thus, as with wave 1 we concluded that a single factor is sufficient for describing variability in the continuum of alcohol involvement.
LCA
The seven-class solution identified using wave 1 data again was deemed best in the wave 2 data according to the BIC, although the six-class model was best fitting according to the VLMR test (see Table 4). The pattern of endorsement probabilities for the seven-class model with wave 2 data was nearly identical to the pattern using wave 1 data, although there were fewer individuals in the infrequent drinking group and more individuals in the groups characterized by hazardous drinking and dependence (data not presented).
Table 4. Model fit comparisons of factor analysis, latent class analysis, and factor mixture models of alcohol consumption, dependence, and abuse indicators for wave 2 NESARC data a
NESARC, National Epidemiologic Survey of Alcohol and Related Conditions; BIC, Bayesian Information Criterion; VLMR, Vuong–Lo–Mendell–Rubin test of relative improvement in fit; n.s., non-significant; FMM, factor mixture model; LCFA, latent class factor analysis.
a n = 25186.
b The seven-class solution was best according to the BIC; however, the six-class model was best fitting according to the VLMR test.
c The four-class second model (FMM2) was the best-fitting model according to the BIC.
d Failed to converge due to a non-positive definite first-order derivative product matrix.
FFMs
Using wave 2 data, we estimated the three FFMs for two-, three- and four-class solutions (see Table 4). Again, the four-class FMM2 was the best-fitting model according to the BIC (BIC = 185208.75). Fig. 2 portrays endorsement probabilities for each class from the wave 2 four-class FMM2 model.

Fig. 2. Endorsement probabilities for each of the four classes for the second factor mixture model (FMM2) for indices of alcohol dependence, abuse and consumption at wave 2, weighted by estimated class probabilities. HED, Heavy episodic drinking; Interpers, continue to drink despite interpersonal problems. For a full description of indicators, see Table 1.
Stability between waves 1 and 2
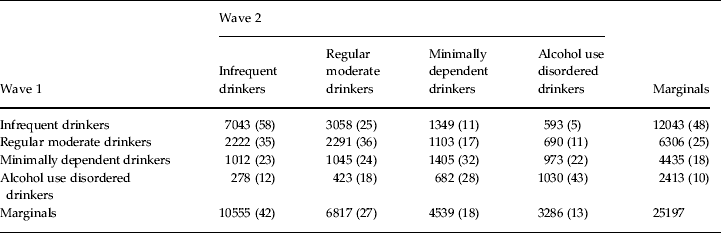
To examine the stability of the solutions across waves 1 and 2, we compared the FMM2 four-class model for both waves in two ways. First, we examined stability of class membership by calculating agreement statistics between the wave 1 and wave 2 latent class variables to characterize the consistency of classification (see Table 5); cell frequencies were weighted by class membership probabilities. Class stability from waves 1 to 2 was moderate (κ = 0.23, φ = 0.42), with greatest stability in the infrequent and alcohol use disordered classes.
Table 5. Wave 1 and wave 2 class membership shown as cell counts and row percentages based on the estimated model a
Data are given as n (%).
a Cell frequencies are weighted by probability of class membership. κ = 0.23, φ = 0.42.
In the second approach, we examined change on the dimension over time by correlating the factor scores within class. We assigned respondents to most likely class, and then examined within-class correlations in the underlying latent factor. There was moderate agreement in factor scores over time for regular moderate (r = 0.41) and minimally dependent (r = 0.37) classes, and high agreement in the alcohol use disordered class (r = 0.59), but somewhat low agreement for the infrequent (r = 0.15) class.
Discussion
The present study attempted to resolve the extent to which alcohol involvement reflects a difference in kind versus a difference in degree by the use of FFMs, a new class of analytic models. Using a large nationally representative epidemiological sample, we tested and compared continuous (FA), categorical (LCA) and hybrid (FMM) models based on three types of indicators of alcohol involvement: alcohol dependence, alcohol abuse and alcohol consumption, and we examined the replicability of the models across two waves. We saw evidence that alcohol involvement can be considered both categorical and continuous in the superior-fitting FMM models, with responses reduced to four types of patterns that quantitatively varied along a single dimension. That is, different patterns of endorsement were captured by discrete groups, yet individuals also fell on a latent continuum of alcohol involvement.
The history of research on subtyping alcoholism is an extensive one with a variety of typologies based upon a range of criteria including drinking topography and/or symptoms (Jellinek, Reference Jellinek1960; APA, 1980), co-morbid psychopathology (Knight, Reference Knight1937; Babor et al. Reference Babor, Hofmann, DelBoca, Hesselbrock, Hesselbrock, Meyer, Dolinsky and Rounsaville1992), developmental course (Zucker, Reference Zucker and Rivers1987), age of onset (Babor et al. Reference Babor, Hofmann, DelBoca, Hesselbrock, Hesselbrock, Meyer, Dolinsky and Rounsaville1992), impulsivity and heritability differences (Cloninger et al. Reference Cloninger, Bohman and Sigvardsson1981; Cloninger, Reference Cloninger1987), craving and withdrawal (Langenbucher et al. Reference Langenbucher, Martin, Labouvie, Sanjuan, Bavly and Pollock2000; de Bruijn et al. Reference de Bruijn, van den Brink, de Graaf and Vollebergh2006) and associated personality patterns (Morey & Blashfield, Reference Morey and Blashfield1981; Cloninger, Reference Cloninger1987). The present study carries on this rich tradition by capitalizing on evidence of the utility of including consumption indices in deriving typologies, but, at the same time, leaves open the possibility of a severity gradient rather than a strict typology. Consistent with Moss et al. (Reference Moss, Chen and Yi2010), our most severe group exceeded all other subtypes in terms of risky levels of alcohol consumption, operationalized as HED and intoxication, although only minimally so in comparison with the minimally dependent group. Endorsement of heavy and frequent consumption was nearly identical for these two dependent groups. Further, these two groups did not differ from the group of regular moderate drinkers with regard to frequency of alcohol consumption, suggesting that frequency indices may be less useful than quantity measures in identifying typologies of drinkers.
Two of the classes that were recovered were characterized by some level of endorsement of alcohol dependence and abuse criteria, primarily varying only in severity of endorsement. Although we and many others have been skeptical of the concept of alcohol abuse as a diagnostic entity (Martin et al. Reference Martin, Chung and Langenbucher2008; Vergés et al. Reference Vergés, Steinley, Trull and Sher2010), the current analysis confirms that skepticism by identifying a group of individuals with high rates of high-risk consumption patterns as reflected in HED but with no endorsement of any abuse criteria (not even hazardous drinking, which instead is prominent only in the ‘alcohol use disordered’ group in our analyses).
Prior latent class analyses of alcohol-related symptomatology have tended to identify groups of graded severity where the prevalence of each individual symptom is higher in progressively more severe classes (e.g. Heath et al. Reference Heath, Bucholz, Slutske, Madden, Dinwiddie and Dunne1994; Bucholz et al. Reference Bucholz, Heath, Reich, Hesselbrock, Kramer, Nurnberger and Schuckit1996; Chung & Martin, Reference Chung and Martin2001; Muthén Reference Muthén2006). Such findings support AUDs as best conceptualized on a continuum. Our own study supports this, with a single latent factor underlying the pattern of endorsement, and higher severity scores being characteristic of individuals who were diagnosed with past 12-month alcohol dependence or AUD. While pure severity classes based on criteria may be useful for purposes of deriving thresholds for when to treat or for counting ‘cases’, or as a quantitative trait for genetic analyses, they are less useful for characterizing more nuanced but still important differences in alcohol symptomatology that may be relevant for developing intervention approaches that are tailored to a patient's profile of drinking and alcohol-related difficulties. FMMs provide information about both severity of alcohol involvement and classification of individuals into discrete categories. Most prior work has explored the dimensionality of alcohol involvement based upon traditional symptoms of AUDs and less commonly with consumption measures. Informed by IRT analyses that indicate that traditional AUD criteria tend to reflect the higher end of the latent trait of AUD (e.g. Saha et al. Reference Saha, Chou and Grant2006), we expanded the traditional criteria set by including items that should characterize key aspects of drinking behavior, involvement in heavy drinking and frequency of consumption. Our results suggest that the addition of HED and drinking to intoxication is useful at distinguishing between regular moderate and minimally dependent drinkers: neither group is likely to meet DSM alcohol dependence, and neither has any evidence of alcohol abuse, but one group shows clear evidence of a risky drinking pattern that may be useful in predicting the transition to problem use. These results are generally consistent with a quantitative difference rather than a qualitative difference, since the class with greater probability of risky drinking was also the one with higher probability of dependence.
In general, individuals tended to be stable in their drinking classification over the 3-year follow-up interval; for all classes, the wave 1 class was the most likely class assignment for wave 2 (range: 32–58%), although regular moderate drinkers were nearly as likely to transition to infrequent drinkers as to remain moderate drinkers (35% v. 36%). The majority of individuals (58%) in the infrequent drinking class remained in that class at follow-up. However, more than half of members in the other three classes transitioned to a more or less severe class, with substantial evidence of regression to a less severe drinking class over the interval. For example, although 22% in the minimally dependent group progressed to severe dependence, a full 47% moved to less severe groups, thus challenging the concept of alcohol dependence as a progressive and/or chronic illness (also see Jackson et al. Reference Jackson, O'Neill and Sher2006), although the sequelae of dependence (e.g. daily functioning, job performance, physical health) may certainly show progressive deterioration. Most of the alcohol use disordered drinkers, however, did remain in one of the two dependent classes (with less than a third transitioning to the infrequent or regular moderate drinking groups). Instability with regard to alcohol dependence symptomatology also has been documented in the St Louis ECA study (Edens et al. Reference Edens, Glowinski, Grazier and Bucholz2008), which showed that among individuals who met lifetime diagnostic criteria at both waves of the ECA, at 14-year follow-up less than half (42% of men and 48% of women) met AUD criteria or reported problem drinking. Our other work using NESARC suggests that there is quite a bit of instability in alcohol involvement over time, with low rates of persistence in AUD (< 50%) and alcohol dependence (< 40%) over 3 years (Vergés et al. Reference Vergés, Jackson, Bucholz, Grant, Trull, Wood and Sher2012). Similar findings based on NESARC data indicated that a significant proportion of drinkers with alcohol dependence continued drinking but became asymptomatic with regard to DSM-IV criteria (Moss et al. Reference Moss, Chen and Yi2010).
Stability of severity of alcohol involvement between waves 1 and 2 within a class was also moderately high, with greatest agreement in the alcohol use disordered class but only modest agreement for the infrequent class. Among those individuals who were assigned to the infrequent drinking class at both waves 1 and 2, those who had an elevated pattern of endorsement relative to others in that class at wave 1 did not necessarily have comparatively high endorsement at wave 2, with low agreement in the underlying latent factor for this class (r = 0.15). We suspect the reason we have lower correlations in the factor for the low drinking class is because we have less true score variance in this group, i.e. the factor score is more meaningful in the heavier drinking groups. For the large group of low-level drinkers, it may be that a greater proportion of the stability over time is due to the class component, with the dimensional component being more time specific. An infrequent drinker may have a sporadic pattern of drinking, resulting in lower stability in factor scores, despite relatively stable underlying latent liability to alcohol involvement (a function of alcohol dependence, abuse and consumption).
Fewer classes were recovered in the FMM than in the LCA. Unaccounted for covariation within the class structure can be modeled by the continuous latent variables, and the smaller number of classes is more likely to reflect qualitatively heterogeneous groups in the population. However, the results of the two approaches were not completely at odds, as some of the FMM classes were also observable in the LCA model: the FMM alcohol use disordered class (9% of the sample) appeared to encompass the low, moderate and high dependent drinking classes in the LCA solution (together summing to 8%). The FMM approach suggests that the variability in dependence symptomatology is best captured by a severity gradient. Along similar lines, the FMM regular moderate class (23%) seemed to combine the LCA regular moderate and non-dependent heavy drinking classes, together comprising 27% of the sample. The less-parsimonious LCA solution is perhaps appealing in this regard as it discriminates among these two consumption classes by virtue of whether the respondent reports a pattern of drinking to intoxication.
We also note that despite the fact that we were interested in identifying subtypes that were differentiated in their drinking patterns, no latent class of drinkers was characterized by a high level of daily drinking despite the fact that the stereotype of the ‘alcoholic’ (especially the ‘delta’ alcoholic who exhibits inability to abstain; Jellinek, Reference Jellinek1960) is that of a daily drinker. Whether or not daily drinking is a meaningful indicator of a drinking subtype remains an open empirical question but we find it surprising that in neither the LCA nor the FFMs did any of our recovered classes show a high prevalence of this behavior.
Limitations
The NESARC study is characterized by the same types of limitations that affect similar general population surveys, most notably, limitations imposed by a self-report strategy. Current self-report approaches for assessing a number of alcohol-related phenomena such as tolerance and impaired control (O‘Neill & Sher, Reference O'Neill and Sher2000; Chung & Martin, Reference Chung and Martin2005) are clearly limited and NESARC definitions of withdrawal are potentially problematic (potentially conflating hangover with withdrawal). Perhaps more critically, key features of dependence identified by preclinical research in neuroscience such as incentive salience (Robinson & Berridge, Reference Robinson and Berridge2001, Reference Robinson and Berridge2004) and allostasis (e.g. Koob & LeMoal, Reference Koob and Le Moal2008) are not well resolved by any self-report strategy. It is possible that emerging assessment strategies employing measures of ‘implicit cognition’ (Stacy & Wiers, Reference Stacy and Wiers2010) may help to make assessment of neurobiological processes more accessible to diagnosticians (and provide meaningful assessment of dependence processes in recovering alcoholics; Sher et al. Reference Sher, Wolf, Martinez and Scheier2009). While we strongly believe in the promise of objective evaluation of alcohol-related symptomatology (e.g. based on advances in imaging, molecular genetics, biomarkers, transdermal alcohol sensors), the present state of the art is well reflected in the highly structured AUDADIS and there is no reason to believe that there are any systematic biases in the interview and survey methodology that would exert an effect that would artificially create the types of groups our LCAs recovered.
Two major limitations of the current study are the fact that we currently lack a comprehensive theory that would dictate the types of items we should include in developing item/criteria sets that are sufficiently comprehensive and relevant for resolving alcohol-related pathology and that we only have two times of assessment. With respect to the issue of item/criteria coverage, we note that the NESARC did include ‘craving’ items at wave 2 but we chose to not include craving because its inclusion would have precluded the stability/LTA analyses we deemed critical to the study. The inclusion of only two measurement occasions precludes our ability to assess the durability of transitions. For example, is a transition from a severe class to a less severe (and even non-dependent class) stable or likely to recur/progress?
The FMM is an important analytical tool for conceptualizing the structure of substance use and other psychiatric psychological disorders; however, these models can be specified and estimated in numerous different ways and there are as yet no clear guidelines in model comparison or selection. One of the known difficulties with mixture models in general is the problem of resolving the correct number of classes. Information criteria have often been shown to overextract the number of classes due to possible skew in the manifest variables (see Bauer & Curran, Reference Bauer and Curran2003; Steinley & Brusco, Reference Steinley and Brusco2011). In addition, as with all latent response variable models, the number of logically identifiable classes in analysis is limited by the number of variables and categories used. Specifically, changes in elevation or in variability in the latent response variable can be modeled, but not both (Millsap & Yun-Tein, Reference Millsap and Yun-Tein2004; Cho et al. Reference Cho, Wood and Heath2009).
Despite these and other limitations, the NESARC must be viewed as an exceptionally useful resource that permits the types of analyses permitted here. Its assessment of alcohol-related behavior and symptoms is broad and systematic, the sample size is representative enough to ensure generalizability to the US population, and the follow-up assessment permits the critical measurement of stability.
Summary
The present study showed support for the value of hybrid approaches that consider groups that vary in pattern of consumption and dependence symptomatology as variation of severity within group. We believe that there are a number of noteworthy aspects of the current study that warrant serious attention by nosologists working on improving the construct and clinical validity of alcohol-related diagnosis and attention to these aspects offers hope of developing empirical classifications that could gain traction in the research, clinical and public health communities. More specifically, consideration of drinking patterns provides critical information in the profile of alcohol-related symptomatology since many health consequences are associated with these patterns even in the absence of traditional signs of substance use disorder. Indeed, while the minimally dependent drinkers in our sample show a high likelihood of binge drinking and drinking to intoxication, they manifest a relatively low likelihood of dependence or of hazardous use and might escape the notice of current diagnostic schemes (APA, 1994) and proposed futures ones (Kraemer et al. Reference Kraemer, Kupfer, Narrow, Clarke and Regier2010; O'Brien, Reference O'Brien2011). Although harmful drinking patterns have been defined by various Federal agencies (e.g. National Institute on Alcohol Abuse and Alcoholism, 2005; US Department of Health and Human Services, 2010; US Department of Agriculture & US Department of Health and Human Services, 2010), these guidelines reside outside formal diagnostic criteria. The current study does not resolve the issue of whether psychiatric nosology should distinguish between heavy drinking patterns that are associated with alcohol problems and dependence from those that are not. From the perspective of harmful dysfunction (e.g. Wakefield, Reference Wakefield1992; Spitzer, Reference Spitzer1999), heavy drinking patterns without associated abuse or dependence symptoms represent a dilemma. These patterns are associated with physical harm, but not necessarily in an imminent way. Moreover, although it is possible that there is some underlying dysfunction (e.g. excessive reward seeking) that leads to non-dependent heavy drinking, such dysfunction is not usually easily determined. Within DSM-IV, there is a category for abuse, and draft criteria for substance use disorder in DSM Fifth Edition (DSM-5) retain the notion of hazardous use. But here we are considering individuals with not only little indication of dependence but also little evidence of hazardous use. Even in the absence of current abuse or dependence symptoms, these individuals are presumably at later risk for these types of problems (indeed, our findings indicate that a proportion of this group does progress to the dependent group over several years). It seems likely that considering minimally or non-dependent heavy drinkers as a diagnostic entity has some clear advantages in promoting health but also carries with it the potential to be stigmatizing. Clearly, these and other issues are beyond the scope of the current paper but the potential importance of highlighting this group cannot be underestimated.
Acknowledgements
Preparation of this paper was supported by National Institute on Alcohol Abuse and Alcoholism grants R01AA016392 (to K.J.S.), K05AA017242 (to K.J.S.) and K25AA017456 (to D.S.).
Declaration of Interest
None.


