Introduction
Marine ornamental aquaculture has acquired prominence in recent decades as it tries to supply an alternative to the extractivism of large quantities of fish from the oceans (Wood, Reference Wood2001). Although ornamental aquaculture has developed significantly, at this time extractivism of marine ornamental species still predominates the numbers of species reared in captivity, especially those of economic interest (Wabnitz et al., Reference Wabnitz, Taylor, Green and Razak2003; Mazzoni et al., Reference Mazzoni, Junior, Viadanna and Silva2019). Marine ornamental fish farming is not an easy activity, and depends especially on acclimatization of the captive species, adequate gonadal development (Mazzoni et al., Reference Mazzoni, Junior, Viadanna and Silva2019), production capacity of viable eggs, obtaining larvae and the survival of juveniles (Holt, Reference Holt2003). However, this conditioning in captivity is quite variable, as some species acclimatize more easily than others.
Many ornamental species of economic interest have never reproduced successfully in captivity. Many species do not even manage to survive in confined environments. Among these species is the butterflyfish, which has great prominence in aquarism. Butterflyfish, belonging to the Chaetodontidae family, are highly requested on the aquarium market because they present diversity of colour, have different morphological patterns (Nagpure et al., Reference Nagpure, Kumar, Srivastava, Kushwaha, Gopalakrishnan and Basheer2006) and are small sized (Monteiro-Neto et al., Reference Monteiro-Neto, Cunha, Nottingham, Araújo, Rosa and Barros2003; Berumen and Pratchett, Reference Berumen and Pratchett2006). The family contains 133 species that are distributed in 12 genera present in tropical and subtropical oceans, with the largest number of species belonging to the Chaetodon genus (Eschmeyer et al., Reference Eschmeyer, Fricke and Van Der Laan2020).
Although Chaetodon is a cosmopolitan genus, distributed in aquaria worldwide, information on the reproductive aspects of many of its species is still quite scarce (Motta, Reference Motta2012; Bayona Perez et al., Reference Bayona Perez, Mazzoni and Quagio-Grassiotto2020). Rare studies of these animals have dealt with detailed basic aspects of their reproductive biology such as oocyte and testicular development (Bayona Perez et al., Reference Bayona Perez, Mazzoni and Quagio-Grassiotto2020), however it is not known what changes the gonadal tissue may undergo during periods of collection and acclimatization in captivity. Therefore, to achieve successful reproduction, it is essential to understand the reproductive biology of the species, as well as the mechanisms involved in acclimatization in captivity, especially of more sensitive species.
Simple aspects of artificial environments can be sources of stress for animals in captivity. Under these conditions, animals generally lose track of time, are unable to choose their own food and present restricted foraging and shelter activities. These limited activities can increase the stress suffered by the animal in the confined situation. Perhaps the greatest stressor in captive populations is that the animal has no control over its environment (Morgan and Tromborg, Reference Morgan and Tromborg2007). This often results in increased aggressiveness by the confined animal (Ratnasabapathi et al., Reference Ratnasabapathi, Burns and Souchek1992).
Changes in the individual’s homeostasis are not always visible or recognized by behaviour or detectable phenotypic changes. This absence of change in the external morphology of the organism can even mask important internal morphological alterations, that affect the functioning and viability of the animal in captivity (Courtney Jones et al., Reference Courtney Jones, Munn and Byrne2018). Therefore, it is important to recognize the reproductive dynamics of the species in captivity, when the objective is to bred them not in their natural habitat.
These reproductive dynamics in different species of fish can be evaluated using macroscopic or microscopic tools such as changes in the germinal epithelium, differentiation of germ cells (Grier et al., 2007; Reference Grier, Uribe-Aranzábal and Patino2009), and analysis of the steroid hormones profile (Pandian, Reference Pandian2010). However, regardless of the evaluation methods, reproductive characteristics are important aspects to be considered when the objective is to maintain species outside their natural habitat. Under conditions of captivity, the natural reproduction process is often not completed (Mylonas et al., Reference Mylonas, Fostier and Zanuy2010) and reproductive dysfunction, caused by stressors, such as simply handling of the animal or confinement in a reduced space, are frequent, and makes a basic study related to the reproductive dynamics of the species in captivity relevant.
Germinal epithelium is a source of cell renewal and ensures the continuity of gametogenesis in fish (Grier, Reference Grier2000), becoming permanently active after the end of the gonadal differentiation process (Mazzoni et al., Reference Mazzoni, Grier and Quagio-Grassiotto2010; Mazzoni and Quagio-Grassiotto, Reference Mazzoni and Quagio-Grassiotto2017). Therefore, analysis of germinal epithelium dynamics during periods of acclimatization in captivity allows an understanding of possible cyclical events that may occur during the gonadal development of confined animals, clarifying possible difficulties in reproduction and/or maintenance of these animals outside their natural habitat, and faced with stress caused by confinement in captivity. Bayona Perez (Reference Bayona Perez2019) observed that, depending on the method of collection performed, some specimens of Chaetodon striatus (Linnaeus, 1758) had completely affected ovarian structure. These preliminary data make this species an excellent biological model to assess the possible effects of handling in captivity on the organism’s reproductive homeostasis.
In this regard, considering the various mechanisms that are involved in reproductive events in fish, this study aimed to analyze banded butterflyfish C. striatus and the effect of confinement on its reproductive biology and possible structural changes in female germinal epithelium, providing information on maintenance and breeding in captivity for a species of great economic interest.
Materials and methods
Animals
Mature adults (n = 100; 15–16 cm length and 100–120 g weight) of C. striatus were collected, between January and April 2019 at different locations (Cedro Beach, Promirim Island and Tenório Beach) in Ubatuba city (23°26′2″S, 45°5′9″W), São Paulo State, Brazil using active capture with dip nets (handle length 20 inches; 3/16 inch mesh netting; 12 inches deep), through dive depths of around 3–5 m, next to the rocky shores. After capture, the specimens were transported to the fish vivarium, acclimated for 45 days in 1000 litre plastic water tanks, and subsequently separated into groups. Temperature, pH and salinity of the water were maintained with conditions similar to that of seawater in the Ubatuba region: 26 ± 2ºC, pH 8.1 ± 0.1 and salinity at 35 ppt. The water was prepared using commercial salt for marine aquariums, InstantOcean® Sea Salt and measured using a densimeter, Soma Salinity Tool Saltwater. During the period of maintenance in captivity, the fish were fed twice a day with live food (brine shrimp) or frozen food (shrimp, fish and mussel) and commercial feed (Tropical® Bionautic Granulat for marine fish). The specimens were kept under a natural photoperiod.
Experimental groups
Animals were separated into two large experimental groups, both kept in captivity: control group and confined group to test confinement stress. Among the 100 animals collected, 70 adults that were capable of reproducing were separated into 10 tanks (five tanks for the control group and five tanks for the confined group). Each tank contained seven individuals (five females and two males), forming the 10 experimental groups, which were collected on the 1st, 3rd, 5th, 10th and 20th days, after the groups were established. Therefore, one control group and one confined group were installed for each sampling day, totalling 70 animals analyzed. Adult females selected for the experimental groups had a bulging abdomen and possibly were in the same reproductive phase, as oocytes were extruded when the abdomen was massaged. Selected males also showed milt released with gentle pressure on the abdomen. Each of the 10 experimental groups was kept in a 300 litre tank. However, in the five confined groups, the seven animals were confined in a restricted space corresponding to 100 litre water, using a fish tank acrylic divider, and allowing circulation of water throughout the aquarium. This confinement was carried out to mimic stress caused by pit-type traps, often used in passive captures of seawater fish.
Aquaria for the experimental groups were equipped with sand + aragonite substrate, stones and shells. The filtration system consisted of a sump connected to mechanical and biological filtration equipment and with a skimmer.
Light microscopy
After experiments, specimens collected were anaesthetized with 0.1% benzocaine and euthanized in accordance with the Ethics Committee on Animal Experimentation of the Institute of Biosciences of Botucatu – number 805 – CEEA-IBB/UNESP. Ovaries collected were removed quickly and fixed in 2% glutaraldehyde and 4% paraformaldehyde in filtered seawater (pH 8.0) for at least 24 h. Gonads were dehydrated in ethanol and embedded in Historesin (Leica®). Sections (3 μm) from all ovaries were stained with periodic acid Schiff (PAS) + iron haematoxylin + metanil yellow (MY) (Quintero-Hunter et al., Reference Quintero-Hunter, Grier and Muscato1991) and reticulin method (RM), for monitoring the basement membrane (Vidal, Reference Vidal1988; Mazzoni et al., Reference Mazzoni, Grier and Quagio-Grassiotto2015). Ovaries were evaluated using a computerized image analyzer (AmScope FMA050) and a microscope (Bioptika B20T).
Immunofluorescence for cell death by apoptosis – terminal deoxynucleotidyl transferase nick end labelling (TUNEL)
Apoptotic cells were detected by TUNEL assay using the In Situ Cell Death Detection Kit, Fluorescein® – Roche) in accordance with the manufacturer’s instructions. C. striatus ovaries were fixed in a 4% paraformaldehyde solution (pH 8.2) in sea water for 12 h, dehydrated in ethanol, embedded in Paraplast® and sectioned at 5 μm thickness. The material obtained was deparaffinized and hydrated in tris-buffered saline (tris + phosphate buffer, 5 mM, pH 8.0). The samples were permeabilized with proteinase K and incubated with dUTP conjugated to digoxigenin in a catalyzed reaction by a recombinant reaction of deoxynucleotide transferase (rTdT) and mixture of nucleotides for 1 h at 37ºC in a humidity chamber. The samples were then washed with phosphate-buffered saline (PBS) to remove unincorporated fluorescein-12-dUTP. After washing with PBS, the slides were mounted with Fluoroshield Mounting Medium with 4′,6-diamidino-2-phenylindole (DAPI) (Sigma-Aldrich®). The material was documented using an Olympus BX61 fluorescence microscope.
Plasma cortisol levels
Blood samples from C. striatus (five females per experimental group/collection), were used to measure plasma cortisol. Blood collection was performed using heparinized syringes (Ultra-Fine 0.5CC, 1 ml, 8-mm needles) by puncture through the caudal vein. Blood samples were centrifuged to separate plasma. Centrifugation was carried out at 335 rad/s for 15 min and plasma was stored in the freezer at −20°C until the assay. Plasma cortisol levels were quantified by enzyme linked immunosorbent assay (ELISA) using a commercial kit (Cortisol ELISA IBL®, RE52061). The sample preparation, calibration curves and gamma counting were made following the manufacturer’s instructions. Samples were assayed in duplicate, the standard curve was run for ELISA plate, and the absorbance (450 nm) measurements were performed in a microplate reader (ELISA Asys Hitech GmbH – Expert Plus®, BIOCHROM, Cambridge, UK).
Glucose levels
After collecting the blood of C. striatus, 1 μl from each individual was used to perform the test using a portable glucometer (OneTouch Ultra Mini®). Results generated by the blood glucose meter within 3–5 s provided the blood glucose level value in mg/dl. This technique was used because glucose levels are often used as stress biomarkers (Lawrence et al., Reference Lawrence, Jain-Schlaepfer, Zolderdo, Algera, Gilmour, Gallagher and Cooke2018).
Statistical analyses
Cortisol and glucose plasma levels were separated in different groups, according to the animal’s confinement and collection times. The obtained data were computed using GraphPad Prism® v.8.0.0 software and submitted to variance analysis (mixed model ANOVA) followed by Fisher’s least significant difference (LSD)) multiple comparison test, using significance level P = 0.05. The normality of residual values distribution was checked using quantile–quantile graphs (QQ plot; data not shown). Basal values for cortisol and glucose were established from the simple arithmetic mean and from standard deviation of the means obtained in each control group collected.
Results
Only female gonads were described here, although all animals were analyzed histologically. Testes data were not presented as they did not show changes in the germinal epithelium.
Ovarian structure
In all experimental groups, C. striatus ovaries showed the same anatomical structural characteristics, being pairs, cylindrical and elongated organs, surrounded by connective tissue, called mesovary or tunica albuginea. They were cavitary organs (with ovarian lumen), internally delimited by a germinal epithelium that bordered the ovigerous lamellae (Fig. 1).

Figure 1. Cross-sections of the ovary of Chaetodon striatus. (A) Ovigerous lamellae (la) facing the ovarian lumen (lu). (B) Ovigerous lamellae composed by ovarian follicles at different stages of development. (C) Detail of the ovigerous lamellae delimited by the germinal epithelium (ge). Tunica albuginea (ta), primary growth oocyte (pg), secondary growth oocyte (sg). Staining: MY. Bars: 200 μm (A), 100 μm (B), 50 μm (C).
Female germinal epithelium and folliculogenesis
The female germinal epithelium of C. striatus was formed from somatic and germ cells, at different stages of development (Fig. 2). In the control group (under normal conditions), there are regions of intense cellular activity in specific portions of the germinal epithelium. In these portions, named cell nests, there is an isolated oogonium (Fig. 2 A), proliferation of which gives rise to new oogonia. These germ cells associate with somatic cells and form germline cysts. Within germline cysts these oogonia proliferate and/or enter into meiosis forming the early prophase oocytes (Fig. 2 B–G). Oogonia are oval cells with scarce cytoplasm. They have large and spherical nuclei with a very evident nucleolus (Fig. 2 A). These oocytes are also oval cells, with a nucleus containing chromatin in different patterns of condensation according to their stage of prophase (Fig. 2 B–G).

Figure 2. Histological sections of the ovaries of Chaetodon striatus, showing the stages of the folliculogenesis, in the control group. (A) Oogonia (g) isolated in the germinal epithelium, surrounded by epithelial cells (ec). (B) Germline cyst of leptotene oocytes (lo). (C) Germline cyst delimited by pre-follicle cells (pf) containing zygotene oocytes (zo). (D) Cyst containing early pachytene oocytes (epo). (E) Cyst containing late pachytene oocytes (lpo). Note the absence of pre-follicle cells inside the cyst. (F) Cyst containing late pachytene oocytes (lpo). Note the invasion of the pre-follicle cells (pf) into the cyst. (G) Cell nest containing early diplotene oocytes (edo), surrounded by pre-follicle cells (pf). (H) Newly formed ovarian follicle, containing diplotene oocyte (do), surrounded by follicle cells (f). (I) Newly formed ovarian follicles, containing diplotene oocytes (do) leaving the cell nest. Pre-follicle cells (pf), nucleus (n), nucleolus (nu). Staining: MY. Bars: 10 µm.
In C. striatus, prophase oocytes have a more basophilic nucleus than oogonia. The leptotene oocyte has a strongly basophilic nucleus and is still slightly condensed (Fig. 2 B). As prophase progresses, there is a gradual loss of the nuclear basophilia of the oocyte. The zygotene oocyte starts to show greater chromosomal condensation, giving a granular aspect to the nucleus (Fig. 2 C). At the beginning of pachytene, synaptonemic complexes begin to be formed allowing homologous chromosomes to be paired and maximum chromatin condensation is observed (Fig. 2 D). At the end of the pachytene, synaptonemic complexes are fully formed and there is strong basophilia close to the nuclear envelope of the oocyte (Fig. 2 E), which is accentuated when the oocyte enters into early diplotene. Concomitantly at this stage, epithelial somatic cells, called pre-follicle cells that delimit the germline cyst, invade it, surrounding each oocyte (Fig. 2 F). Now, the early diplotene oocyte is separated from the cyst (Fig. 2 H), giving rise to an ovarian follicle (Fig. 2 I). During this process, known as folliculogenesis, pre-follicle cells, after differentiating into follicle cells, begin the formation of the basement membrane. Therefore, gradually, the basement membrane is synthesized, individualizing each ovarian follicle. With entrance into diplotene, the oocyte starts to present a single nucleus that is quite developed (Fig. 2 H, I). The cytoplasm of these diplotene oocytes increases in volume, gradually becoming more basophilic, beginning the period of primary growth of the oocyte (Fig. 2 I).
Female germinal epithelium of fish under confinement conditions
In the confined animals, under stress conditions, the germinal epithelium underwent major changes in the cells (Fig. 3). Both somatic cells (epithelial and pre-follicle cells) and prophase oocytes entered cell death (Fig. 3). Apoptotic bodies were noted throughout the germinal epithelium that bordered the ovigerous lamellae (Fig. 3 A–F). There was disorganization of the germline cysts as a result (Fig. 3 B–H). Concomitant to entry into cell death, germline cysts were invaded by many granulocytes (Fig. 3 B–G). As the cell death process progressed, most early prophase oocytes, inside the cysts, completely degenerated (Fig. 3 H), becoming unrecognizable as germline cysts.
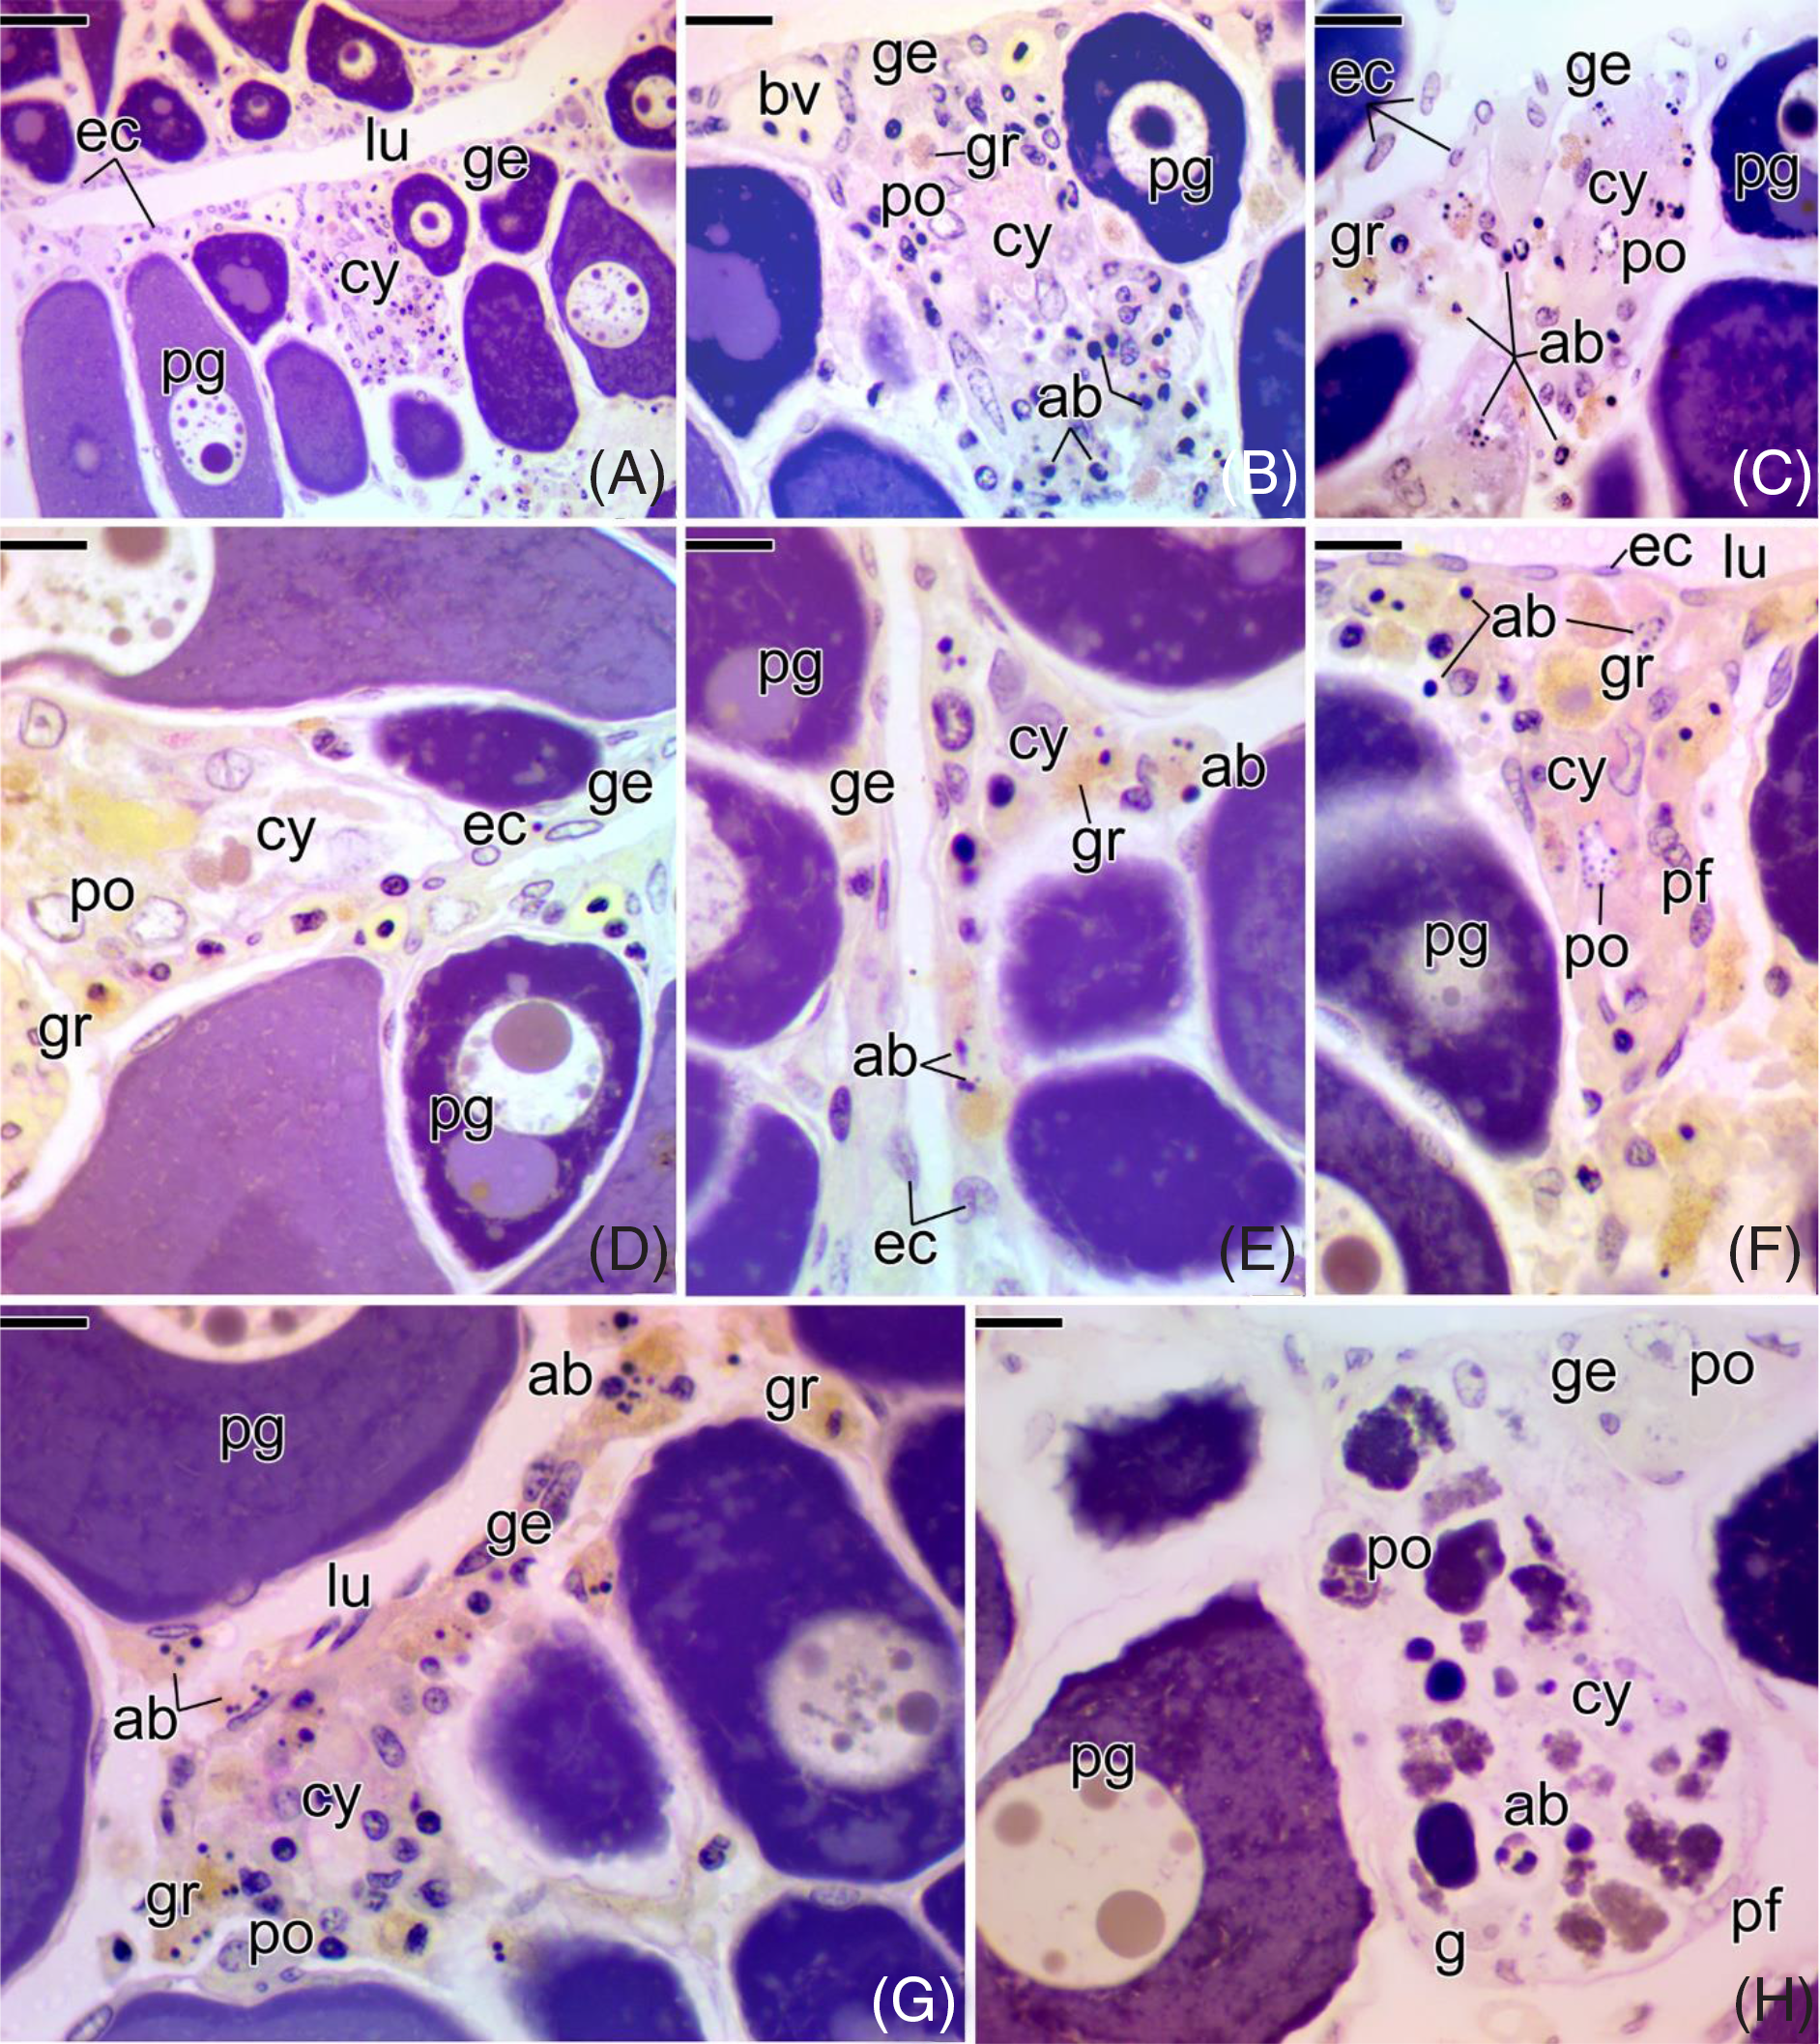
Figure 3. Cross-sections of the ovaries of Chaetodon striatus, in the confined group. (A) Germinal epithelium (ge), showing cell nests regions, with germline cysts (cy). (B, C) Details of (A), showing a germline cyst (cy), with a large number of cell death, characterized by apoptotic bodies (ab). Note the presence of PAS-positive granulocytes (gr) in (B) and responding positively to MY in (C). (D–G) Germinal epithelium delimited by epithelial cells (ec) and germline cysts (cy) being invaded by a large amount of granulocytes (gr). Note the presence of a large number of apoptotic bodies (ab). (H) Germline cyst (cy) with prophase oocytes (po) totally degenerate, forming an amorphous mass. Next to the cyst, it is possible to observe the presence of oogonia (g) that did not enter into cell death, as well as intact prophase oocytes in the germinal epithelium (ge). Epithelial cell (ec), pre-follicle cell (pf), apoptotic bodies (ab), ovarian lumen (lu), primary growth oocyte (pg), prophase oocyte (po), blood vessel (bv). Staining: MY. Bars: 40 µm (A), 20 µm (B, C), 10 µm (D–H).
Detection of the cell death process was shown by immunofluorescence TUNEL assay (Fig. 4). Germ or somatic cells in apoptosis were not detected in the ovaries of the control group (Fig. 4 A–C). Conversely, early oocytes and somatic cells in the germinal epithelium showed positive immunostaining to TUNEL in all experimental groups that remained confined (Fig. 4 D–G).

Figure 4. Immunofluorescence for cell death by apoptosis in the germinal epithelium of the ovaries of Chaetodon striatus, in the control group (A–C) and in the confined group (D–G). (A–C) Germinal epithelium (ge) formed by germline cysts (cy), primary growth (pg) and secondary growth (sg) oocytes. Note the absence of immunostaining in these histological sections. (D–G) Germinal epithelium (ge) formed by germline cysts (cy), primary growth (pg) and secondary growth oocytes. Note the immunostaining (arrows) of somatic cells and germ cells along the germinal epithelium. Zona pellucida (zp). Bars: 100 µm (A), 50 µm (B), 20 µm (C, E–G).
Oocyte development
In all analyzed groups, oocyte development (Fig. 5) presented the same histological characteristics, regardless of the days of confinement, therefore the degeneration process was not detected during the primary and secondary growth oocytes. Degeneration was observed only at the beginning of folliculogenesis and during final maturation of the oocyte, in the confined animals.

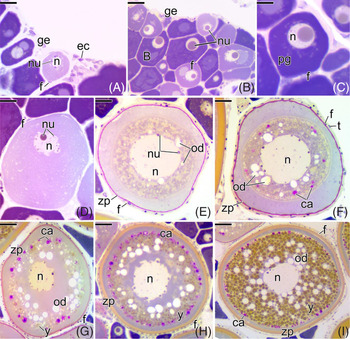
Figure 5. Histological sections of the ovaries of Chaetodon striatus, showing the oocyte development that normally occurs in both experimental groups (control and confined group). (A) Germinal epithelium (ge) with cell nests. (B) Primary growth oocytes at different stages. (C) Detail of the primary growth oocyte (pg) with nucleolus well developed in the nucleus (n). (D) Primary growth oocyte surrounded by follicle cells (f). Note its larger size and the decrease in the cytoplasmic basophilia. (E) Primary growth oocyte with the first oil droplets (od). The zona pellucida (zp) becomes evident. (F) Primary growth oocyte showing the first cortical alveoli (ca). The theca (t) becomes evident. (G) Secondary growth oocyte in early of vitellogenesis. The deposition of yolk globules (y) in the cytoplasm begins. (H) Secondary growth oocyte in intermediate vitellogenesis. The zona pellucida (zp) becomes more developed. (I) Full-grown oocyte. Note the yolk globules (y) and the oil droplets (od) in large quantities. The nucleus (n) remains in the centre of the oocyte. Cortical alveolus (ca), epithelial cell (ec), germinal epithelium (ge), follicle cell (f), oil droplets (od), nucleus (n), nucleolus (nu), zona pellucida (zp), yolk globules (y). Staining: MY. Bars: 20 µm (C–F), 40 µm (A, B, G), 70 µm (H), 100 µm (I).
After ovarian follicle formation in the germinal epithelium (Fig. 5 A), the diplotene oocyte presented a single developed nucleolus (Fig. 5 B). Cytoplasm in these oocytes increased in volume, becoming more basophilic, and characterizing the period of primary growth (Fig. 5 C). The cytoplasm of the primary growth oocyte gradually increased and became less basophilic (Fig. 5 D). At the end of primary growth, there was an accumulation of oil droplets in the cytoplasm of the oocyte, close to the nuclear limit (Fig. 5 E). Cortical alveoli were observed in the cytoplasm near the C. striatus oocyte membrane (Fig. 5 F). Next, deposition of yolk globules was also observed in the ooplasm, characterizing the secondary growth oocyte (Fig. 5 G) and oil droplets and cortical alveoli gradually became more numerous (Fig. 5 G).
During secondary growth, there was new considerable increase in the oocyte. The amount of yolk globules, oil droplets and cortical alveoli also increased (Fig. 5 H). At this point, the yolk globules occupy the entire ooplasm. This oocyte, with the central nucleus, reached its maximum development, as a denominated full-grown oocyte (Fig. 5 I).
Following oocyte development, the follicle envelope (Fig. 6) also developed, characterizing different types of ovarian follicles. At the beginning of primary growth, the oocyte is surrounded by a single layer of follicle cells (Fig. 6 A). Under light microscopy, at this stage it was not possible to observe the presence of the zona pellucida. However, as the oocyte followed its primary growth, the zona pellucida was synthesized around the oocyte (Fig. 6 B). At this stage, the zona pellucida is a thin acellular layer, which responds positively to PAS, indicating the presence of neutral polysaccharides in its construction, in C. striatus (Fig. 6 C).

Figure 6. Histological sections of the ovaries of Chaetodon striatus, showing the follicle envelope of each type of oocyte shown in the Figure 5. (A) Primary growth oocyte (pg) surrounded only by follicle cells (f). (B) Beginning of the synthesis of the zona pellucida (zp) around the primary growth oocyte (pg). Note the follicle cells (f) squamous forming the follicle. (C) The zona pellucida (zp) around the oocyte becomes more strongly PAS positive. (D) In addition to the zona pellucida (zp) and follicle cells (f), it is possible to observe the presence of theca cells (t). (E) Primary growth oocyte (pg) with the presence of oil droplets (od) and cortical alveoli (ca). In this oocyte, the zona pellucida (zp) starts to present two layers, one positive PAS and another stained by MY. (F, G) Secondary growth oocyte (sg). Note thickening of the zona pellucida (zp). Follicle cell (f), nucleus (n), primary growth oocyte (pg). Staining: MY. Bars: 10 µm (A–F), 7 µm (G).
Preceding the appearance of oils droplets in the cytoplasm, the primary growth oocyte started to be surrounded by a second layer of cells, the theca cells (Fig. 6 D). At this stage, the zona pellucida continued to respond positively to PAS. At the appearance of oil droplets and cortical alveoli, the zona pellucida became slightly thicker, responding to PAS. A new acellular layer that responded positively to MY was observed around the oocyte, indicating the deposition of a new protein layer next to the polysaccharide layer (Fig. 6 E). Upon entering secondary growth, the glycoproteic layer of the oocytes of C. striatus (zona pellucida) became even thicker (Fig. 6 F). At the end of secondary growth, the zona pellucida reaches its maximum development (Fig. 6 G). Follicle cells remain squamous throughout this period of oocyte development (Fig. 6 A–G).
Oocyte maturation versus follicular atresia
At the end of secondary growth oocyte, the ovaries of confined C. striatus begin to show large alterations in colour, size, volume and blood supply over the days of confinement, when compared with the ovaries of the animals in the control group.
In the ovaries of the control group animals, the secondary growth oocytes follow their development and maturation (Fig. 7). Oocyte maturation was characterized by migration of the nucleus towards the animal pole (Fig. 7 A). At the end of oocyte maturation, the yolk globules of C. striatus gradually fuse (Fig. 7 B) and become completely fluid, forming a homogeneous yolk mass (Fig. 7 C). The oil droplets among the yolk globules (Fig. 7 A), merge in larger droplets (Fig. 7 B), forming a single large drop (Fig. 7 C).

Figure 7. Histological sections of the ovaries of Chaetodon striatus, showing oocyte maturation observed in the control group. (A) Full-grown oocyte, with eccentric nucleus (n). The yolk globules (y) and oil droplets (od) are individualized. (B) Oocyte in final maturation, with yolk globules (y) and oil droplets (od) partially fused. (C) Maturing oocyte with fused yolk (v) and a single oil drop (od). This oocyte is capable of undergoing ovulation. The yolk is fluid and the oocyte hydrated. (D) Post-ovulatory complex (poc), connected to the germinal epithelium (ge). (E, F) Detail of a post-ovulatory complex (poc), formed by follicle cells (f), basement membrane (bm) and theca cells (t). Follicle cell (f), micropylar cell (mic), secondary growth oocyte (sg), zona pellucida (zp). Staining: MY. Bars: 80 µm (A–D), 40 µm (E), 15 µm (F).
After ovulation and release of the oocytes into the ovarian lumen, the follicle complex – formed by the oocyte surrounded by follicle cells, basement membrane and theca cells – remains in the ovary, connected to the germinal epithelium, forming the post-ovulatory complex (Fig. 7 D–F). During oocyte maturation, the zona pellucida does not undergo changes (Fig. 8 A), however a small opening in this layer, called a micropyle, can be seen in some maturing oocytes (Fig. 8 B). Follicle cells, conversely, can vary from squamous to cubic shapes (Fig. 8 A–D).

Figure 8. Histological sections of the ovaries of Chaetodon striatus, showing the follicle envelope of each type of oocyte shown in the Figure 7. (A) Follicle envelope of full-grown oocyte with eccentric nucleus (n). (B) Follicle envelope of full-grown oocyte showing the micropyle region (mi) in the zona pellucida (zp). (C) Follicle envelope of oocyte in final maturation. (D) Follicle envelope of maturing oocyte. Follicle cell (f), oil droplet (od), yolk globule (y), zona pellucida (zp). Staining: MY. Bars: 15 µm.
In the ovaries of confined group animals, fully grown oocytes failed to reach their oocyte maturation and entered atresia (Fig. 9), therefore different stages of follicular atresia were observed. In these atretic follicles, the yolk globules partially fuse and become fluid, forming a heterogeneous yolk mass (Fig. 9 A, B). The oil droplets also partially fused forming larger droplets (Fig. 9 A–C). At the end of atresia, the ovarian follicle loses its organization, becoming completely unstructured (Fig. 9 C).

Figure 9. Histological sections of the ovaries of Chaetodon striatus showing the progression of follicular atresia in ovaries of animals in the confined group. (A–C) Atretic follicles in different stages of degeneration. Note the disorganization of the follicle envelope and the yolk globules (y) partially fused. Follicle cell (f), oil droplet (od), zona pellucida (zp). Staining: MY. Bars: 70 µm.
During atresia, follicle cells become cuboid (Fig. 10 A, B), with a rounded nucleus and vacuolated cytoplasm (Fig. 10 B). With the progression of atresia, the follicles presented disruption of their envelopes (Fig. 10). The zona pellucida was progressively more tortuous and disorganized (Fig. 10 A) until becoming totally segmented (Fig. 10 B) and morphologically unrecognizable (Fig. 10 C). Follicle cells gradually entered cell death, detected by the presence of apoptotic bodies (Fig. 10 A). At the end of follicular atresia, follicle cells lose connection to their basement membrane and mix with yolk globules and fragments from the zona pellucida that are scattered in the vestigial cytoplasm of the degenerating oocytes (Fig. 10 C).

Figure 10. Histological sections of the ovaries of Chaetodon striatus showing the follicle envelopes of the follicular atresia shown in the Figure 9. (A) Envelope of atretic follicle (af) at the beginning of degeneration. Note the tortuosity of the zona pellucida (zp), which still remains continuous. Follicle cells (f) start to show apoptotic bodies (ab). (B) Atretic follicle (af) with zona pellucida (zp) already segmented. Note the vacuolization of the follicle cells (f). (C) Atretic follicle (af) at the final stage of degeneration. Note the total loss of follicle envelope. Follicle cell (f), oil droplets (gl), yolk globules (y), theca (t), zona pellucida (zp). Staining: MY. Bars: 7 µm.
Basement membrane and follicular atresia
In C. striatus, germinal and stromal compartments of the ovaries are separated by a continuous basement membrane along the epithelium of the ovigerous lamellae (Fig. 11).

Figure 11. Histological sections of the ovaries of Chaetodon striatus showing the basement membrane around the ovarian follicles, through silver impregnation, in both experimental groups. (A) Ovigerous lamellae formed by primary growth oocytes (pg) delimited by the basement membrane (arrow). (B) Detail of (A), showing the germinal epithelium (ge), with germline cysts resting on the basement membrane (arrow). (C) Detail of (A), showing the basement membrane (arrow) developed around the primary growth oocyte (pg). (D) Ovigerous lamellae formed by primary growth (pg) and secondary growth oocytes (sg). (E, F) Detail of (D), showing the basement membrane (arrows) around the secondary growth oocyte (sg), accompanied by follicle cells (f). (G) Ovary with large amount of secondary growth (sg) and full-grown oocytes. (H–J) Detail of (G), showing the gradual thickening of the zona pellucida (zp) and the basement membrane (arrow). In (H), the basement membrane is continuous, but progressively it is segmented (I, J), as the development of the oocyte occurs, indicating that it will enter into atresia. Follicle cell (f), basement membrane (arrows), nucleus (n), primary growth oocyte (pg), secondary growth oocyte (sg), tunica albuginea (ta), zona pellucida (zp). Staining: reticulin method. Bar: 70 µm (A), 50 µm (B, E), 20 µm (C), 100 µm (D, G), 10 µm (F, H–J).
In all animals analyzed, the oogonia and cysts of prophase oocytes, surrounded by somatic cells, were individualized by the basement membrane in several distinct clusters along the germinal epithelium (Fig. 11 A, B). During formation of the ovarian follicle, the basement membrane was gradually synthesized, individualizing each follicle. At this stage of formation of new follicles, a single basement membrane is often observed that is shared by two ovarian follicles (Fig. 11 B, C).
As oocyte development occurs, ovarian follicles, surrounded by their basement membranes connected to the germinal epithelium, gradually project into the ovarian stroma, remaining isolated from the interstitial elements (Fig. 11 D–F). From this interstitial compartment, mesenchymal cells contact the ovarian follicles and differentiate into theca cells, on the basement membrane of the follicle (Fig. 11 D–F). The basement membrane, stained by silver impregnation, by the RM, becomes evident and continuous until the end of secondary growth (Fig. 11 G, H). However, preceding follicular atresia, the basement membrane of the fully grown oocyte becomes segmented and thinner (Fig. 11 I, J).
Segmentation of the basement membrane, in the ovaries of confinement animals, follows follicle degeneration (Fig. 12 A). Follicles at the beginning of atresia (Fig. 12 B) start to present the tortuous and segmented basement membrane (Fig. 12 C, D), following disorganization of the zona pellucida. Basement membrane degeneration is progressive, following the progression of follicular atresia (Fig. 12 E, F). It was not possible to view the advanced stage of follicle degeneration under light microscopy (Fig. 12 G, H).

Figure 12. Histological sections of the ovaries of Chaetodon striatus showing the basement membrane around the atretic follicles, through silver impregnation, in the confined group. (A) Ovary with large amount of atretic follicles (af). (B) Atretic follicles (af), at the beginning of degeneration. (C, D) Detail of (B), showing the zona pellucida (zp) and basement membrane (arrow), which are quite tortuous and at the beginning of segmentation. (E) Atretic follicle in stage more advanced than in (B). (F) Detail of (E), showing few remaining segments of the basement membrane (arrow). (G) Atretic follicle (af) at the end of degeneration. Note that there is no longer any follicular organization. (H) Detail of (G), showing the total absence of basement membrane (arrowhead) around the atretic follicle (af) in an advanced stage of degeneration. Atretic follicle (af), basement membrane (arrow), primary growth oocyte (pg), zona pellucida (zp). Staining: reticulin method. Bars: 100 µm (A), 50 µm (B), 10 µm (C, E–H), 20 µm (D).
In ovaries from the control group animals, the basement membrane of maturing oocytes does not fragment, remaining intact until ovulation occurs (Fig. 13). Therefore, during the final maturation of the oocyte (Fig. 13 A, B), the basement membrane remains evident and continuous with the germinal epithelium, being possible to visualize around the post-ovulatory complex (Fig. 13 C–F).

Figure 13. Histological sections of the ovaries of Chaetodon striatus showing the basement membrane around the ovarian follicles and post-ovulatory complexes, through silver impregnation, in the control group. (A, B) Ovigerous lamellae formed by secondary growth oocytes (sg) and post-ovulatory complexes (poc), delimited by the basement membrane. (C, D) Detail of (A), showing the basement membrane (arrow) developed around the post-ovulatory complex (poc). Note the continuity of the post-ovulatory complex with the germinal epithelium (ge). (E, F) Detail of (D), showing the basement membrane (arrow) around the secondary growth oocyte (sg) and the post-ovulatory complex (poc), accompanied by follicle cells (f). Note the theca (t) in the stromal compartment, separated from the germinal compartment by the basement membrane. Follicle cell (f), primary growth oocyte (pg), secondary growth oocyte (sg), zona pellucida (zp). Staining: reticulin method. Bars: 150 µm (A), 70 µm (B), 50 µm (C, D), 20 µm (E), 10 µm (F).
Ovarian development
C. striatus ovaries showed macroscopic morphological differences between the control and confinement groups, being more reduced over the days of confinement, however macroscopic differences were almost imperceptible. In the control group, ovaries remained developed and yellow during the entire period in captivity.
On the first day in captivity: animals from both experimental groups showed the same type of gonadal pattern, with the same stages of ovarian development (Fig. 14). Control group (Fig. 14 A–D) and confined group animals (Fig. 14 E–H) had ovaries with many secondary growth oocytes in several stages of vitellogenesis, including full-grown oocytes (Fig. 14), with a central nucleus. Secondary growth oocytes in early and intermediate vitellogenesis, as well as primary growth oocytes were observed. Atretic follicles were not observed in any of the groups.

Figure 14. Cross-sections of the ovaries of Chaetodon striatus, of the control group (A–D) and confined group (E–H), showing the female gonadal patterns found on the first day in captivity. (A–D) Ovigerous lamellae (la) formed by integrated germinal epithelium (ge) and oocytes in different stages of development. Note in (D), the organization of the follicle envelope. (E–H) Ovigerous lamellae (la) formed by germinal epithelium (ge) integrated and oocytes in different stages of development. Note in (H), the organization of the follicle envelope. Follicle cell (f), oil droplet (od), yolk globule (v), primary growth oocyte (pg), secondary growth oocyte (sg), zona pellucida (zp). Staining: MY. Bars: 200 µm (A, E), 100 µm (B, F), 50 µm (C, G), 20 µm (D, H).
Third day in captivity: the first morphological differences between the ovaries of the control and confined group animals were observed (Fig. 15). Ovaries from control group animals (Fig. 15 A–D) maintained the same characteristics as the ovaries of the animals analyzed on the first day. Conversely, the confined group animals presented a significant amount of atretic follicles dispersed throughout the gonad (Fig. 15 E–H).

Figure 15. Cross-sections of the ovaries of Chaetodon striatus, of the control group (A–D) and confined group (E–H), showing the female gonadal patterns found on the 3rd day in captivity. (A–D) Ovigerous lamellae (la) formed by integrated germinal epithelium (ge) and oocytes in different stages of development. Note in (D), the organization of the follicle envelope. (E–H) Ovigerous lamellae (la) formed by primary growth oocytes (pg) and secondary growth oocytes (sg). Note the large amount of atretic follicles (af) at the beginning of the degeneration process. In (H), note the loss of the organization of the follicle envelope. Follicle cell (f), oil droplet (od), yolk globule (v), primary growth oocyte (pg), secondary growth oocyte (sg), zona pellucida (zp). Staining: MY. Bars: 200 µm (A, E), 100 µm (B, F), 50 µm (C, G), 20 µm (D, H).
Fifth day in captivity: for the first time, the ovaries of the control group animals had some atretic follicles, with a large number of fully grown oocyte (Fig. 16 A–D). Ovaries from confined animals started to show atretic follicles at different stages of degeneration (Fig. 16 E–H).

Figure 16. Cross-sections of the ovaries of Chaetodon striatus, of the control group (A–D) and confined group (E–H), showing the female gonadal patterns found on the 5th day in captivity. (A) Ovigerous lamellae (la) formed by germinal epithelium (ge) and oocytes in different stages of development. (B) Presence of several atretic follicles (af), scattered among secondary growth oocytes (sg). (C) Note the presence of few primary growth oocytes (pg) bordering the germinal epithelium. (D) Detail of the follicle envelopes of an atretic follicle (af) and a secondary growth oocyte (sg). (E–H) Ovigerous lamellae (la) composed by primary growth oocytes (pg) and atretic follicles (af) in different stages of degeneration. In (H), note the loss of the organization of the follicle envelope of the atretic follicles. Follicle cell (f), germinal epithelium (ge), atretic follicle (af), primary growth oocyte (pg), secondary growth oocyte (sg), tunica albuginea (ta), zona pellucida (zp). Staining: MY. Bars: 200 µm (A, E), 100 µm (B, F), 50 µm (C, G), 20 µm (D, H).
Tenth day in captivity: ovaries of some animals in the control group were characterized by the presence of post-ovulatory complexes (Fig. 17 A–D), in addition to the presence of a large number of secondary growth oocytes. No atretic follicles were detected. Oocytes possibly released in the tank were not found. In the confined group animals, atretic follicles were still observed in large quantities (Fig. 17 E–H), with the majority being in an advanced stage of degeneration. The presence of post-ovulatory complexes was not observed. Next to the germinal epithelium, the presence of a large number of primary growth oocytes was noted (Fig. 17 E–H).

Figure 17. Cross-sections of the ovaries of Chaetodon striatus, of the control group (A–D) and confined group (E–H), showing the female gonadal patterns found on the 10th day in captivity. (A) Ovigerous lamellae (la) formed by germinal epithelium (ge) and oocytes in different stages of development. (B) Presence of several post-ovulatory complexes (poc), dispersed among secondary growth oocytes (sg). (C) Post-ovulatory complex (poc) connected to the germinal epithelium (ge). (D) Detail of a post-ovulatory complex formed by follicle cells (f) and theca cells (t), both separated by a basement membrane (bm). (E–H) Ovigerous lamellae (la) formed by primary growth oocytes (pg) and atretic follicles (af) in different stages of degeneration. Note, in (H), the developed ovarian stroma (st) and the atretic follicles in an advanced stage of degeneration. Germinal epithelium (ge), primary growth oocyte (pg), secondary growth oocyte (sg). Staining: MY. Bars: 200 µm (A, E), 100 µm (B, F), 50 µm (C, G), 20 µm (D, H).
Twentieth day in captivity: all control group animals remained alive. Their gonads were very similar to those found in animals collected on the first day, with a large amount of primary and secondary growth oocytes, and absence of atretic follicles. The presence of post-ovulatory complexes was not detected (Fig. 18 A–D). Conversely, in the confined group, only two animals remained alive until the 20th day of confinement. Their gonads had disorganized germinal epithelium and a large number of primary growth oocytes throughout the entire gonad (Fig. 18 E–H). Secondary growth oocytes were not detected, but some atretic follicles associated with large clusters of macrophages were observed. The tunica albuginea was quite thick.

Figure 18. Cross-sections of the ovaries of Chaetodon striatus, of the control group (A–D) and confined group (E–H), showing the female gonadal patterns found on the 20th day in captivity. (A–D) Ovigerous lamellae (la) formed by integrated germinal epithelium (ge) and oocytes in different stages of development. Note the thick tunica albuginea (ta) in (B) and the organization of the follicle envelope in (D). (E–H) Ovigerous lamellae (la) consisting exclusively of primary growth oocytes (pg) and remaining atretic follicles. Note the thick tunica albuginea (ta) in (E) and (F). (H) Developed ovarian stroma (st) and germinal epithelium (ge) disorganized. Follicle cell (f), germinal epithelium (ge), primary growth oocyte (pg), secondary growth oocyte (sg), zona pellucida (zp). Staining: MY. Bars: 200 µm (A, E), 100 µm (B, F), 50 µm (C, G), 20 µm (D, H).
Plasma cortisol levels
On the first day in captivity, the baseline values of plasma cortisol of C. striatus in the control group and confined group animals were 85.8 ± 5.97 ng/ml and 85.4 ± 2.70 ng/ml, respectively, (Fig. 19), 30 min after handling the fish in new tanks. There was no significant difference between groups.

Figure 19. Variation in plasma cortisol levels of Chaetodon striatus as a function of time (days) in captivity. Equal letters indicate that there is no significant difference within the same group (P < 0.05) and the error bars represent the standard deviation. *There was no statistical difference between the control and confined groups.
On the 3rd day in captivity, the control group animals showed a significant peak in cortisol levels of 265 ± 19.42 ng/ml, being also the highest peak among the confined animals (590.0 ± 26.35 ng/ml).
After the 5th day in captivity, the plasma cortisol levels in the control group animals decreased by half (119.8 ± 5.93 ng/ml), remaining unchanged between the 10th 20th day (53.6 ± 3.29 ng/ml and 53.8 ± 2.17 ng/ml, respectively). In the confined group animals, the plasma cortisol levels decrease to 388.4 ± 7.67 ng/ml and 242.0 ± 51.09 ng/ml on the 5th and 10th day, respectively. On the 20th day in captivity, the cortisol level in the surviving animals in confinement was 52.5 ± 2.12 ng/ml, with no significant difference between the control and confinement groups.
Glucose levels
On the first day in captivity, the baseline values of glucose of C. striatus in the control group and confined group animals were 82.8 ± 3.11 mg/dl and 86.0 ± 3.87 mg/dl, respectively (Fig. 20), 30 min after handling the fish in new tanks. There was no significant difference between groups. Between the 3rd and the 20th day, the glucose values in the control group remained between 33.4 and 35.2 mg/dl, with no significant difference within the group during this period (Fig. 20).

Figure 20. Variation in glucose levels of Chaetodon striatus as a function of time (days) in captivity. Equal letters indicate that there is no significant difference within the same group (P < 0.05) and the error bars represent the standard deviation. *There was no statistical difference between the control and confined groups.
The highest glucose peak was found in an animal in the confined group (167.0 mg/dl), on the 3rd day in captivity, in which the average was 135.0 ± 22.70 mg/dl. On the 5th day of confinement, the glucose values started to decrease (30.6 ± 1.52 mg/dl), reaching 21.6 ± 1.52 mg/dl on the 10th day. However, on the 20th day, the average increased again, reaching a value of 64.0 ± 1.41 mg/dl (Fig. 20).
Discussion
Ovarian structure and female germinal epithelium
Although the pattern of morphological organization and anatomical position of the ovaries of C. striatus has been described previously (Bayona Perez et al., Reference Bayona Perez, Mazzoni and Quagio-Grassiotto2020), showing the same characteristics of the female gonads found in other Teleostei, the detailed description of the process of folliculogenesis in this species, as well as details of the follicular complex, has not been addressed. This makes the description of the oocytes in this work essential to achieve a comparison between the control and experimental groups.
Even though it is already known that folliculogenesis events are quite conserved among Teleostei (Quagio-Grassiotto et al., Reference Quagio-Grassiotto, Grier, Mazzoni, Nóbrega and Amorim2011; Mazzoni and Quagio-Grassiotto, Reference Mazzoni and Quagio-Grassiotto2017), knowledge of this process in C. striatus is extremely important to identify possible changes in confined animals. Therefore, the basic description of folliculogenesis and oocyte development was necessary here to compare between experimental groups. Therefore, when analyzing the ovaries of C. striatus, we observed a common pattern found in the other Teleostei: the compartmentalization of the gonadal tissue, consisting of a germinal and an interstitial compartment, both separated by a basement membrane (Grier, Reference Grier2000; Grier et al., Reference Grier, Uribe and Parenti2007; Quagio-Grassiotto et al., Reference Quagio-Grassiotto, Grier, Mazzoni, Nóbrega and Amorim2011; Mazzoni and Quagio-Grassiotto, Reference Mazzoni and Quagio-Grassiotto2017). From the germinal epithelium, in the germinal compartment, formation of ovarian follicles will occur throughout the animal’s reproductive life (Grier et al., Reference Grier, Uribe-Aranzábal and Patino2009), through the process of folliculogenesis (Quagio-Grassiotto et al., Reference Quagio-Grassiotto, Grier, Mazzoni, Nóbrega and Amorim2011). In the control group animals, folliculogenesis occurs according to the same events observed in other freshwater fish (França et al., Reference França, Grier and Quagio-Grassiotto2010; Quagio-Grassiotto et al., Reference Quagio-Grassiotto, Grier, Mazzoni, Nóbrega and Amorim2011; Wildner et al., Reference Wildner, Grier and Quagio-Grassiotto2013; Mazzoni and Quagio-Grassiotto, Reference Mazzoni and Quagio-Grassiotto2017), showing that this process is very conserved among the Teleostei, even in saltwater species, as is the case for C. striatus.
However, in the confined group animals, folliculogenesis was directly affected, possibly by stress triggering factors, leading to the death of the germinal epithelium and gonadal tissue disruption. This cell death in the germinal epithelium may have been caused by degradation of the basement membrane (Mazzoni et al., Reference Mazzoni, Grier and Quagio-Grassiotto2015). If this basement membrane is degraded, there is no maintenance of the germinal epithelium, leading to cell death and atresia of the ovarian follicles.
Synthesis of the basement membrane by the follicle cells allows the complete constitution of the follicle complex and communication between the germinal and interstitial compartments, promoting nutrition via blood vessels, and consequently development of the oocytes (Mazzoni et al., Reference Mazzoni, Grier and Quagio-Grassiotto2015). Therefore, the absence or degradation of the basement membrane causes entrance of the oocyte into atresia and degeneration of the germinal epithelium (Mazzoni et al., Reference Mazzoni, Grier and Quagio-Grassiotto2015). This information may explain the fact that the ovarian follicles of the confined group animals enter atresia at the moment when they are fully developed (fully grown oocytes), as their basement membrane begins to be segmented at this stage, leading the follicle to a continuous and irreversible process of follicular atresia.
Another factor to be considered is the presence of large numbers of granulocytes in the germinal epithelium of the ovaries of confined animals. These cells would be able to enter germline cysts only after breakdown of the basement membrane (Mazzoni et al., Reference Mazzoni, Grier and Quagio-Grassiotto2015, Reference Mazzoni, Lo Nostro, Antoneli and Quagio-Grassiotto2018), which in fact happens during this period. In addition, the absence of the basement membrane leads to disorganization of the germinal epithelium, and degeneration of epithelial cells and germline cysts (Mazzoni et al., Reference Mazzoni, Grier and Quagio-Grassiotto2015), which explains the large numbers of apoptotic bodies in the germinal epithelium of confined animals, as well as in the follicle layer. These results suggest that granulocytes may play an important role in the degradation of the basement membrane also in C. striatus, as observed during remodelling of the gonadal tissue of other fish species (Santana and Quagio-Grassiotto, Reference Santana and Quagio-Grassiotto2014; Mazzoni et al., Reference Mazzoni, Lo Nostro, Antoneli and Quagio-Grassiotto2018).
All these changes observed in the C. striatus ovaries went unnoticed by statistical evaluation when the gonadosomatic indices of both groups were compared (data not shown). However, the existence of a morphological difference between the ovaries is clear. This shows the importance of a thorough histological analysis when the analyzed time interval is small between sampling.
Plasma cortisol, glucose and the ovarian structure
When we associate the plasma cortisol and glucose levels with the gonadal morphology of C. striatus, and these data are compared between control and confined groups, we can assume that stress caused during confinement of the animals has contributed significantly to the high amount of follicular atresia and cell degeneration found in the gonads of the confined group animals, although other factors may be involved in degradation of the basement membrane both of the germinal epithelium, and mainly of the fully grown oocytes.
We know that stress plays a fundamental role in vertebrate ability to survive, including in the life history of fish (Schreck, Reference Schreck2010). Stressor agents affect vital functions of the organism in several ways, depending on their nature and intensity. In fish, for example, low levels of stress can have a positive effect on reproductive processes, while high levels have negative effects (Ostrand et al., Reference Ostrand, Cooke and Wahl2004). However, reproduction in fish can also be affected to a greater or lesser extent, depending on when the animal is exposed to stress during its life cycle, causing early spawning or inhibition of reproduction (Campbell et al., Reference Campbell, Pottinger and Sumpter1992; Schreck et al., Reference Schreck, Contreras-Sanchez and Fitzpatrick2001; Small, Reference Small2004; Shourbela et al., Reference Shourbela, Abd El-Latif and Abd El-Gawad2016). That is, the high rates of follicular atresia found in the gonads of animals in confinement may be a reflection of the exacerbated increase in plasma cortisol, especially on the 3rd post-confinement day, in which levels of cortisol and glucose are at the highest peak, causing, possibly, entry into follicular atresia, which is observed on the 5th day of confinement. Similarly, the control group animals may have been favoured by milder peaks of cortisol and glucose, leading to a possible release of oocytes in captivity, as well as completion of oocyte maturation, observed on the 10th day in captivity.
In addition, stressors found during a developmental period of the animal’s life may have an effect during later stages throughout the reproductive cycle (Gowaty et al., Reference Gowaty, Anderson, Bluhm, Drickamer, Kim and Moore2007). In this regard, handling during capture and transport to the laboratory may have contributed to a large extent to the follicular atresia found in confined animals, although the control group did not present such characteristics.
Effects of stress are transduced through a neuroendocrine cascade initiated by the perception of the stressor agent from the pituitary gland, culminating in the release of corticosteroids (Schreck, Reference Schreck2010). This increase in hormonal levels results in changes in secondary physiological responses by most organs and systems of the organism, including the reproductive capacity (Schreck, Reference Schreck2010). Therefore, although the stress caused by capture, management or confinement can lead to follicular atresia of mature oocytes in the fish (Small, Reference Small2004; Pankhurst, Reference Pankhurst2011), costly reproductive processes such as vitellogenin production seem to be protected even during severe stressful situations (Schwindt et al., Reference Schwindt, Feist and Schreck2007). This fact may explain the presence of the large number of fully grown oocytes, with large numbers of yolk globules. However, confinement of the animals may have been largely responsible for atresia of these follicles. This shows the importance of acclimatizing animals in quarantine, when removed from their habitat and transferred to captivity, especially of more sensitive species, such as C. striatus.
In the present study, the specimens of C. striatus showed intense follicular atresia, possibly due to the confinement conditions, as on the first day of analysis, post-acclimatization, both the animals in confinement and the control group, had the same structural ovarian characteristics, with active germinal epithelium, oocytes at different stages of development, absence of cell death to a high extent in the epithelium and low numbers of atretic follicles. In addition, the cortisol levels, on first day, in both groups were significantly lower than the levels on the 3rd day of analysis, showing a significant difference. In this respect, we can assume that if the ovaries suffered structural damage after management and transport, they were repaired during the quarantine period. Therefore, despite the fully grown oocytes entering atresia in the confined group, possibly the animals would present ovarian recovery and be able to spawn in the next reproductive cycle, as observed after 20 days of confinement.
The confinement in a reduced space of water volume, in addition to increasing the plasma levels of cortisol, increasing the stress of the animals, made them stop feeding and become more aggressive, which even culminated in the majority death. However, after only two animals remained in confinement, they returned to feed, increasing glucose levels and decreasing plasma cortisol, which was statistically equal to the cortisol levels of the control group.
Possibly, the significant difference between the glucose levels of the confined group on the 10th (21.6 ± 4.72 mg/dl) and on the 20th day (64.0 ± 1.41 mg/dl), is due to the fact the animals returned to feed, although there was a statistical difference on the 20th day between the control group (35.0 ± 2.35 mg/dl) and the confined group (64.0 ± 1.41 mg/dl). In this regard, the care required in the handling, transport and storage of fish in captivity requires adaptation to specific conditions to ensure both survival and animal welfare. Although baseline values of plasma cortisol in fish vary according to species, the values found for C. striatus were similar to those found for other species, which can be extremely low as in rainbow trout Salmo gairdneri (2 ng/ml) (Barton et al., Reference Barton, Peter and Paulencu1980) or higher as in the Cypriniformes Leuciscus cephalus, 250 ng/ml (Pottinger et al., Reference Pottinger, Carrick, Appleby and Yeomans2000). Glucose levels also vary, with baseline values of 110 mg/dl in salmonids (Barton, Reference Barton2000) while levels are close to 40 mg/dl in sturgeon (Huso huso) (Falahatkar et al., Reference Falahatkar, Poursaeid, Shakoorian and Barton2009) and in tilapia Oreochromis mossambicus (Pratap and Wendelaar Bonga, Reference Pratap and Wendelaar Bonga1990), for example. The data found here for the levels of cortisol and glucose in C. striatus can serve as a reference for future studies, especially in attempts to reproduce this species in captivity.
In conclusion, confinement in a small space proved to be a stressor for C. striatus, altering its plasma levels of cortisol and glucose, making the animal more aggressive and inhibiting its appetite. C. striatus was extremely sensitive to environmental changes, which interfered with the maturation of their gametes, causing a high process of follicular atresia in the females. Follicular atresia was caused by breakdown and loss of the basement membrane around the ovarian follicles. This significant process of follicular atresia may be largely responsible for the difficulty in reproducing several marine species in captivity.
Despite this, C. striatus is able to acclimate and possibly produce viable gametes again, due to recovery of germinal epithelium and gonadal tissue plasticity. However, for this process to be successful, it is essential to maintain animals in spacious environments and be careful when handling, to avoid triggering stress in these individuals.
Author contributions
Talita Sarah Mazzoni contributed to the experiments, analyzed data, discussed the results and wrote final version of the manuscript. Graziele Cristine da Silva performed sample collection and preparation, performed the experiments and analyzed data. Isabelle Leite Bayona Perez contributed to experiments. Irani Quagio-Grassiotto conceived and designed experiments, and reviewed the manuscript.
Conflicts of interest
The authors declare that they have no conflict of interest.
Financial support
This research received no specific grant from any funding agency, commercial or not-for-profit sectors.
Ethical standards
The authors confirm that the ethical policies of the journal, as noted on the journal’s author guidelines page, have been adhered to and the appropriate ethical review committee approval has been received. All applicable international, national, and/or institutional guidelines for the care and use of animals were followed according Ethics Committee on Animal Experimentation of the Institute of Biosciences of Botucatu – number 805 – CEEA-IBB/UNESP.