

1. Introduction
Subsidies to the production and consumption of fossil fuels and fossil fuel products have been widely debated in recent years. These subsidies were found to incur high fiscal costs on governments, lead to corruption, cause a misallocation of resources, harm the competitiveness of alternative energy sources, and lead to excess consumption which itself caused an increase in air pollution and carbon emissions.
As a result, the G-20 and APEC committed to phasing out inefficient fossil fuels in 2009. In 2010, an international network of countries called the ‘Friends of Fossil Fuel Subsidy Reform’ was created and their communiqué to phase out fossil fuel subsidies was signed by 43 countries by 2019. In 2015, countries re-emphasized their commitment to fossil fuel subsidy reform in the Financing for Development Addis Ababa Action Agenda. And finally, in the same year, fossil fuel subsidy reform was included as a target of the Sustainable Development Goals under SDG 12.C. Despite the many international calls for fossil fuel subsidy reform, there remain several lacunae in researching the impacts of these subsidies and their reform.
There is wide-ranging agreement that fossil fuel subsidy reform would increase world GDP through a combination the lowering of fossil fuel demand, a reduction of fiscal expenditure on subsidies, and a general improving of allocation of resources (Yusoff and Bekhet, Reference Yusoff and Bekhet2016; Ellis, Reference Ellis2010). Some studies have indicated these changes in GDP have a significant impact on trade. For example, in the case of Ghana, models on the removal of subsidies on refined oil imports have showed that a short-term reduction of real GDP in Ghana would have positive spillovers on regional neighbors and improve their economic growth and output (Wesseh and Lin, Reference Wesseh and Lin2016). This indicated that a change in the structure of economic output affects terms of trade in different sectors.
Overall, however, it remains difficult to assess terms of trade for two reasons. On the one hand, there is insufficient information on input–output linkages, which makes the assessment of impacts from fossil fuel subsidies and subsidy reform more difficult (Clements et al., Reference Clements, Jung and Gupta2003). On the other hand, the impacts of fuel subsidy removal change over time. Initially there is a contraction of the economy but if, as theorized, investment increases in the medium term, then capital accumulation would allow for new domestic production (Al Shehabi, Reference Al Shehabi2013).
One should note that the trade impacts of fossil fuel subsidies and subsidy reform ultimately depend on a firm's available response measures. In theory, firms can (1) absorb a price shock, (2) substitute certain energy inputs by other, cheaper energy inputs, (3) improve resource efficiency, and (4) pass-on costs to the consumer. If the first three are impossible, it is likely that a firm's competitiveness on the international market is harmed by the fourth response measure, which is the one through which a production cost increase directly leads to higher product prices (Rentschler et al., Reference Rentschler, Martin and Morgan2017). This negative trade impact would be amplified when other governments continue to subsidize energy inputs, showing how important coordinated subsidy reform is to avoid pressure on domestic economies via unfair competition on international markets.
One such area that lacks analytical research is the trade impacts of fossil fuel subsidies. The absence of knowledge on those trade impacts has been an important reason why the topic of fossil fuel subsidy reform has been absent from the agenda of the World Trade Organization. In 2017, 12 WTO members recognized the need to address this topic in the WTO by issuing a Ministerial Statement at the WTO's Eleventh Ministerial Conference (MC11) in Buenos Aires. The Statement asked to ‘advance discussion in the World Trade Organization aimed at achieving ambitious and effective disciplines on inefficient fossil fuel subsidies that encourage wasteful consumption’.
In October 2018, the International Institute for Sustainable Development and the Graduate Institute of International and Development Studies organized a research workshop on the trade impacts of fossil fuel subsidies. This special issue of the World Trade Review is a compilation of original research presented at that workshop.
The key focus of this introductory article is on the types of trade impacts of fossil fuel subsidies. The following will emphasize that there appear to be large direct trade impacts and large pass-through trade impacts. Direct trade impacts are found when producer subsidies affect the markets for crude energy products such as crude oil, natural gas, and coal. Direct trade impacts are also found when consumer subsidies decrease the input costs of various industries, whether they refine crude products into energy carriers (e.g. gasoline, electricity) or they use energy products to produce non-energy products (e.g. iron and steel, plastics). Pass-through trade impacts are found when upstream fossil fuel subsidies lead to a lower-cost product that can then be used in production processes downstream. For example, a steel producer may not enjoy a direct consumer subsidy, but he can still benefit from upstream coal subsidies that lower the price of coal (a key input for steel production). We find that markets for fossil fuels, refined energy products and non-energy, energy-intensive products are enormous. Their trade volume and export value, as well as their competition density highlight that fossil fuel subsidies have a direct impact on who wins and who loses in terms of market share.
2. Type of Fossil Fuel Subsidy Trade Impacts
The trade impacts of fossil fuel subsidies have not yet been thoroughly analyzed. Studies have often indicated the impact that subsidies and subsidy reform can have on the domestic economy and domestic sectors. The trade exposure of these sectors is however rarely discussed. Section 3 describes that trade exposure and concludes that trade in upstream and downstream fossil fuel products is both highly dispersed and monetarily very valuable. This section discusses the type of fossil fuel subsidy trade impacts. It aims to build a conceptual overview of pathways through which fossil fuel subsidies, directly or indirectly, impact international trade. It will first discuss the difference between direct effects and pass-through effects, followed by an overview of the fossil fuel product value chains as relevant to the trade impacts of fossil fuel subsidies.
2.1 Direct and Pass-Through Effects
Articulating the trade impacts of fossil fuel subsidies may seem intricate but is not any more difficult than assessing the trade impacts of other subsidies that serve a complex value chain. The key questions surrounding the trade impacts of fossil fuel subsidies rely on the identification of ‘markets’ for products that benefit directly or indirectly from various fossil fuel subsidies. In the US–Cotton dispute,Footnote 1 the WTO Panel established that geography is not a primary determinant as long as there is competition for the sale of a product or service that provides an appropriate foundation for a finding that a ‘market’ exists (WTO, 2004, para. 7.1237). In the empirical section below (Section 3), we highlight the existence of these markets. To understand that fossil fuel subsidies have a multiplicity of trade impacts, it is important to emphasize the complex link between subsidies and markets up front. On the one hand, one single fossil fuel subsidy might have trade impacts on several different markets. On the other hand, one single market can be affected by several fossil fuel subsidies. Figure 1 shows that a subsidy may have a direct trade impact in the market of the subsidized good, and an indirect or ‘pass-through’ effect on secondary markets in which a domestic producer uses a subsidized good as an input in its production process.

Figure 1. First and pass-through effects of fossil fuel subsidies
It should be noted that WTO Panels and the Appellate Body have indeed recognized that various subsidies often have a cumulative impact on producers and as a combined result cause adverse impacts on trade. This was first recognized in the US–Cotton dispute, in which the Panel recognized that the effects of government support programs should be considered in their entirety rather than individually (WTO, 2004, para. 7.1345). It thus needs a cumulative assessment of the multiplicity of subsidies that may affect any given product.
2.2 Subsidies in the Fossil Fuel Value Chain and Their Trade Impacts
Markets that are affected by fossil fuel subsidies can be found across the entire value chain. These markets can be found upstream in fossil fuel production, downstream in end uses, and in between in transmission and distribution support (e.g. transport and storage). Upstream markets for primary mining commodities include markets for crude oil, natural gas, and coal. More downstream markets include those for transport fuels (gasoline, diesel, or kerosene), industrial energy-intensive industries (petrochemicals, fertilizer, iron and steel, cement, paper and pulp, food), industrial electricity intensive industries (aluminum, steel, and other non-ferrous metals such as copper, zinc, tin), and grid-scale electricity generation. These lists are by no means exhaustive.
Figure 2 shows the fossil fuel value chain and potential trade impacts of subsidies in that value chain. I define producer subsidies as subsidies that go to fossil fuel production processes, which include upstream production and midstream refining. Consumer subsidies are subsidies that directly incentivize the consumption of fossil fuels, in reality mostly pricing policies or consumption tax subsidies. This figure however does not include transport subsidies, which are fundamental for certain types of fossil fuels, most notably natural gas. The key potential impacts are in increasing market share in comparison with the no-subsidies counterfactual (both on the domestic and international market) as well as the reduced competitiveness of alternatives.

Figure 2. The value chain and fossil fuel subsidy trade impacts
2.3 Direct Trade Impacts of Fossil Fuel Production Subsidies
The largest trade impacts of fossil fuel production subsidies are in upstream markets for crude products. This is also shown in the market value and exposure data presented below (Section 4). Producer subsidies come in many forms of financial contributions. They can take the form of direct transfers of funds, loan guarantees, foregone government revenue such as tax exemptions, and government provided goods or services. It is often a combination of several subsidies that grant a substantial benefit to fossil fuel producing sectors.
Table 1. Specific fossil fuel producer support in G-20 countries as reported in the OECD support inventory (US$million)

Notes: (1) OECD producer support estimates exclude general services support estimates, which often lack clarity to link support directly to an increase in production. The OECD inventory only considers direct budgetary transfers and tax expenditure, excluding several other subsidies such as government provided infrastructure and loan guarantees. (2) The negative values for US petroleum subsidies are related to the OECD estimate for temporary expenses of equipment for refining. Since the inventory reports cash-based tax expenditure estimates, investment cycles can result in years of negative tax expenditures.
Source: OECD, 2019.
The most important first-order trade impact is the effect that (the combination) of oil, gas, and coal subsidies have on displacing or impeding exports of like products on the market of the subsidizing economy and third country markets. In short, subsidies contribute to a battle for market share. Subsidies can increase a subsidizing country's market share relative to the no-subsidies counterfactual. That could allow for a reduction of imports and a higher share in the international market. These effects are currently codified by WTO subsidy law as potentially giving rise to serious prejudice to the interests of another WTO member (under ASCM Article 6.3).
The likelihood of serious prejudice is even more strongly pronounced when observing that producer subsidies seem mostly to target the key drivers of crude fossil fuel prices. In the case of oil, the most important cost component is that of extraction and production. Many oil subsidies seek to influence these processes to make domestically produced oil competitive vis-à-vis international competitors. Most importantly, countries subsidize the production of types of oil that would otherwise face tougher competition, such as those of specific oil types (e.g. tar sands), those in more difficult geographic and geological locations (e.g. offshore or specific subsoil properties), and those that are losing economic performance (e.g. depleting fields). Other subsidies target investment in and the development of new oil resources that are aimed at competing on the international market. These can include several types of tax exemptions for exploration and development costs, accelerated depreciation or excess of percentage over cost depletion, the amortization of geological and geophysical expenditure or royalty reductions. The joint impact of these measures is to support factors of production of national hydrocarbon development, with the ultimate goal to improve the competition of domestic producers on the international markets for crude oil and petroleum product.
The most important cost component of the natural gas price is its transportation costs. Unlike oil markets, natural gas markets are not yet global but are rather regionally anchored around gas distribution infrastructure. That being said, the gas market has become more complex and more globalized in recent years, and continues to develop in this direction, mainly as a result of US shale gas and the growing market share of liquefied natural gas (LNG). Many natural gas production subsidies are now aimed at lowering the cost of production and increasing the use of natural gas. The largest subsidies to oil production are also often granted to natural gas production. Other subsidies often incentivize exploration via tax exemptions and royalty reductions or target the key cost component of the natural gas price (transport) by incentivizing the construction of pipelines and distribution networks.
Like oil and gas, many existing coal production subsidies focus on types of coal that would otherwise lose competitiveness vis-à-vis substitutes. For example, the US has tax credits for coal mined from thin seams and areas with a higher overburden ratio, or Russia also provides support for extraction from already mature mines. Other subsidies support the cost of production by taking over cost components that would otherwise be covered by coal companies. Some subsidies are used to protect the safety of mining sites, while others directly benefit certain aspects of coal development such as drilling in specific geological structures.
2.4 Direct and Pass-Through Trade Impacts of Subsidies that Benefit Refined Products and Energy-Intensive Industries
Subsidies to transformation can come in two main ways. First, upstream production subsidies can lower the production costs of crudes and therefore the input costs of businesses that transform those crudes into refined energy carriers or products. Second, consumption subsidies can do the exact same, but more directly. Various producers use fossil fuels in their production processes. As a result, fossil fuel consumer subsidies can reduce their production costs relative to a no-subsidies counterfactual. Table 2 shows some of the key markets that can be affected by fossil fuel subsidies.
Table 2. Markets potentially affected by fossil fuel subsidies

Source: Moerenhout and Irschlinger (Reference Moerenhout and Irschlinger2020).
If oil, gas, and coal consumption subsidies are specific to certain end-users, then the products or services produced by these sectors gain a competitive advantage both within the home market vis-à-vis imports and on international markets. The subsidy can cause the displacement or impediment of imports of a like product from another producer into the subsidizing country or into the world market. This is particularly the case for energy-intensive products or services, but also applies to other sectors with stiff competition.
Another trade impact lies in the impact fossil fuel subsidies may have on potentially non-like products that can act as substitutes. If oil, gas, and coal subsidies lead to a higher market share for certain products that have available foreign and unsubsidized substitutes, then the producers of those substitutes lose out on potential market uptake in the subsidizing economy. To give an example, if electricity producers receive subsidized coal as an input, the competitiveness of renewable energy infrastructure and its uptake in the coal-subsidizing market may be impacted, even though the directly subsidized good (coal) and renewable energy infrastructure are not like products.

Figure 3. Trade impacts of producer subsidies
2.5 Trade Impacts of Fossil Fuel Subsidies to Final Consumption
There are at least four trade impacts of fossil fuel consumption subsidies that are not specific. On the one hand are economy-wide effects. First, if many countries have economy-wide consumption fossil fuel consumption subsidies, then first-order and pass-through effects lead to excess demand for and consumption of energy products and energy-intensive products on a global scale. This creates adverse trade impacts for countries with liberalized energy pricing mechanisms. By insulating a huge number of end users from cost-reflective prices worldwide, the subsequent excess demand leads to an appreciation of trading prices for energy products. Consequentially, it is end users within countries with liberalized pricing policies that carry the pressure of higher international energy prices, which negatively affects their competitive position on domestic and international markets. Second, fossil fuel subsidies result in air pollution and global warming, which directly harm consumers and citizens and as a result negatively affect the productivity of workers and firms (see for example He et al., Reference He, Liu and Salvo2019; Graff Zivin and Naidell, Reference Graff Zivin and Neidell2011).
On the other hand, there are trade impacts between neighboring countries. First, consumption subsidies for easily transportable energy products (especially gasoline, diesel, kerosene, and LPG) can lead to smuggling of these products to markets with higher prices. While this would benefit that market's local economy, it would harm the market share of legitimate fuel product suppliers. Second, electricity consumption subsidies can dissuade the entry and competitiveness of renewable energy alternatives. They can also prohibit cross-border electricity trade if domestic subsidized tariffs are too low for neighboring suppliers to recover costs.
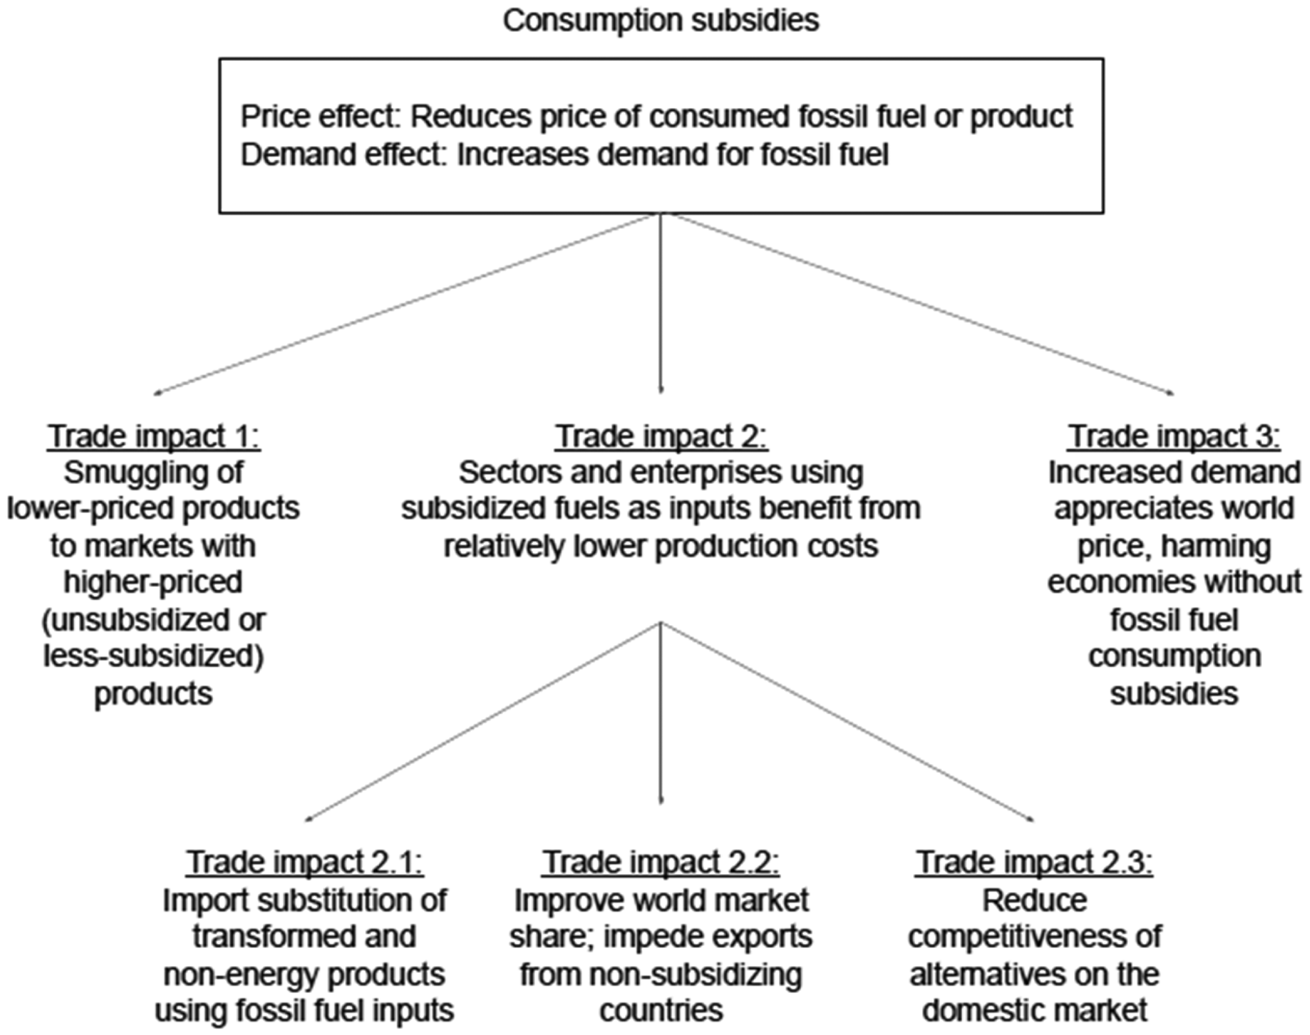
Figure 4. Trade impacts of consumption subsidies
3. Markets for Upstream and Downstream Fossil Fuel Products
Section 2 showed the various pathways through which fossil fuel subsidies could impact trade. It particularly highlighted that fossil fuel subsidies can affect the marginal cost of production which in turn gives a competitive edge to subsidized products. This section 3 first assesses the high trade volumes of various fossil fuels and downstream products. Second, we look at how large the monetary value of exports of fuels and fuel products is. And third, we address the market concentration of these products. Together, these data show that international markets for upstream and downstream fossil fuel (based) products are highly dispersed and very valuable.
3.1 Trade Volumes
3.1.1 Trade in Crude Oil
About 2 billion tonnes of oil equivalent (btoe) were traded in 2016, accounting for almost half of total global production (IEA, 2018a). In 2017, imports of crude oil and natural gas liquids (NGL) rose by 3.1% compared to 2016 (IEA, 2019a)Footnote 2. The market for crude oil has changed significantly in recent years, with declining exports of crude and NGL from OPEC countries, mainly as a result of US shale oil production and lower-than-expected demand growth. In 2017, exports from OPEC countries fell by 1.4% (Saudi Arabia by 6.7%) whereas US ramped up production by 15.6% (IEA, 2019a).
Crude oil and NGL trade continue to grow alongside consumption, which has grown consistently since the early 1980s – short-term shocks because of financial crises aside. Crude oil trade volumes are expected to continue to grow over the next six years as most refining growth takes place in countries where domestic crude production is stagnant or declining. In total, the IEA expects refinery capacity additions of almost 8 million barrels per day (or about 1.12 million tonnes of oil equivalent, mtoe) by 2023 (IEA, 2019b). US exports of crude oil are also expected to increase and to reach 4.9 mb/d (or about 252 mtoe/yr) by 2023 (IEA, 2019b). Total crude oil trade is expected to increase from 36 mb/d (or about 1.9 btoe/yr) in 2017 to 44.7 mb/d (or about 2.3 btoe/yr) in 2040.
3.1.2 Trade in Natural Gas
Over 1.2 trillion cubic meters (tcm) of natural gas were traded on international markets in 2018 (IEA, 2019c), accounting for about a quarter of total global production (IEA, 2018a). In 2018, global natural gas consumption grew by over 4.6% (IEA, 2019c) and global trade grew by 2.9% (IEA, 2018b). The overall trend of moving from regulated prices to market pricing is expected to foster competition among suppliers in the coming years to cover the growing global demand. It is notable that the number of territories with LNG import terminals grew from 9 in 2000 to 41 in 2018 (IEA, 2019d), with LNG now covering about one third of global natural gas trade (IEA, 2019c) and expected to become dominant in the 2020s.
The IEA predicts that by 2040, global gas trade will still account for about 25% of production (IEA, 2018b). To cover increased use of natural gas, an average annual growth rate of 1.6% is expected for both production and trade until 2040, with natural gas overtaking coal as the second biggest source of energy by 2030 (IEA, 2019d). In terms of LNG, there is a growing diversity of sellers and of trading hubs, implying more competition in international trade.
3.1.3 Trade in Coal
Over 1350 million tons of coal were traded in 2017, accounting for about one sixth of total global production (IEA, 2019e). While more and more countries are establishing pathways away from coal, current trade flows still facilitate its use (IEA, 2017). Today, global coal trade grows faster than its consumption. In 2018, exports of coal rose by 4.2%. In general, coal exports have more than doubled (+131%) since 2000. Despite growing air pollution and climate change concerns related to coal consumption, in particular during the last decade, exports in 2018 had still increased by 33% compared to 2010 (IEA, 2019e).
Contrary to other fossil fuels, total coal trade is expected to decline from 1102 Million tonnes of coal equivalent (Mtce) in 2017 to 1089 Mtce in 2040. Even though there is a lot of uncertainty regarding these numbers, current projections remain very problematic for a faster energy transition (which will need a much more rapid reduction of coal consumption). In this scenario, especially steam coal trade would decline due to relatively lower use in power generation, whereas coking coal trade would still increase (from 203 Mtoe or 310 Mtce in 2017 to 346 Mtoe or 529 Mtce in 2040) (IEA, 2018b).
3.1.4 Trade in Petroleum Products
About 600 million tons of refined oil products were traded in 2016, accounting for about 15% of total global production (IEA, 2018a). In 2017, world refinery output increased by 2.0% (IEA, 2019a). Imports of oil products grew 2.6% and exports 2.9% in 2017 compared to 2016 (IEA, 2019a). While this may seem fairly low compared to crude products, it is important to emphasize that the value of refined products is significantly higher than crude fossil fuels (see below).
3.1.5 Trade in Electricity
Trade in electricity remained rather low, at around 350 TerraWatthour (TWh) in 2016, accounting for about 1.4% of total global electricity production (IEA, 2018a). This is in part the result of the historical development of national grids that are not aligned well, but also the result of electricity subsidies (KAPSARC, 2016).
3.2 Trade Value
The United Nations Statistics Divisions and the International Trade Centre (ITC) report statistics on traded volumes and exported values for a whole range of products, categorizing them according to 2-, 4- and 6-digit levels of the Harmonized System (HS) nomenclature. This allows for a strongly disaggregated overview of the values associated with the trade in fossil fuels and refined products. These statistics could thus be used to qualitatively assess a country's interest in international markets and see whether these markets were linked to particular domestic producers or consumer subsidies.
An evaluation of current statistics shows that fossil fuel markets are multi-billion-dollar markets. The largest markets were those for crude fossil fuels and refined fossil fuel products (i.e. including refined energy carriers). Global exports were worth a staggering US$2.3 trillion in 2018, up from US$1.5 trillion in 2016, though this difference can be in large part ascribed to international oil price movements. The most valuable market was the one for crude oil, which had a total export value of US$943 billion in 2018. The second place was occupied by refined petroleum products, which had an export value of US$779 billion. Natural gas came in third with a total export value of US$299 billion.
Importantly, trade statistics also prove that downstream markets are widely traded. Iron and steel products and articles manufactured using iron and steel account for the largest downstream market in terms of export value, with a total export value of US$ 731 billion in 2018. This is followed by plastics and products thereof, whose global exports were valued at US$650 billion in 2018. Paper and pulp exports followed at US$229 billion, aluminum and articles thereof at US$191 billion, and various metal products at US$161 billion in 2018.

Figure 5. Exported value of upstream and downstream mineral fuels and products (US$ billion)
3.3 Trade Dispersion of Upstream and Downstream Products
Trade in fossil fuels and fossil fuel products is widely dispersed. The ITC uses a market concentration index that is based on the Herfindahl index and ranges from 0 to 1, with values closer to 0 indicating a highly competitive market. For all mineral fuels and mineral fuel products, both the import and export concentration index lie around 0.04. Markets for crude oil, natural gas, and coal all have very low import concentration rates among importing countries, at 0.08, 0.07, and 0.09, respectively (ITC, 2019). This indicates that such markets indeed have many importers. At the same time, they have fairly low export concentration rates as well, at 0.06, 0.07, and 0.2, respectively. This shows that there are relatively many exporters for crude oil and gas, and fewer exporters for coal. The combined interpretation of these two indices is that there is a highly competitive market for fossil fuel products, with coal having less competitive density on the international market. As a result, competitive advantages between different national industries in such markets can indeed be influenced by domestic subsidies.
Importantly, markets for petroleum products such as gasoline and diesel are also hugely dispersed, with a concentration rate of 0.03, one of the lowest of all products, and an export concentration rate of 0.05. This indicates that the trade impacts of fuel subsidies going to crude oil, natural gas, and petroleum products are likely significant and large, determining who gains and who loses in terms of competitive advantage and market share. In other words, fossil fuel subsidies may substantially improve national producers’ market share relative to a no-subsidies counterfactual. Other downstream markets also have low concentration indices. For example, iron and steel, the largest energy-intensive industry by trading value, and plastics and plastic products, the second largest energy-intensive industry by trading value, have both import and export concentration indices of around 0.04 (ITC, 2019).
4. Establishing the Empirical Links between Fossil Fuel Subsidies and Their Trade Impacts
4.1 Assessing Fossil Fuel Subsidy Trade Impacts
As already mentioned, fossil fuel subsidies can directly or indirectly affect the marginal cost of production of crude energy products, transformed energy carriers, or energy-intensive products. As a result, industries within the subsidizing jurisdiction can gain competitive advantage vis-à-vis competitors in countries without subsidies and as a result capture a higher share of domestic and international market share. One can compare a number of statistics highlighted in this section to show that the trade impacts of fossil fuel subsidies are largest when those subsidies affect upstream markets, petroleum product markets, and energy-intensive markets. Trade openness in these sectors is generally very high, with large volumes traded for large sums of money. If fossil fuel subsidies affect the marginal cost of production of these products, then it is highly likely they gain a competitive edge on these highly competitive and valuable markets. As shown above, many producer subsidies definitely aim at reducing the marginal cost of production and thus impact international trade significantly.
Table 3. Affected markets and trade exposure

Note: (1) Estimates of trade value represent minimum values since they are based on a conservative accumulation of HS6 product identification codes. (2) Competitive density is about the concentration of importing countries, with a high density (corresponding to a low concentration rate) indicating more dispersed trade. (3) Battle for market share is about the battle within markets for fossil fuels and relevant products, but also against potential alternatives such as renewable energy (for example by crowding out investment).
Source: Author based on IEA statistics (see above) and ITC (2019).
4.2 Existing Literature on Trade Impacts of Fossil Fuel Subsidies
Causally linking fossil fuel subsidies and their trade impacts remains a challenging task. This is not because those trade impacts are absent, but rather because they have not served the primary purpose of existing analyses. Many scholars have used CGE models, especially in the context of the MENA region, which historically has known some of the lowest energy prices. Abouleinein et al. (Reference Abouleinein, El-Laithy and Kheir-El-Din2009) did a CGE model for Egypt, showing that a 10% increase in the natural gas price would lead to a 6.9% increase in electricity production costs. Cockburn et al. (Reference Cockburn, Robichaud and Tiberti2018) concluded that energy-intensive industries and refineries in Jordan and Egypt would reduce productivity as a result of energy sector reform. This pass-through effect also happens due to the increase in electricity prices, affecting electricity intensive industries such as manufacturing. Jensen and Tarr (Reference Jensen and Tarr2003) highlighted that subsidy reform in Iran could reduce the output of energy-intensive sectors such as steel, chemicals, and aluminum by between 25% and 65%, again indicating significant pass-through effects of upstream subsidies. They also modeled direct trade impacts, estimating that subsidy removal would lead to an expansion of exports of up to 76%, mostly as a result of an increase in the export of crude energy products.
Other scholars have also used CGE models to assess subsidy reforms more generally. Burniaux et al. (Reference Burniaux, Château and Sauvage2011) did so and highlighted that a reduction of fossil fuel consumption subsidies globally would lead to a small increase in global trade volumes (0.1%) but a significant shift in trading volumes of particular products and sectors. This would particularly lead to a reallocation of trade flows in products of energy-intensive industries. Clements et al. (Reference Clements, Jung and Gupta2003) used CGE models to show that input–output linkages would cause an increase in production costs of various sectors in Indonesia as a result of fuel subsidy reform. Especially the utilities sector would be hard hit by a reduction of fuel subsidies. In line with other results, Manzoor et al. (Reference Manzoor, Shahmoradi and Haqiqi2012) also confirmed that energy subsidy removal leads to a reduction of non-energy exports (including energy-intensive industries) due to a reduction in demand of domestic producers. Similarly, Ellis (Reference Ellis2010) used CGE models to show that natural gas pricing reforms would reduce the competitiveness of internationally traded petrochemicals. He also showed that consumption subsidies in net importing countries have a positive impact on the terms of trade of exporting countries by inflating the market.
Some scholars have used non-CGE methods. For example, El Massanoui and Verme (Reference El Massnaoui and Verme2015) have used input–output analysis for Morocco to confirm that diesel price increases have larger indirect effects than gasoline in Morocco, mainly because it is widely used for commercial transport. Others have shown the usefulness of case studies. The OECD (2019b) has proven how electricity subsidies have increased the competitiveness of aluminum industries, particularly in China. APICORP (2016) has highlighted that subsidy reforms have hiked input costs of energy-intensive industries and led to higher production costs. Similarly, KAPSARC (2016) elaborated that domestic energy-intensive industries in the Persian Gulf have relied on subsidies in the form of low gas prices to remain competitive in the global market. For example, petrochemical, phosphate, and aluminum plants experienced an increase in production costs. The agricultural sector was also impacted via diesel price reforms.
4.3 This Special Issue on the Trade Impacts of Fossil Fuel Subsidy Reform
This special issue provides a first stab at highlighting the different methodologies that can be used, as well as results from robust analyses of fuel subsidies and their reform. We have indicated that markets are large, valuable, and competitive, but the exact impact of fossil fuel subsidies on trade requires much deeper analysis. The most commonly used methodology to assess fossil fuel subsidies and their reform is CGE modeling. In this special issue, Roos and Adams, as well as Shehabi, use CGE models to assess the trade impacts of fossil fuel subsidy removal in respectively Saudi Arabia and Kuwait, two producers and net exporters. Roos and Adams highlight that removing subsidies in Saudi Arabia would eliminate large distortions in the economy and lead to real GDP rises and an upward improvement in the net volume of trade. They find that the main winners of subsidy reform would be industries who sell commodities to the household, whereas petroleum, electricity, and energy-intensive industries would suffer initial losses. The authors highlight the particular usefulness of CGE models in assessing the impacts of energy subsidy reform.
Shehabi discusses the trade impacts of fossil fuel subsidy reform on trade in a small oil-producing economy. Her model is advanced by incorporating oligopolistic industrial structures, which are often common in small oil-producing countries. She finds that energy subsidies actually have a low impact on trade because of such oligopolistic structures. When reform is implemented during low oil price periods, then trade effects are higher given the reduction in oligopolistic structures. This highlights the need for complementary structural reforms and warns against considering fossil fuel subsidy reform as an easy step toward diversification in energy producing countries.
A second method consists of using input–output models. In this special issue, Beutel zooms in on the growth of intermediates and the possibilities of using input–output models to assess the trade impacts of fossil fuel subsidy reform and the introduction of taxes on fossil fuels. He believes that input–output tables are a strong complement to (and might even be more appropriate than) CGE models for analysing fuel subsidy reform because they maximize the use of refined input–output data. He gives an example of Austria, which has low energy subsidies but whose input–output data transparency is very high, thereby offering a good overview of what can be done by using input–output analysis.
The importance of the impact of fuel subsidy removal on transport costs and subsequently on trade cannot be underestimated (Flochel and Picarelli, Reference Flochel and Picarelli2018). In this issue, Fuje analyses the particular impact of fossil fuel subsidy reform on transportation costs and, subsequently, on trade in products whose transport costs are an important part of the cost of production. He uses Ethiopia as a case study to assess the impact of fuel price reform on grain price dispersion. He finds that transport fuel subsidy reform in 2008 has impacted remote markets by dispersing prices more compared to markets near the country's capital. This highlights the need for mitigation measures to reduce the impact on households.
Besides CGE models and input–output models, case studies can provide a wealth of information on how exactly fuel subsidies and their reform impact trade. Steenblik provides a historical case study of subsidies to hard coal production and trade in Western Europe, and the sequence of subsidy reform. He describes the long process of reforming coal subsidies and highlights that the reduction in local production as a result of coal subsidy reform did not necessarily lead to an equal increase in imports, mainly as a result of more structural efforts to reduce coal demand. This can lead to substantial benefits for the producers of alternative technologies that can substitute for coal-driven production processes.
5. Conclusion
This article highlighted that fossil fuel subsidies likely have large direct and pass-through impacts. These subsidies foster the competitiveness of domestically produced products vis-à-vis competitors, whether on the domestic market by inhibiting imports or on the international market. Products that benefit from subsidies include three main categories, each of which has large markets, high export values, and dense competition. One can consequentially draw three conclusions:
1. The impacts of producer subsidies on trade of crude energy types such as crude oil, natural gas, and coal are very high, influencing markets that are worth at least US$ 1.3 trillion and in which trade mainly occurs before consumption.
2. The impacts of the pass-through effects of producer subsidies and direct effects of consumer subsidies on markets for refined energy carriers (e.g. gasoline, diesel) are very high, influencing markets that are worth at least US$ 800 billion and in which significant trade occurs before consumption.
3. The impacts of the pass-through effects of producer subsidies and the direct effects of consumer subsidies on energy-intensive markets for non-energy products (e.g. iron and steel, plastics, etc.) are very high, influencing markets that are worth at least another US$1.3 trillion.
Besides these three main trade impacts, there are many more trade impacts, which appear to be large but remain under-researched. These include:
1. The smuggling of fuel and products (energy and non-energy) across borders.
2. The impact on non-subsidizing countries that carry the cost of price appreciation due to increased global demand because of consumer subsidies.
3. The total impact of price controls on GDP.
4. Dissuading alternative fuels from entering domestic markets, including renewable electricity infrastructure.
5. Dissuading cross-border electricity trade.
We can conclude that the trade impacts of fuel subsidies going to crude oil, natural gas, coal, and petroleum products are likely significant, determining who wins on international markets and who loses (i.e. improved market share relative to a no-subsidies counterfactual).
Acknowledgement
The author wishes to thank the International Institute for Sustainable Development and the Graduate Institute of International and Development Studies for their support to the dedicated workshop on trade impacts of fossil fuel subsidies that was held on the 5th of October 2018 in Geneva. The author especially thanks the International Institute for Sustainable Development for continued support of the research on trade impacts of fossil fuel subsidies. A working paper that this chapter draws upon was published by IISD under the title “Exploring the Trade Impacts of Fossil Fuel Subsidies” in March 2020.


