

Appendix Making of the Water Diaries
The narratives of water risks, practices, and institutional responses we present in this book draw on seven years of extensive research by the REACH team. Funded by the United Kingdom Commonwealth and Foreign Development Office (UK FCDO), the REACH Programme (2015–2024) was designed to improve water security for 10 million poor people in Asia and Africa by mobilising science to support governments and practitioners in making policy and investment decisions. The REACH Programme adopted a risk-based approach for framing the global water crisis, acknowledging the multiple natural and ‘manufactured’ drivers of society’s water challenges. A risk framing motivates interdisciplinary research to capture the trade-offs across competing values and objectives across scales and reduce uncertainty in decision-making.
Building on this risk-based approach, we designed our water diaries as a lens to understand how people navigate multiple water related risks in their daily lives. For Khulna, Kitui, and Lodwar, the diaries focused on household drinking and domestic water choices (referred to as ‘Water Diaries’, Section A.2), while in Dhaka, it focused on people’s interactions with river water (referred to as ‘River Diaries’, Section A.3). The analysis of the diaries informed and was informed by a portfolio of social and biophysical research (Section A.4), led by us and our colleagues across the REACH Programme, based at the University of Oxford, BUET, Dhaka University, the International Centre for Diarrheal Disease Research (icddr,b),UNICEF-Bangladesh, and the University of Nairobi. The survey of schools and water supply infrastructure in Kitui county, outlined in Sections A.4 and A.5, were funded by the USAID Sustainable WASH Systems in collaboration with the REACH Programme. The household survey and water infrastructure mapping in Polder 23 of Khulna district were funded by the Research England Internal Global Research Challenges Fund.
Ethical permission for all research activities was obtained from the University of Oxford’s Research and Ethics Guidelines to ensure informed consent, confidentiality, and no harm to all participants. In Kenya, REACH research was registered with the Government of Kenya’s National Commission for Science, Technology and Innovation.
A.1 Diaries: Motivation and Previous Work
The inception of the REACH Programme coincided with the beginning of the SDG era in 2015, with the term ‘water security’ gaining increased prominence among academics and practitioners. Alongside the political urgency to devise plans and chart pathways to reach the SDG targets by 2030, the need for new metrics and methods became more apparent. One such metric was ‘affordability’ – which is not only about how much people spend on water, but what they give up to access water services and what it means for people who prefer to use unpaid or unimproved sources. This seasonal shift to surface water sources proved to be particularly difficult to sustain reliable water services in rural Kenya, where the University of Oxford has incubated a professional maintenance service delivery model (FundiFix) since 2013. Understanding the nature and drivers of water use behaviour – the choices people make in their daily lives across different contexts – could better align policy and practice to cultural values and preferences. By one definition, ‘water security’ is an ‘acceptable’ level of water-related risks, yet what is ‘acceptable’ for individuals and communities was a knowledge gap implicitly embedded in their daily choices.
We were inspired to chart these everyday behaviours through novel methods that went beyond the ‘reductionist’ approaches of large-scale surveys that traditionally fed the aggregate statistics of water access, without acknowledging the risks to safety, reliability, affordability, and equity of water services emerging from use of multiple sources. We drew inspiration from Collins et al. (Reference Collins, Morduch, Rutherford and Ruthven2009)’s ‘Portfolios of the Poor’, which developed the ‘financial diaries’ methodology to study the financial practices of households living in villages and urban slums of South Africa, Bangladesh, and India. Diaries have been used extensively in psychological and health research (e.g. Wiseman et al., Reference Wiseman, Conteh and Matovu2005, Cates et al., Reference Cates, Bishop, Davis, Lowe and Woolley2004, Lawson et al., Reference Lawson, LeMasters and Wilson2004); however, there have been limited examples of its application in studying water use behaviour (e.g. Bishop, Reference Bishop2015, Harriden, Reference Harriden2013, Wutich, Reference Wutich2006) prior to our work.
The diary method is an instrument for individuals/households to record changes in daily processes or practices which may be subject to unpredictable shifts in behaviour or outcomes, for example, the effects of seasonality on household incomes and expenditures. In such cases, simple ‘snapshots’ of behaviour at a particular time may not capture the temporal variations. Compared to other research tools, diaries are less likely to suffer from problems of recall bias as they rely on short-term memory (Bolger et al., Reference Bolger, Davis and Rafaeli2003). Wutich (Reference Wutich2009) found that the diary method yielded the most accurate estimate of per capita water use over a week compared to prompted recall and free recall methods, which either underestimated overall water use or missed out relatively low-volume water use tasks like washing and cleaning. However, as diaries are produced by participants in their own time and setting in absence of the researcher, participants need to be trained thoroughly to ensure accuracy of data being recorded and minimise confusions in making entries (Wiseman et al., Reference Wiseman, Conteh and Matovu2005). Regular communication between the researcher and the participant is required to keep the latter motivated and build trust between both parties. This can restrict the sample size due to resource constraints, creating a trade-off between breadth and depth of data collected.
The design and implementation of the diary method is often guided by issues relating to (1) the structure and content; (2) duration and frequency; (3) respondent attrition and fatigue; (4) compensation; and (5) use of complementary methods. Water diaries intended to capture household water use behaviour usually involve structured charts, outlining the sources, purposes, and volumes of water used by individuals (e.g. Harriden, Reference Harriden2013, Wutich, Reference Wutich2006). However, if the research requires participants to record the social interactions embedded in their daily quest to access to water and reflect on these events from their own perspectives, the researcher may design an unstructured or semi-structured diary (Bishop, Reference Bishop2015). As diaries usually require participants to read and write or have someone to make entries on their behalf, pictorial diaries often proved to be more appropriate in settings with high levels of illiteracy. Wutich (Reference Wutich2006), for example, used illustrations of different water sources, water use tasks, and container types to estimate the source and volume of water used by each household member for consumptive, hygiene, and domestic needs in an urban slum in Bolivia. While pictorial diaries can potentially overcome the literacy barrier, care must be taken to ensure that illustrations are sensitive to cultural perceptions (Wiseman et al., Reference Wiseman, Conteh and Matovu2005).
The duration and frequency of the diary keeping exercise largely depends on the data requirements of the research. Shorter diaries, maintained over a few days to a week, require less time commitment from the participants and are unlikely to be affected by fatigue or dropouts. Harriden (Reference Harriden2013)’s study of intra-household water use behaviour in Australia, for example, required participants to record all water use activities over a week, particularly noting who used water, for how long, in what quantity, at which time, and for what purpose. Longer diaries, on the other hand, can suffer from respondent attrition and research fatigue, but may be necessary to capture temporal variations. A noteworthy example is Wiseman et al. (Reference Wiseman, Conteh and Matovu2005)’s study of financial transactions in rural Tanzania and the Gambia, where participants were asked to maintain a pictorial financial diary every day for a year. The authors noted a dropout rate of around 20 per cent and found that successful maintenance of longer diaries depended on the level of trust between the diarist and the field researchers, who visited the diarists regularly to keep them engaged. It is important not only to note the dropout rate but also ensure that those who dropped out are not systematically different from the whole population. Longer diaries can also create a ‘conditioning effect’, whereby participants may become tired of keeping records on similar-seeming activities leading to abbreviated or less thorough entries (Wiseman et al., Reference Wiseman, Conteh and Matovu2005). If they miss an entry, they may also go back and ‘fill in’ what they missed, thus, undermining one of the core purposes of using diaries (Bishop, Reference Bishop2015, Bolger et al., Reference Bolger, Davis and Rafaeli2003).
Since diaries require long-term commitment from the participants, researchers often provide financial incentives to motivate participants or to compensate for their time and effort. This raises methodological and ethical concerns among the research community. As experienced by Meth (Reference Meth2003), offering payments for participation can specifically attract economically vulnerable people and may cause resentment among those not selected for the study. Others argue that the need for compensation depends on the complexity of task required (Bartlett and Milligan, Reference Bartlett, Milligan and Crow2015). The water use behaviour study by Wutich (Reference Wutich2006), where each household was offered USD 2.50, involved day-long diary keeping by each household member, followed by extensive interviews that required participants to recall their water use activities during the preceding week.
Diaries are often combined with alternative research tools such as interviews, observations, questionnaire surveys, and focus group discussions (FSD Kenya, 2014, Wutich, Reference Wutich2009, Wiseman et al., Reference Wiseman, Conteh and Matovu2005). These are necessary for collecting baseline data that can better inform the diary design, for engaging participants at different stages of the research process, for ensuring compliance and proper recording of events/activities, for keeping up participants’ morale, and most importantly, for triangulating data from different modes of enquiry. For example, the Collins et al. (Reference Collins, Morduch, Rutherford and Ruthven2009)’s ‘financial diaries’ methodology involved baseline questionnaire surveys on demographics, income sources, assets, and financial tools, followed by year-long bi-monthly financial diary visits during which interviewers captured detailed data on all cash flows over the preceding two weeks, as well as any events that may have influence household welfare during that period.
A.2 Water Diaries: Household Water Source Choices in Khulna, Kitui, and Lodwar
A.2.1 Designing the Diaries
Our diary methodology was aimed to capture households’ water source choices, which can be shaped by a range of concurrent factors, including rainfall variability, operational disruption of infrastructure, costs of water, household income and expenditures, and time spent in collecting water. Given the low literacy level among rural participants, we made the diary as simple as possible so that it was easily comprehensible by the respondents, and not considered too burdensome to fill in on a daily basis. Pictorial charts were used to record data with written input from participants being limited to ticks, crosses, and numbers. Each day’s diary was restricted to two pages to minimise printing costs and reduce paper use. The charts comprised of three sections – (1) water sources, amount of water fetched, cost of water whether payments were made or not, and collection responsibilities disaggregated by gender; (2) sufficiency for drinking, washing, bathing, livestock, and small-scale irrigation (only for Kenya); and (3) household expenditures on food, education, health, transport, energy, and miscellaneous items.
The preliminary diary design was pretested in March 2017 with adult women from an all-female water user committee in Kyuso town in Mwingi-North subcounty. The design was based on an extensive review of the literature on the diary method and the state of the water supply situation in rural Kenya, as well as the context specific knowledge and expertise of researchers working in the region. We invited about 15 women to attend a 2-hour focus group discussion, of whom 11 attended. Women were intentionally recruited as they are usually responsible for fetching water for the household and hence, have the best knowledge on this matter. The purpose of the focus group discussion was to explain the diary method to the participants and identify whether the methodological design was appropriate for the local context and easily comprehensible by the participants. Following the group training, the participants were given printed copies of the diary sheets and requested to fill them every day for the next month. During this month, the research assistant visited all households every week to ensure they were filling the diaries accurately, and also enquire about noteworthy entries, including unusual expenditures, change in water sources, or high volumes of water collected. Analysis of this pilot diary data, elaborated in Hoque and Hope (Reference Hoque and Hope2018), showed promising results indicating the potential for scale up to a large sample size over a longer time period.
The diary design for the main study varied slightly across the study sites to account for contextual differences. Unlike the Kitui water diaries shown in Figure 1.2, the Khulna diaries did not have the section for sufficiency, as quantity of water for domestic purposes is not a concern in Bangladesh (Figure A.1). The quantity of water used per day could be easily quantified in Kenyan contexts, as households generally used the same source for all purposes in a given day, water was mostly collected in standard sized jerrycans, and use of water at source, for example, washing and bathing at a pond, was rare. However, calculations on consumption per capita are aggregate estimates, as part of the water may have been used for livestock or house construction purposes. For Khulna, the amount of water could only be quantified when fetched from off-site sources such as vended water or pond sand filter, but not for sources on-site sources such as tube wells and rainwater harvesting. Hence, while we could estimate ‘amount of water in litres by source’ fetched by the four expenditure clusters in Kitui (Figure 4.5), we used ‘proportion of days per month’ a given source was used by the four expenditure clusters in Khulna (Figure 3.6). For Kitui and Lodwar, the column on ‘Who collected the water?’ included boys and girls as well; however, in Khulna, although children accompanied mothers for water collection, their involvement was minimal, and hence, were excluded from the diary chart.
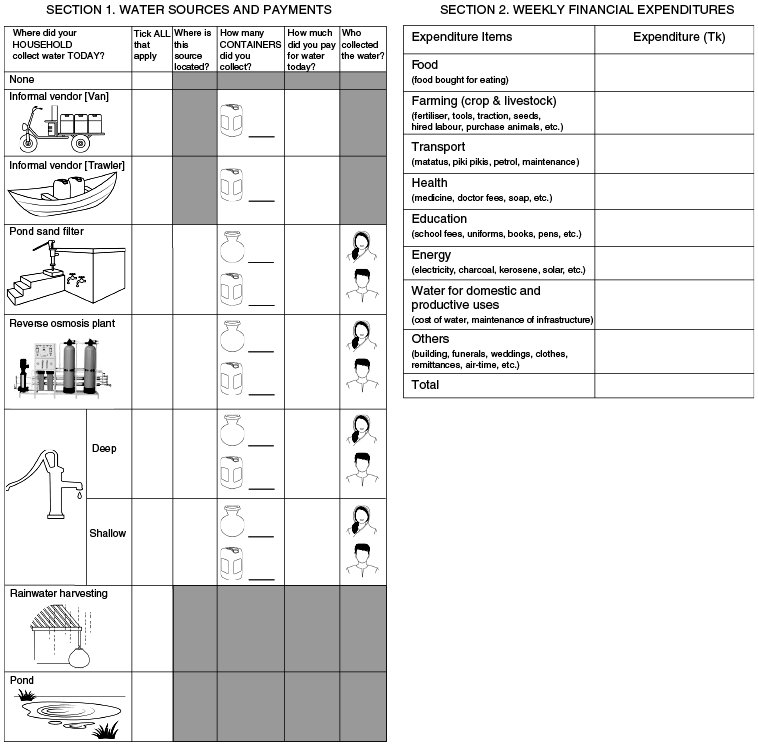
Figure A.1 The water diary charts designed for Khulna, Bangladesh, which were translated to Bangla. One hundred and twenty households from the southern part of Polder 29 participated in the diary study from May 2018 to April 2019.
The need for simplicity inevitably restricted the depth of data collected. Firstly, while households ticked the type of water infrastructure used, details of the specific waterpoint were not recorded, making it difficult to match it with the water audit data. In Kitui and Lodwar, for example, participants continued to tick handpump, even when they shifted from one handpump to another due to breakdown or fall in water table. In Khulna, there was an additional column on ‘Where is the source located?’, but entries were often ambiguous like ‘neighbour’ or ‘market’. Secondly, we did not ask respondents whether the water was used for drinking or other purposes, which was particularly problematic in Khulna where different sources were often used on the same day. Third, we did not track changes in the number of people living in the house each week, or the livestock herd composition and size, which would have affected water use. This was particularly important for Kenya, where children often stayed away from home on weekdays or school term time, and many adults lived elsewhere from time to time for work.
A.2.2 Sampling and Training Diary Participants
The household survey datasets (see Section A.5) provided the sampling frame for the water diaries in Khulna, Kitui, and Lodwar. A subset of the surveyed areas was selected for the diary study – southern part of Polder 29 in Khulna, Kyuso and Tseikuru wards of Mwingi-North subcounty in Kitui and within the piped network area in Lodwar town. Survey data on ‘wealth status’ (poor or non-poor) and ‘concerns for water’ (‘water is costly’, ‘water is unsafe to drink’ and ‘others’) were used as selection criteria (see Section A.5). ‘Water is costly’ and ‘Water is unsafe to drink’ were considered as proxy indicators of affordability and quality respectively. A 3×2 matrix was created, allocating 25 households to each of the four main categories (Poor + costly, Poor + unsafe, Non-poor + costly, Non-poor + unsafe) and 10 households to each of the two other categories. An additional 30 households, five from each category, were selected for the backup list.
The sampling strategy involved three steps: First, the data was cleaned by removing households without at least one contact number and missing geolocations. Second, the household list by disaggregated by ‘diary category’, resulting in six lists and shapefiles. Third, ArcGIS 10.5 was used to randomly select 150 households from the sampling framework, 30 from each of the first four diary categories and 15 from each of the last two. The additional 30 households, five under each category, were part of a backup list used to recruit households in case the ones from the primary list refused to participate. In Khulna, given the relatively lower costs and more manpower in the local team, all selected households were visited in-person, and both husband and wife were invited for a 2-hour training session at the REACH Polder 29 office, with transport prearranged by the team. The trainings were led by the author (Sonia Hoque) and held in Bangla over six sessions March 2018, with groups of 20 households and approximately 40 people in each. In Kitui and Lodwar, the diary trainings were held in May 2018 and led by research assistants in the Kikamba and Swahili (and Turkana language), respectively. Households were contacted by phone and one adult member was invited from each selected household. If any of the preselected households were unavailable or unwilling to attend the training, another household was selected from the backup list. Participants were compensated with cash for their time and transport expenses.
The trained households were asked to complete a one-week pilot study which gave them an opportunity to better understand and practice filling the diaries. During the week, the research assistants visited all households in turn to ensure that participants completed the tasks accurately. More importantly, it allowed the research assistants to train other household members, such as school going children, where the adult participant struggled with literacy. It was vital for the research assistants to build a strong rapport with their allocated households – a relationship that kept participants motivated over the course of the study and appreciate the value of their engagement with research. At the end of the week, the research assistants entered the diary data in a digital form programmed in ONA (a mobile data collection platform) for it to be checked by the lead researcher.
A.2.3 A Year of Diary Keeping
The main phase started a week after the pilot phase and continued for 52 weeks – from 28 April 2018 in Khulna, and 31 July 2018 in Kitui and Lodwar. Though we invited 120 households for training in each site, the main phase in Kitui and Lodwar started off with 115 and 98 households, respectively, owing to non-attendance and dropouts post pilot. In Khulna, a couple of households who dropped out post pilot were replaced with others from the backup list; hence, the main phase started off with 120 households. During the main study, research assistants visited the households bi-weekly to collect the completed diaries (Figure A.2) and ask follow-up questions on any noteworthy events such as health problems, visits by family and friends, large purchases or water infrastructure breakdown that may have affected their water use and spending behaviour. The data collected was submitted bi-weekly through ONA and checked by the lead author regularly so that data-entry errors and queries can be addressed promptly. There were two enumerators in Khulna, each responsible for 60 households, while Kitui and Lodwar had four enumerators each.
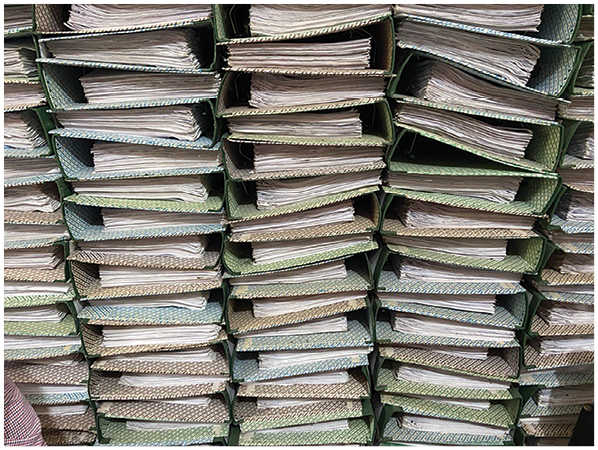
Figure A.2 Water diary sheets filed by household ID and stacked in REACH Polder 29 office in Khulna.
Retention of participants and regular submission of data seemed particularly difficult for Lodwar, as reflected by the weekly diary submission data (Figure A.3). Lodwar’s harsh climate, difficult transport routes, the high mobility of the population and the need to visit the same household multiple times, made it challenging for enumerators to maintain close contact with participants as often as planned. In Kitui, the large distances between households meant that enumerators could not visit all households at the same interval but maintained regular contact with them over phone. The dedication and intelligence of enumerators mattered greatly in keeping participants motivated, recognising data errors, and responding to data queries. It was ensured that all households retained for analysis had at least 35 weeks of data.
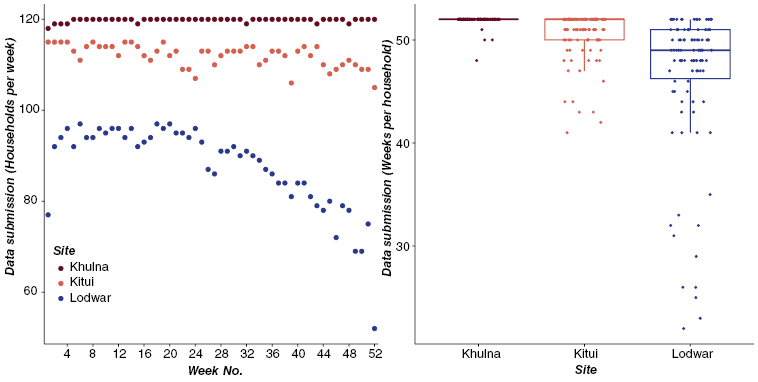
Figure A.3 Completed water diaries submitted by week and by number of households in Khulna, Kitui, and Lodwar.
Compensation was critical to keep households motivated for such long-term engagement. In Khulna, each household was delivered a packet of essential groceries (such as cooking oil, rice, pulses, and soap) worth USD 5 at the end of each month. The selection of items was based on feedback from the participants, ensuring that the needs of women participants were particularly met. In Kitui and Lodwar, participants were given store vouchers worth USD 5, as it was logistically not possible to buy and transport goods every month.
A.2.4 Data Analysis
The water diaries generated daily data on water sources, amount and payments, and week wise data on food, education, healthcare, and other expenses. For analysis, monthly totals were calculated for all required variables, adjusting for missing days. For example, in Khulna, the proportion of days per month that a household used each of the six available water sources (i.e. deep tube well, shallow tube well, pond sand filter, vendor, rainwater harvesting and pond) was calculated, while in Kitui, the total volume of water collected over the month was calculated for each of the nine sources (i.e. earthdams, hand-dug wells, handpumps, kiosks, dry riverbed scooping, vendors, rainwater harvesting, rock catchments, and rivers). Data for missing weeks were substituted with averages for the weeks available for the given month for that household.
For identification of expenditure groups In Kitui and Khulna, a k-means cluster analysis was carried out in IBM SPSS 23 using household monthly water expenditures as the input variable and 4 as the number of clusters. K-means clustering segments the data in such a way that the within-cluster variation is minimised (Mooi and Sarstedt, Reference Mooi and Sarstedt2011). Descriptive statistics and plots were used to characterise source choices and expenditure patterns of the four identified clusters, which were named as high regular expenditure, moderate regular expenditure, no/low expenditure, and seasonal expenditure groups, respectively. While there were noticeable differences in the wealth status and location of households between the four clusters, these were not statistically significant. In Lodwar, cluster analysis was not conducted owing to absence of seasonal or spatial patterns in water source choices and expenditures within Lodwar Water and Sanitation Company (LOWASCO)’s service area. Similar findings were observed in our water diary study in Wukro, Ethiopia, a small town with unreliable piped water supply (Grasham et al., Reference Grasham, Hoque, Korzenevica, Fuente, Goyol, Verstraete, Mueze, Tsadik, Zeleke and Charles2022).
A.3 River Diaries: Direct Observation of River Use Behaviour in Dhaka
In Dhaka, we designed and implemented a ‘structured direct observation’ study to monitor the gender- and age-disaggregated daily river water use practices in relation to the spatial and temporal variations in water quality risks. Direct observation is an established method in social science research whereby the researcher uses a pre-designed questionnaire to collect standardised quantitative information on the research subjects in their usual environment without any alterations. Early examples of direct observation can be found in the medical anthropology literature, where researchers observed the patterns of human contact with water bodies to evaluate the pathways of schistosomiasis transmission (Slootweg et al., Reference Slootweg, Kooyman, de Koning and van Schooten1993, Dalton and Pole, Reference Dalton and Pole1978, Dalton, Reference Dalton1976) with more recent applications is monitoring handwashing behaviour in rural South Asia (Halder et al., Reference Halder, Tronchet, Akhter, Bhuiya, Johnston and Luby2010, Ram et al., Reference Ram, Halder, Granger, Jones, Hall, Hitchcock, Wright, Nygren, Islam, Molyneaux and Luby2010).
We conducted our study in two phases, inspired from a one-week observation study along Tongi Khal led by Villanueva (Reference Villanueva2016) as part of his MSc dissertation. The first phase was carried out over an 18-day period in the dry season (9–26 February 2019) which coincided with the Bishwa Ijtema held in two groups of three consecutive days. The second phase was conducted for a 15-day period in the wet season (20 August–3 September 2019). We selected ten observation points, two of which were in Zone-1, seven in Zone-3, and one in Zone-4. The site selection involved multiple scoping visits to the household survey areas to identify spots with observable river use activities, as well as ensuring spatial distribution, diversity of river interactions, accessibility and security for field team, and alignment with river water quality monitoring points. Zone-2 was excluded as we did not find any interactions with the river during our scoping visits, as the short river branch flowing through the bottom part of Zone-2 remains dry for part of the year. During analysis, as shown in Figure 2.5, we merged results from the ten observation points into six sites in three zones, namely, Konabari (Zone-1), Ijtema field, Tongi slum, Abdullahpur and Railway Bridge (Zone-2) and Mausaid (Zone-3).
Each observation day comprised three-hour slots: 7–10 am (morning); 10.30–1.30 pm (midday); and 2.30–5.30 pm (afternoon) during which enumerators recorded their observations in an electronic form in a tablet, whereby an ‘observation’ is defined as any activity conducted by an individual or group visible within the enumerator’s field of view. Thus, each slot comprised several observations, with each observation including one or more activities. Over the 33 study days, we recorded about 7,900 observations for 852 slots. River users were visually categorised as children and adolescents (less than 16 years of age) and adults, as male and female, and also as groups and individuals. Differentiation of age was based on enumerators’ judgment; some adolescents and young adults may have been misclassified. Activities were listed as drinking, food washing, water collection, dish washing, laundry, washing oneself, bathing, using hanging latrine, open defecation, urination, fishing, swimming, boating, and other. These activities were listed as multiple-choice questions, as multiple tasks were often conducted by different individuals in a group. Enumerators were given clear guidelines for certain activities; for example, if fishing was done on a boat, the activity was recorded as fishing and not boating. Enumerators also took a photo for each observation, following approved ethical guidelines, which were inspected by the lead author to resolve issues in data entry.
A.4 Diaries as Part of Interdisciplinary Research
The water diaries in each site were complemented by a suite of social and biophysical research methods depending on the broader research objectives of the REACH Programme. The methods outlined (Figure A.4) are those relevant for the data presented in this book, and not necessarily capture the full extent of the work in each site.
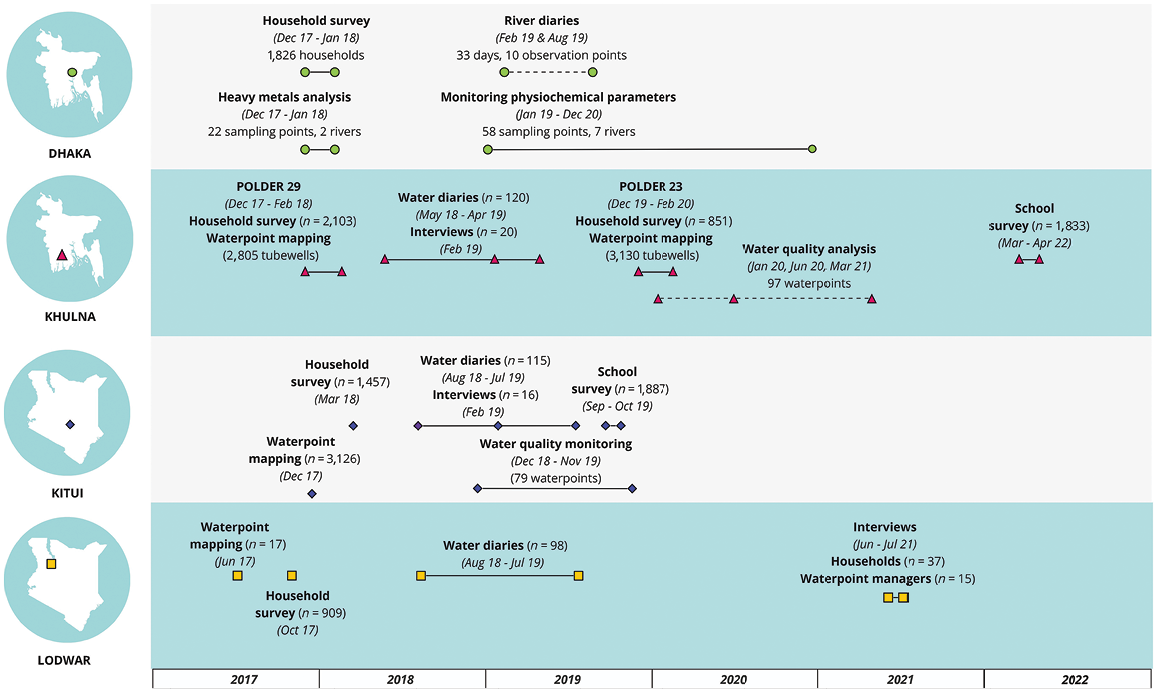
Figure A.4 Timeline of water diaries and complementary methods across the four sites in Bangladesh and Kenya.
A.4.1 Cross-sectional Household Surveys
Household surveys were among the first study tools we administered in each of our sites to understand the types and distribution of water risks across households. The questionnaire was designed to gather baseline data on sociodemographic profile, asset ownership, housing structures, access to water and sanitation facilities, and development concerns/ priorities, with minor contextual modifications for each site. Between October 2017 and February 2018, we surveyed about 7,000 households across our four sites – Polder 29 in Khulna district, along the Turag River and Tongi Khal in Dhaka and Gazipur districts, Mwingi-North subcounty in Kitui county, and Lodwar town and its peripheral areas in Turkana county. An additional 2,000 households were surveyed in Polder 23 of Khulna district in January–February 2020.
Household selection ensured uniform spatial representation either through stratified random sampling or through random transect walks. For example, in Dhaka, we covered all settlements within 1 km buffer zone along the river, using a random walk method to select every 10th household within each settlement. In Khulna, where mouza level (Tier 5 administrative boundary) census data was available, a stratified random sampling method was used to select 10 per cent of households from high-risk mouzas and 5 per cent from low-risk ones on Polder 29. The surveys were conducted in the local languages on ONA data collection platform via locally recruited enumerators, trained and supervised by researchers at our local partner institutions. Data from these surveys are illustrated in Figures 3.4 and 5.3, showing the main sources of drinking water in Polder 29 and Lodwar town, respectively.
The survey datasets provided the sampling frame for the water diaries in Khulna, Kitui, and Lodwar, with data on ‘wealth status’ (poor or non-poor) and ‘concerns for water’ (‘water is costly’, ‘water is unsafe to drink’ and ‘others’) being used as selection criteria. Wealth status was generated through principal component analysis of selected variables on education, housing structures, durable assets, and possession of consumable goods (for Kenya only). The factor loadings of the first principal component served as the weights of selected asset variables, while and the factor scores were regarded as the wealth index of each household. The median value was used to categorise households into ‘poor’ and ‘non-poor’ categories. During the survey, households also ranked their top three development priorities amongst 13 options that included healthcare, education, roads, water services, and flood protection amongst others. Those who expressed concerns about drinking water services were further asked to characterise their concerns in terms of quality (unsafe), quantity (insufficient), affordability (costly), and reliability.
A.4.2 Interviews
A sample of the diary households, 20 in Khulna and 15 in Kitui, were interviewed in February 2019 by the lead researcher (Sonia Hoque) to gain further insights into the drivers of recorded water choices. The quantitative diary data on household water choices and expenditures, for the number of weeks completed before the interviews, were used to select the households and guide the interview questions and discussions.
In Lodwar, the interviews were intended to understand how households navigate the dual risks of flash floods and unreliable or unavailable water services, and the challenges of relocating to peri-urban areas. Interviews involved in-depth narratives of the respondents’ life histories, exploring their experiences of droughts, conflicts, or migration, their family dynamics, and income generating activities to better situate their water-related decisions within the broader struggles of daily life. Thirty-seven households from eight villages were interviewed in July and August 2021 by two local research assistants, who were recruited and trained remotely by the lead author. The villages were selected purposively to represent those affected by flash floods and those that the flood victims migrated to. While selecting households within each village, the research assistants ensured spatial representation, though in some instances, participant recruitment depended on availability during the time of visit. The interviews were conducted in the local language, with the research assistants taking written notes that they later translated and transcribed. In addition, a short, structured questionnaire was used to collect data on the household’s sociodemographic profile at the end of each interview.
In Dhaka, interviews were conducted to understand the impacts of pollution exposure through monsoon flooding. Following exploratory visits, two sites were selected – a peri-urban community in Islampur along the Turag River and a rural community in Hazratpur, a few downstream of the Savar tannery estate along the Dhaleswari River. Ten interviews were conducted in each site by a research assistant in March 2023.
A.4.3 Water Infrastructure Mapping
One of the major drivers of source choice is the availability of waterpoints and their associated characteristics, such as distance, water quality, reliability, and costs. Water supply infrastructure was mapped in Khulna, Kitui, and Lodwar in multiple phases, recording the location, technical specifications, water usage patterns, and operation and maintenance information.
In Khulna, the water infrastructure audit comprised four components: (1) survey of all public and private tube wells in the southern half (high salinity area) of Polder 29 and Polder 23 (n = 5,707) (illustrated in Figure 3.2), and a selected sample in the northern half (low salinity area) of Polder 29; (2) a survey of all non-tube well sources including small piped schemes, ponds sand filters, rainwater reservoirs, community ponds and desalination plants in Polders 29 (illustrated in Figure 3.4) and Polder 23; (3) survey of all desalination plants in entire Paikgachha upazila (within which Polder 23 is located) and Dacope upazila; and (4) survey of all piped water schemes in Khulna district, excluding Khulna city corporation. The respondents were either owners or managers of these waterpoints, and provided data on the location, capital investments, source of funds, ownership, installation date, functionality, technical specifications, user payments, and management of the water infrastructure.
In Kitui, a total of 3,126 water supply infrastructure and unequipped sources were mapped over two phases, starting from Mwingi-North subcounty in August 2016, and extending to the entire Kitui county in November–December 2017. The combined survey covered 687 hand pumps, 460 piped schemes, 655 sand dams, 613 earth dams, 268 shallow wells, 89 rock catchments, 28 springs, and 52 incomplete boreholes, with a questionnaire similar to the one in Khulna though with a greater emphasis on breakdown and repair events.
Waterpoints in Lodwar were partially mapped by different researchers at different times and the data from these exercises were combined to illustrate the distribution of water supply infrastructure in the town (see Figure 5.6). The location of LOWASCO boreholes, piped network and kiosks were first mapped in June 2017 as part of Maxwell et al. (Reference Maxwell, Olago, Dulo and Odira2020)’s MSc dissertation, followed by interviews with owners or managers of selected waterpoints in June 2021. The latter was intended to complement the in-depth household interviews in eight villages discussed earlier, covering seven functional LOWASCO kiosks, six water tanks owned by the county government or by private enterprises, and two handpumps. For non-functional waterpoints, which included four handpumps, four kiosks, and three tanks, only the GPS coordinates and photos were recorded. This dataset was further updated during a field visit in February 2022 and separate infrastructure audit conducted in selected urban, peri-urban, and rural areas in Turkana Central subcounty in June 2023.
A.4.4 Tracking Waterpoint Expenditures and User Payments
Household water source choices have significant impacts on revenue collection for different water supply infrastructure and the ability of waterpoint managers to provide reliable operation and maintenance services. We trained owners or managers of 16 waterpoints in Khulna to keep records of all user payments and operation and maintenance expenses for a year from September 2019 to August 2020. These included four motorised tube wells used by water vendors, one piped water scheme, ten pond sand filters, and one reverse osmosis plant In Polder 29 (refer to results in Section 3.4). All managers were provided with logbooks and compensated for their time, with regular visits by field officers to monitor the data collection process.
A.4.5 River Water Quality Monitoring
A water quality monitoring system was developed and implemented by our colleagues at BUET to analyse the spatial and seasonal changes in the health of Greater Dhaka’s River systems between 2017 and 2021. This involved two sub-studies – (1) monthly monitoring of physiochemical parameters, starting from the Turag River and Tongi Khal in 2017 and expanding to 58 sampling points covering the entire watershed in 2020–2021; (2) analysis of 18 heavy metals and biotoxicity at 22 sampling points in December 2017 and January 2018.
For the first sub-study, samples were collected from a boat at 2 m depth, followed by field analysis of temperature, pH, dissolved oxygen, oxidation-reduction potential, electrical conductivity, and total dissolved solids using portable meters. Laboratory analysis was conducted for colour, alkalinity, dissolved organic carbon, ammoniacal nitrogen, nitrate, phosphate, iron (ferrous), chloride, sulphate, and sulphide ions, and pathogens (total coliforms and E. coli). To present the relative changes in river health over monsoon, post-monsoon, and dry seasons in 2019 and 2020 (refer to Figure 2.3), a Water Quality Index was calculated for each of the river reaches using the method adopted by the Canadian Council of Ministers of the Environment. The index comprises 15 parameters, namely temperature, pH, electrical conductivity, dissolved oxygen, oxidation-reduction potential, turbidity, colour, alkalinity, iron, ammonia-nitrogen, nitrate, phosphate, sulphide, sulphate, and chloride.
For the second sub-study, concentrations of heavy metals were analysed at the Department of Earth Sciences, Oxford University through Inductively Coupled Plasma Mass Spectrometry. The heavy metal data was used by Oxford Molecular Biosensors to develop bacterially derived sensors to detect the bioavailability of specific chemicals and their overall cell damage toxicity (see Rampley et al., Reference Rampley, Whitehead, Softley, Hossain, Jin, David, Shawal, Das, Thompson, Huang, Peters, Holdship, Hope and Alabaster2019).
A.4.6 Drinking Water Quality Analysis
Water samples were analysed for chemical and microbial contamination for waterpoints mapped in Khulna and Kitui. In Khulna, the electrical conductivity was measured in-situ for all functional tube wells using portable meters during the water infrastructure mapping in Polder 29 and Polder 23, covering 6,289 public and private tube wells (see Figure 3.2). Along with data on tube well depth, these salinity values were used to analyse the local hydrogeology, in terms of aquifer availability and groundwater quality (see Akhter et al., Reference Akhter, Naz, Salehin, Arif, Hoque, Hope and Rahman2023). In Polder 29, a sample of 97 waterpoints, comprising deep tube wells, shallow tube wells and pond sand filters, were selected to understand seasonal variations in water quality across different infrastructure types. Water samples were collected by trained staff from icddr,b in January 2020, June 2020 and March 2021 and tested for arsenic, manganese, chlorides and E. coli, as shown in Figure 3.7.
In Mwingi-North subcounty, a water quality monitoring study was designed to assess the perceptions of drinking water safety and responses of waterpoint managers to detection of chemical or microbial contamination (refer to Nowicki et al., Reference Nowicki, Bukachi, Hoque, Katuva, Musyoka, Sammy, Mwaniki, Omia, Wambua and Charles2022). Between December 2019 and November 2020, water samples were collected monthly from 79 water sources, including 12 handpumps, 52 piped groundwater taps, from 25 schemes (including 10 mixed tanks with rainwater collection), 3 earth dams, 5 open wells, and 7 piped surface water taps from 4 schemes. These were analysed for chemical (pH, conductivity, turbidity, fluoride) and microbial (E. coli and total coliforms), of which the results for conductivity and E. coli are displayed in Figure 4.4 for selected waterpoints.
A.5 Water Services in Rural Schools in Khulna and Kitui
A total of 1,887 primary and secondary schools in Kitui County were surveyed in September–October 2019 (Hope et al., Reference Hope, Katuva, Nyaga, Koehler, Charles, Nowicki, Dyer, Olago, Tanui, Trevett, Thomas and Gladstone2021b), followed by a similar survey of 1843 government, private and religious schools in Khulna district in March–April 2022. The surveys were aimed to understand the state of water services in schools, with details on technical specifications, repair and maintenance activities, water safety, and funding and expenditures for all water supply sources used. Standard questions on sanitation and hygiene by the Joint Monitoring Programme (WHO/UNICEF, 2018) were also included to obtain a comprehensive baseline of water, sanitation and hygiene facilities. In Bangladesh, the survey also involved sanitary inspection of drinking water infrastructure. Data from the school survey in Bangladesh informed the projection of costs and logistics for scaling up SafePani from the pilot unions to the entire district. The Kitui survey involved 26 enumerators, trained and supervised by a locally based research manager. The survey in Khulna was conducted by a team of 70 enumerators, coordinated by field managers based at the REACH Polder 29 office and remotely supervised by the author (Sonia Hoque). Both surveys were conducted in ONA data collection platform using tablets and mobile phones.

 Open access